Jun 17, 2013 - illumination. QE maps with very small distances (10 nm) between .... entire photocathode surface followed by a small step size. (16 m) map of ...
PHYSICAL REVIEW SPECIAL TOPICS - ACCELERATORS AND BEAMS 16, 062802 (2013)
Photocathode quantum efficiency mapping at high resolution using a digital micromirror device B. C. Riddick, E. J. Montgomery, R. B. Fiorito, H. D. Zhang, A. G. Shkvarunets, Z. Pan, and S. A. Khan Institute for Research in Electronics and Applied Physics, University of Maryland, College Park, Maryland 20742, USA (Received 14 March 2013; published 17 June 2013) An electron beam’s quality is fundamentally limited by its attributes at the cathode. The emission from photocathodes can be bright, but not necessarily uniform. Quantum efficiency (QE) maps generated by selectively illuminating the cathode surface reveal this nonuniformity. In this paper a proof-of-principle experiment is described in which a high resolution map of the QE is generated using a digital micromirror device. We show a substantial improvement over the best results reported for laser raster scanning. DOI: 10.1103/PhysRevSTAB.16.062802
PACS numbers: 85.60.Ha
I. INTRODUCTION Photocathodes are promising electron sources for high performance free electron lasers and future acceleratorbased light sources [1]. However, no single cathode can simultaneously meet all demands on quantum efficiency (QE), lifetime, emittance, brightness, and response time. Alkali-based cathodes achieve good QE and brightness, whereas metals are superior in long life and fast response time [2]. The emittance of the electron beam generated from a cathode only worsens during transport due to nonlinear forces, so advances in electron beam quality can only be driven by trade-offs such as emittance exchange, or by better understanding desired electron emission properties such as intrinsic emittance and uniform current density. The initial transverse current density profile is driven in part by the variation in photoemission (variation in QE) at the cathode surface. Local variation in surface structure, adsorbed contaminants, or stoichiometry can drastically affect local photoemission. In practice, measured QE is a weighted average over the illuminated area, with the weighting determined by the transverse laser intensity profile. QE can be mapped by using a laser spot smaller than the diameter of the drive laser used for electron beam generation. If two different cathodes have the same average QE over the typical drive laser spot size, a QE map using a smaller laser spot size can determine which is more uniform. If the drive laser spot is smaller than the cathode and there is freedom in choosing the photoemission site, a QE map of the full cathode can reveal favorable positions for illumination. QE maps with very small distances (10 nm) between adjacent points can be measured using photoemission electron microscopy (PEEM) [3,4], but this method requires either the cathode to be moved to a separate apparatus, or PEEM built into the system. The latter is not
Published by the American Physical Society under the terms of the Creative Commons Attribution 3.0 License. Further distribution of this work must maintain attribution to the author(s) and the published article’s title, journal citation, and DOI.
1098-4402=13=16(6)=062802(4)
feasible for accelerators. Alternatively, raster scanning a focused laser spot across the cathode surface can be performed in situ. QE maps generated in this way are quantified with the laser spot size and the laser step size. The step size is the center-to-center distance between adjacent points on the QE map. Spot sizes of 200 �m to 1 mm full width at half maximum (FWHM) and step sizes of 40 to 500 �m have been reported in the literature [5–9]. More recent work [9] on in situ laser raster scanning of photocathodes demonstrates a 71 �m FWHM laser spot and 30 �m step size, but reports a QE map using larger parameters. Published practice for raster scanning uses a step size equal to or smaller than the spot size [5–9]. A smaller step size results in overlap between neighboring measurement position, so a QE map generated in this way is smoother than what would be seen if the spot size could be reduced to the step size. Literature for raster scan QE maps often ignores this smoothing and uses the term resolution to refer to either step size or spot size. We will avoid confusion in this paper by referring individually to step size and spot size rather than resolution. We report a new method of generating QE maps which uses a Texas Instruments digital micromirror device (DMD). We use the DMD to produce pixel level maps with a 47 �m FWHM spot size and a 16 �m step size, the smallest of any QE mapping method yet reported in the literature suitable for in situ measurements in photoinjectors [10]. Other advantages of using a DMD for mapping QE are simplicity and speed. Our DMD array can be refreshed at rates up to 9.8 kHz. II. EXPERIMENTAL SETUP The measurements reported here use a Texas Instruments DMD ‘‘Discovery 1100,’’ a 1024�768 array of micromirrors physically integrated with a control board. The total size of the array is 14:0 � 10:5 mm. The DMD is controlled by a universal serial bus (USB) connection to a Windows PC. The distance between the centers of neighboring micromirrors (the pitch) is 13:68 �m, which
062802-1
Published by the American Physical Society
B. C. RIDDICK et al.
Phys. Rev. ST Accel. Beams 16, 062802 (2013)
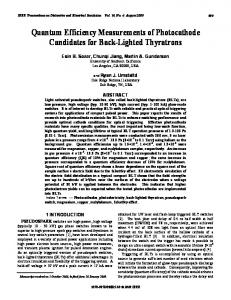
FIG. 1. Image adapted from Texas Instruments. Magnified view of a DMD. In the center, a mirror has been removed, revealing the underlying architecture. Each mirror can be rotated about the diagonal axis indicated in the image. The DMD used in the experiment consists of a 1024 � 768 array of mirrors. To make the two stable mirror positions correspond to reflecting incident light horizontally, the DMD is rotated so that the mirror diagonal is perpendicular to the benchtop.
includes a 1 �m gap between mirrors. Each mirror can be individually flipped to one of two stable positions 12 degrees from normal via electrodes under two of each mirror’s corners (Fig. 1). The cathode used for proof-of-principle QE maps is cesiated tungsten of the controlled porosity reservoir design being investigated by the University of Maryland [12]. The goal of this design is to increase both electron emission uniformity and cathode lifetime. The cathode was intentionally contaminated prior to mapping to partially deplete QE and increase local variation in emission. The chamber pressure while mapping is 3 � 10�10 Torr. The spatially averaged QE is about half that corresponding to the ideal cesium submonolayer work function minimum [13]. The optical arrangement is similar to that previously reported for beam halo imaging [14]. A simplified experimental schematic is shown in Fig. 2. A 405 nm CW laser (CrystaLaser BCL-100-405) illuminates the DMD, which is 62 cm away. The laser has variable output from 3 to 100 mW. The reflected laser light from the DMD has a 2D diffraction pattern. An aperture blocks all but the central order spot since the higher order spots diverge enough to be clipped by the 1 inch diameter optics before reaching the cathode. The central order spot has 16% of the power incident on the DMD. The transmittance/reflectance of the optical elements are shown in Table I. The light reflected from the DMD is simultaneously imaged onto the photocathode and onto a frame-transfer CCD camera. The SBIG ST-402ME model camera is fan-cooled and has a 765 � 510 array of 9 �m pixels. A two lens relay system focuses light on the cathode. Lens 1 (200 mm focal length) is located 107 cm from the DMD. Lens 2 (300 mm focal length) is located 65 cm away from Lens 1. Both the cathode and the CCD camera are 84 cm away from Lens 2. The Melles Griot biconvex UV
FIG. 2. A schematic of the experimental setup. The DMD selectively reflects a small cross section of the incident laser beam through the rest of the optical components to the cathode. The camera and cathode are the same distance from the pellicle, which allows us to deliver 96% of the laser beam’s power to the cathode and image 4% with the camera. The scale is for the placement, not the size, of optical elements.
fused silica lenses have an antireflective coating for 355– 532 nm light. An individual micromirror or a micromirror group can be selected to reflect a portion of the laser beam through the remaining optics. During alignment, the DMD is set to reflect a checkerboard pattern. Lens 1 is adjusted until the pattern on the cathode is in focus when seen through the imaging viewport. A pellicle beam splitter reflects 4% of the beam power to the CCD. With the CCD and cathode equidistant from the beam splitter, the CCD position is adjusted to find the sharpest focus. Neutral density filters (total of optical density 3) are used to avoid saturating the camera. The incident optical power is determined for each QE measurement. The reflection from a single illuminated DMD pixel is detectable with the CCD camera but falls below the threshold of our thermopile (0.1 mW). Thus it is necessary to use the CCD to measure lower power levels; this additionally allows higher-speed laser power profiling. The CCD has a pixel response variation of less than 0.3%. The integrated CCD count is correlated with laser power by capturing the entire laser spot with the CCD while varying the laser power. Performing a linear fit calibrates the CCD single-pixel response so that integration of acquired images reveals the optical power incident on the cathode. TABLE I. Transmittance and reflectance. Optical element DMD (central order reflection) Mirror 1 Lenses 1 and 2 (per lens) Beam splitter (to cathode) Mirrors 2 and 3 (per mirror) Quartz window Total
062802-2
Transmit./Reflect. (%) 16 89 96 96 83 93 8.1
PHOTOCATHODE QUANTUM EFFICIENCY MAPPING AT . . . The photocurrent is observed to vary linearly with laser power. This means that our measurements are not space charge limited. Since QE is proportional to current divided by power, variations in power from different DMD pixels have no effect on QE. Photocurrent is measured using a Keithley Model 486 picoammeter in series with the 6 mm diameter cathode and an anode 1.6 mm away from the cathode. A bias of 160 V is applied between cathode and anode using a simple series of 9 V batteries. This isolated voltage supply, as well as triaxial cable, minimizes noise. The low noise is necessary to permit measurement of the average 80 pA photocurrents generated when using single DMD pixels. III. RESULTS QE maps are made with different step sizes by programming groups of DMD pixels to switch together. Maps using DMD pixel groups of 9 � 9, 3 � 3, and 1 � 1 correspond to step sizes of 148, 49, and 16 �m, respectively. The 16 �m step size map covers only a subset of the larger step size maps for faster acquisition time. As shown in Fig. 3, the 16 and 49 �m step size maps are subaveraged to allow direct comparison to the 49 and 148 �m maps, respectively. The average QE, as measured using a single 27 � 27 group of DMD pixels, is comparable: ð0:052 � 0:001Þ% for the 148 and 49 �m step size maps. The average QEs of the 16 �m step size map agree with the corresponding QEs of the 49 �m step size map to within 0.002% QE. These spatial fluctuations are attributed to the polycrystalline porous tungsten surface of the cesium dispenser cathode under test.
FIG. 3. QE maps. Maps in the right column are magnified by 3:1 compared to their corresponding areas in the left column. The second row shows average maps of the first row, which can be compared to the measured maps of the third row. The first row uses 49 �m step sizes on the left and 16 �m step sizes on the right. The second and third rows use 148 �m step sizes on the left and 49 �m step sizes on the right.
Phys. Rev. ST Accel. Beams 16, 062802 (2013)
FIG. 4. The peaks from two neighboring DMD mirrors are 16 �m apart. Since the measurements are not space charge limited, the difference in power from the two mirrors has no effect on measured QE.
The point spread function of the optical relay system is obtained by imaging a single micromirror with the laser. The horizontal and vertical profiles are fit to Gaussians, with each having a 47 �m FWHM. We measure a step size of 16 �m by individually imaging neighboring DMD mirrors (Fig. 4). This step size is consistent with the pitch of the DMD mirrors, and the 1.2 magnification from the DMD to the cathode. IV. CONCLUSION QE maps are characterized by step size, spot size, and ease of generation. PEEM offers the smallest distance between adjacent points on a QE map but requires the cathode to be removed from a photoinjector. Laser raster scanning can be done in place but only permits measurements with a single laser spot size barring significant optical realignment. We have demonstrated that a DMD can be used for variable step size QE mapping, which allows for a quick large step size (150 �m) map of the entire photocathode surface followed by a small step size (16 �m) map of the smaller region to be illuminated for photoinjection. A larger field of view is possible if sufficient power is transmitted to the cathode when the laser beam is expanded to fill the DMD. Power to the cathode could be increased by redesigning the system so as to accept higher order diffraction spots reflected from the DMD. A chopper and lock-in amplifier were tested, and could be used to detect smaller photocurrents. Power measurements are currently not a concern, since the CCD can easily detect per-pixel laser power 3 orders of magnitude less than reported here. DMD mirror switching, laser power, and photocurrent measurements will need to be automated to accommodate the increased number of data points for small step size, large field of view maps. Presently, commercially available DMDs are not optimized for use below 320 nm. However, with the advent of
062802-3
B. C. RIDDICK et al.
Phys. Rev. ST Accel. Beams 16, 062802 (2013)
new advances in DMD fabrication and/or the use of windows that are transmissive down to 266 nm, DMDs may soon be available for measuring QE in the deep UV with small step size [15]. Such a capability would allow a direct application of the technique presented here to cathode materials such as copper. The DMD permits the generation of a QE map with a step size of 16 �m and a spot size of 47 �m, which betters the lowest reported by laser rastering. The DMD allows rapid in situ QE mapping without the need to move the drive laser or any other optical components. QE map step size and laser spot size can be easily adjusted. This is a promising method for probing the spatial electron emission characteristics of photocathodes. ACKNOWLEDGMENTS We thank D. W. Feldman for useful discussions, and we thank the Office of Naval Research (Grant No. N000140911190) and the Joint Technology Office (Grant No. N000140711043) for financial support.
[1] N. R. C. Committee on a Scientific Assessment of FreeElectron Laser Technology for Naval Applications, Scientific Assessment of High-Power Free-Electron Laser Technology (National Academies Press, Washington, DC, 2009). [2] K. L. Jensen, J. E. Yater, J. L. Shaw, R. E. Myers, B. B. Pate, J. E. Butler, and T. Feygelson, J. Appl. Phys. 108, 044509 (2010). [3] A. Scholl, Curr. Opin. Solid State Mater. Sci. 7, 59 (2003).
[4] P. U. P. A. Gilbert, A. Young, and S. N. Coppersmith, Proc. Natl. Acad. Sci. U.S.A. 108, 11350 (2011). [5] J. Gubeli, R. Evans, A. Grippo, K. Jordan, M. Shinn, and T. Siggins, Nucl. Instrum. Methods Phys. Res., Sect. A 475, 554 (2001). [6] P. Corlett and J. Rogers, in Proceedings of EPAC, 2006 (European Physical Society, Mulhouse, France, 2006). [7] D. Sertore, P. Michelato, L. Monaco, and C. Pagani, in Proceedings of the 22nd Particle Accelerator Conference, Albuquerque, New Mexico, 2007 (IEEE, New York, 2007), pp. 2760–2762. [8] L. Cultrera, I. Bazarov, A. Bartnik, B. Dunham, S. Karkare, R. Merluzzi, and M. Nichols, Appl. Phys. Lett. 99, 152110 (2011). [9] F. Zhou, A. Brachmann, F.-J. Decker, P. Emma, S. Gilevich, R. Iverson, P. Stefan, and J. Turner, Phys. Rev. ST Accel. Beams 15, 090703 (2012). [10] The idea to use a DMD to map the QE of a photocathode was first demonstrated at Brookhaven in 2006 [11], albeit with large spot sizes (where each point in the QE map was illuminated by a block of 64 � 64 DMD micromirrors instead of the single micromirrors used here), but to the authors’ knowledge has never been reported in the literature or conference proceedings. We independently conceived the idea to use a DMD for QE mapping. [11] S. Roychowdhury, Ph.D. thesis, Duke University, 2006. [12] R. Ives, L. Falce, S. Schwartzkopf, and R. Witherspoon, IEEE Trans. Electron Devices 52, 2800 (2005). [13] E. J. Montgomery, Z. Pan, B. C. Riddick, P. G. O’Shea, D. W. Feldman, K. L. Jensen, R. L. Ives, and L. R. Falce, AIP Conf. Proc. 1507, 933 (2013). [14] H. D. Zhang, R. B. Fiorito, A. G. Shkvarunets, R. A. Kishek, and C. P. Welsch, Phys. Rev. ST Accel. Beams 15, 072803 (2012). [15] J. T. Fong, T. W. Winter, and S. J. Jacobs, Proc. SPIE Int. Soc. Opt. Eng. 7637, 763718 (2010).
062802-4