Nov 15, 2007 - XXX, 2008. J. Lewis, R. Argyle, P. Bunclarck, D. Evans, and E. Gonzales-Solares, eds. Photometric Redshift Estimation on SDSS Data Using.
Astronomical Data Analysis Software and Systems XVII ASP Conference Series, Vol. XXX, 2008 J. Lewis, R. Argyle, P. Bunclarck, D. Evans, and E. Gonzales-Solares, eds.
P5.10
Photometric Redshift Estimation on SDSS Data Using Random Forests
arXiv:0711.2477v1 [astro-ph] 15 Nov 2007
Samuel Carliles1 , Tam´ as Budav´ari2 , Sebastien Heinis2 , Carey Priebe3 , 2 Alexander Szalay Abstract. Given multiband photometric data from the SDSS DR6, we estimate galaxy redshifts. We employ a Random Forest trained on color features and spectroscopic redshifts from 80,000 randomly chosen primary galaxies yielding a mapping from color to redshift such that the difference between the estimate and the spectroscopic redshift is small. Our methodology results in tight RMS scatter in the estimates limited by photometric errors. Additionally, this approach yields an error distribution that is nearly Gaussian with parameter estimates giving reliable confidence intervals unique to each galaxy photometric redshift.
1.
The Problem
We are given five bands of photometric data from the Sloan Digital Sky Survey Data Release 6 (SDSS DR6)1 . Associated with each magnitude measurement is an error measurement and an extinction measurement used to correct the effect of Galactic dust. For some objects we have spectroscopic redshifts, hereon denoted zspec for a particular object. We wish to estimate photometric redshifts for non-spectroscopic objects which are represented by the spectroscopic sample. We are currently interested only in galaxies with 10−4 ≤ zspec ≤ 1, and we exclude other objects which are likely to ”contaminate” our sample. We further choose for the moment not to consider Luminous Red Galaxies (LRGs), leaving us with some 400, 000 objects with which to train and test. In our current work we use magnitudes available in the new Ubercal table (Padmanabhan 2007) for each object. We subtract sequential extinction-corrected magnitudes to get color features, named u, g, r, and i. For instance, our color u is actually the magnitude difference u − g and so on. 2.
Our Proposed Solution
Given photometric colors and spectroscopic redshifts (uj , gj , rj , ij , zspecj ) ∈ R5 , j ∈ {1, 2, . . . , nspec} where nspec is the number of objects for which we have spectroscopic redshifts, and assuming the existence of a function f : R4 → R 1
Dept. of Computer Science, Johns Hopkins University, Baltimore, MD, USA
2
Dept. of Physics and Astronomy, Johns Hopkins University, Baltimore, MD, USA
3
Dept. of Applied Mathematics and Statistics, Johns Hopkins University, Baltimore, MD, USA
1
http://www.sdss.org/dr6/
1
2
Carliles, Budav´ari, Heinis, Priebe, and Szalay
mapping tuples (uj , gj , rj , ij ) to unique zspecj values, estimating f becomes a regression problem, and we can choose from among any number of common methods of regression. We choose Random Forest regression. Random Forests (Breiman 2001) are ensembles of Classification and Regression Trees (Breiman 1984) trained on bootstrap samples (Efron 1994). A random forest is composed of one or more regression trees. Trees are grown mostly “the normal way”, at each node making a binary partition at the “best” point along the “best” axis. In random forests, however, rather than choosing the best axis at each node from the input space, it is chosen from a random subspace of the input space (Ho 1998). Nodes are split until a user-specified minimum number of inputs (commonly five) is reached in a node and that node is declared terminal, its value being defined as the mean of the values of its constituent inputs in the regression case. After a tree is grown, a new input is classified left or right starting at the root of the tree, moving down until it reaches its associated terminal node, and that node’s value becomes the tree estimate for that input. The ensemble regression estimate for that input is then generally taken to be the mean of the corresponding regression tree estimates. Our Procedure is to select a training set of 80, 000 objects uniformly at random and without replacement from our full sample. With this we train a random forest of 600 trees yielding for each redshift to be estimated a set of individual tree estimates, called zˆtreei , i ∈ {1, 2, . . . , 600}. We have several options for aggregating these into a single forest estimate, and we choose a trimmed mean computed as follows. For a given test input we compute zˆmean ≡ zˆtree and the RMS estimated tree error (called σ ˆmean ) around zˆmean over the zˆtreei , then compute the mean over those zˆtreei which are within 2ˆ σmean of zˆmean , giving zˆtrim , which is our final redshift estimate for that input. Our primary measure of accuracy is then the RMS of zˆtrim − zspec over all inputs. Our Error Model falls out of the ensemble nature of random forests. In the following we use the untrimmed mean for notational simplicity, but the case with the trimmed mean differs only trivially. First define the regression tree errors for a given input as ǫtreei ≡ zˆtreei − zspec , i ∈ {1, 2, . . . , B}, B equal the number of trees in the forest (600 in our case). Then define the random forest regression error as ǫmean ≡ zˆmean − zspec , and it’s trivial to show that ǫmean = ǫtree . One can view the tree errors as instances of identically distributed random variables. Assuming independence between trees (or at least a way to correct for dependence), one can model the tree errors as random variables iid
εtreei ∼ F(µ, σ), i ∈ {1, 2, . . . , B}, with F some unknown distribution with parameters µ and σ unique to each input. Then the mean of these random variables is itself a random variable, call it εmean , and the Central Limit Theorem √ gives us that εmean ∼ N (µ, σ/ B), thus we have a distribution for the random forest regression error for that input and we have convenient plugin estimates for its parameters. We then can further say that εmean − µ √ ∼ N (0, 1). σ/ B
(1)
In practice we won’t have zspec for most objects, however we do find that our estimation error is zero mean (or, rather, insignificantly non-zero mean), so the best easy estimate we have for µ is zero. If, for a given input, we knew some
0.095
100
0.055
50
0.015 0.015
0 0.095 zspec
0.175
0.02
150
0.00
200
0.135
−0.02
250
0.175 zRF
0.215
Binned mean ∆z
Photometric Redshift Estimation on SDSS Data Using Random Forests
0.05
0.10
0.15
0.20
zRF
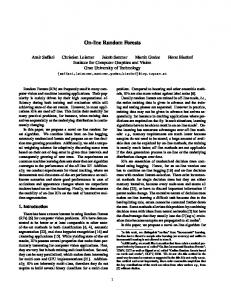
Figure 1. a. (left) Photometric vs. spectroscopic redshift for 10,000 test objects. b. (right) Mean error for 10,000 test objects in eight bins vs. photometric redshift with bars marking region containing 34% of errors on either side of mean.
better value for µ, it would mean our forest didn’t utilize some information, and Figure 1b shows this not to be the case. Our estimate tells us nothing about whether we over- or under-estimated the actual value; either outcome is equally likely conditioned on our redshift estimate. But we do get bias as a function of zspec , and correcting this bias is a problem to be dealt with in future work.
3.
Our Results
We select 10, 000 test objects uniformly at random from our held-out data (our main sample minus our training set) and use our forest to produce redshift and error distribution parameter estimates for each test object. The resulting RMS error between trimmed means and corresponding zspec over these objects is 0.023. Figure 1a characterizes our estimates, which are generally good with some slight bias visible near the origin due to the local skewness of the underlying redshift distribution. Figure 1b shows the binned mean difference between zRF and zspec as a function of zRF (where zRF ≡ zˆtrim for each test input), and it indicates that our random forest extracted nearly all the information contained in the training data. Equation 1 above gives us a simple way to test our error distribution parameter estimates. For each test input we set zRF = zˆtrim , ǫmean = zRF −zspec (pardon the flagrant abuse of notation), µ = 0, σ = [ǫ2tree ]1/2 , and B = 600. The results over all test inputs should be distributed as iid standard normal random variables. However, in our tests, it turns out that setting B = 600, the number of trees in our forest and the number of ostensibly iid tree error estimates for each test input, yields a vertical spike after standardizing. In fact we discover empirically that in our case setting B = 1 yields almost a perfect Standard Normal over all test inputs as shown in Figure 2a. We interpret this to mean that we have strong dependence between tree error estimates, and correcting for this algorithmically will be another subject of future work. Moving on for now with the parameter estimates resulting from our hand-chosen value of B = 1, we next seek to verify that for given confidence levels α, we have the expected number of errors between the corresponding level-α critical values over all test
3
4
−4
−2
0 x
2
4
100 90 80 70 60
0.2 0.0
0.1
f(x)
0.3
f(x) = φ(x) f(x) = freq(x)
% standardized error in acceptance region
0.4
Carliles, Budav´ari, Heinis, Priebe, and Szalay
0.6
0.7
0.8
0.9
1.0
1−α
Figure 2. a. (left) Observed standardized error for 10,000 test objects binned (circles) and Standard Normal distribution (curve). b. (right) Percent observed standardized error within level-α critical values for 10,000 test objects vs. 1 − α (circles) and percent error expected within level-α critical values vs. 1 − α (line).
inputs, and the quantile-quantile plot shown in Figure 2b is pleasing in that regard. Thus we have good reason to believe in our error distribution parameter estimates. 4.
Conclusion
Our RMS error is consistent with results from previous studies using similar datasets, though slightly lower RMS errors from different methodologies have been reported. We may yet gain by expanding our training data set as we have more than 300, 000 training objects in reserve and the computational complexity of random forests is quite modest (in preliminary testing we trained multiple forests with multiple training sets on a Core 2 Duo 2.0GHz MacBook in less than one week; regression on all of our held-out data took several days using the same machine). Future work will include better accounting for dependence between trees, investigating more deeply the behavior of our error distributions as a function of zspec , addressing zspec -dependent bias, and extending estimation to objects not represented by the training data. As it is, the quality of the estimates, the per-object error distributions, and the computational efficiency make this approach an attractive option for photometric redshift estimation. References Breiman, L., Friedman, J.H., Olshen, R.A., & Stone, C.J. 1984, Classification and Regression Trees. (Wadsworth) Breiman, L. 2001. ”Random Forests”. Machine Learning, 45 (1), 5 Efron, B., & Tibshirani, R. 1994, An Introduction to the Bootstrap. (Chapman & Hall) Ho, T.K. 1998. ”The Random Subspace Method for Constructing Decision Forests”. IEEE Trans. on Pattern Analysis and Machine Intelligence, 20 (8), 832 Padmanabhan, N., et. al. 2007. ”An Improved Photometric Calibration of the Sloan Digital Sky Survey Imaging Data”. astro-ph/0703454.