Theor Appl Genet (2000) 101:554–563
© Springer-Verlag 2000
O R I G I N A L A RT I C L E I.V. Bartish · L.P. Garkava · K. Rumpunen H. Nybom
Phylogenetic relationships and differentiation among and within populations of Chaenomeles Lindl. (Rosaceae) estimated with RAPDs and isozymes
Received: 23 December 1999 / Accepted: 17 January 2000
Abstract RAPD and isozyme analyses based on numerous markers have been used for the first time to investigate patterns of phenetic and genetic differentiation among and within nine wild populations of the genus Chaenomeles represented by the species C. japonica, C. speciosa, C. cathayensis and C. thibetica. Highly significant correlations were found between the two different marker systems for both phenetic distances and gene diversity estimates. In agreement with previous studies on cultivated Chaenomeles material, C. japonica was clearly differentiated from C. speciosa and C. cathayensis. The recently recognised species C. thibetica appeared to be rather closely related to C. cathayensis. Populations of C. japonica and C. speciosa were considerably more diverse than populations of C. cathayensis and C. thibetica. Correspondingly, most of the total variability could be attributed to the within-population differentiation in the case of C. japonica and C. speciosa, and to the between-population differentiation in the case of C. cathayensis. Differences in mating systems among the species can be suggested as a possible explanation of the results. A discordant pattern was found between RAPDs and isozymes in the analyses of population structure within C. japonica. This may be explained by a higher proportion of non-neutral markers for isozymes than for RAPDs. This finding also shows the importance of using multiple molecular marker systems in studies of population structure. Key words Gene diversity · Isozyme · Non-neutrality · RAPD · Rosaceae
Communicated by P.M.A. Tigerstedt I.V. Bartish · L.P. Garkava · K. Rumpunen (✉) · H. Nybom Balsgård–Department of Horticultural Plant Breeding, Swedish University of Agricultural Sciences, Fjälkestadsvägen 123-1, S-291 94 Kristianstad, Sweden e-mail:
[email protected] Fax: +46 44 755 30
Introduction Chaenomeles is a genus within the subfamily Maloideae comprising four diploid (2n=34) species (Phipps et al. 1990). One species is endemic to Japan, and three originate in central Asia. Presently they are being investigated for possible domestication and improvement through breeding in northern Europe. The plants within the genus Chaenomeles are all moderate-sized shrubs adaptable to cultivation in temperate areas. C. japonica (Thunb.) Lindl. ex Spach (Japanese quince) is outcrossing and strongly self-incompatible (Rumpunen et al. 1999). The mating system has not yet been properly investigated for the other species in the genus. C. speciosa (Sweet) Nakai (flowering quince) is a traditional medicinal plant (Anonymous 1989) and grows in Central and southern China, Tibet and Burma. Recently it has also become cultivated in eastern China (Wang et al. 1998). In the province of Yunnan, C. speciosa grows sympatrically with C. cathayensis (Hemsl.) Schneider (Chinese quince), the largest shrub in the genus, which can also be found in Bhutan and Burma. The fourth species, C. thibetica Yü (Tibetan quince), first described in 1963 (Yü and Kuan) and included in the most recent check list of the subfamily Maloideae (Phipps et al. 1990), grows in Tibet and western Sichuan. C. japonica, C. cathayensis and C. speciosa have been used to create several interspecific hybrids for 400 years, resulting in more than 500 cultivars (Weber 1963), which today are widely appreciated as ornamentals. Efficient methods to clarify the taxonomic status of both the wild and the cultivated material are much needed. Insights into the relative gene diversity among and within wild populations of Chaenomeles would be useful in plant breeding and also for the development of strategies for ex situ conservation of plant genetic resources. Molecular markers [random amplified polymorphic DNAs (RAPDs) and isozymes] have recently been used to evaluate gene diversity in plant samples of three species of Chaenomeles: C. cathayensis, C. japonica and C. speciosa. The accessions were obtained from several botanical gardens, and included samples of domesticated
555 Table 1 Accession identity (ID), number of individuals and origin of the nine Chaenomeles populations investigated
a Precise b Estimated
ID
Individuals
Species
Origin (co-ordinatesa,b and altitude)
P9701
21
C. japonica
P9702
19
C. japonica
P9724
21
C. japonica
P9801
19
C. speciosa
P9802
21
C. speciosa
P9803
21
C. cathayensis
P9804
21
C. cathayensis
P9805
21
C. speciosa
P9806
21
C. thibetica
Shionomuro, Imaichi, Tochigi, Japan (36°45’N, 139°48’Ea; 275 m) Noguchi, Nikko, Tochigi, Japan (36°45’N, 139°43’Ea; 450 m) Ibuki, Shiga, Japan (35°15’N, 136°20’Eb; 900 m) Zhenyuan, Yunnan, China (23°50’N, 101°10’Eb; 1800–2300 m) Hutiaoxia, Zhongdian, Yunnan, China (27°50’N, 99°30’Eb; 1800–2100 m) Hutiaoxia, Zhongdian, Yunnan, China (27°50’N, 99°30’Eb; 1800–2100 m) Caojian, Yunlong, Yunnan, China (25°35’N, 98°05’Eb , 2500–2600 m) Dali, Yunnan, China (25°35’N, 100°10’Eb; 1900–2400 m) Yi’ong, Bomi, Tibet (30°00’N, 95°00’Eb; 2500 m)
populations (Bartish et al. 1999b, Garkava et al. 2000). Both marker systems appeared to be useful in the discrimination of accessions. Cluster and multidimensional scaling analyses yielded similar results for the two molecular marker methods (Garkava et al. 2000). The two methods also showed a concordant pattern of relative diversity within species. C. japonica and C. speciosa were found to be considerably more diverse than C. cathayensis. However, because of possible interspecific hybridisation among accessions from botanical gardens, it was not clear to what extent the obtained results would be representative for indigenous populations of Chaenomeles. Isozymes and RAPDs are among the most frequently used molecular markers for taxonomic and systematic analyses of plants. Correspondence between results with nuclear DNA and isozyme markers using cluster and ordination analyses of the same plant sample is generally moderate (Heun et al. 1994), but highly correlated estimates of genetic distances have been reported between RAPD and isozyme datasets (Lifante and Aguinagalde 1996). Some authors have considered RAPD-based analysis to be more definitive in its separation of clusters than isozyme-based analysis (Heun et al. 1994), mostly because RAPDs yield lower coefficients of variation than isozymes and thus allow for a higher level of discrimination (Staub et al. 1997). A different view was expressed by Chan and Sun (1997), who suggested that the reliability of RAPD and isozyme data is comparable at the intraspecific level but that at the interspecific level RAPD markers are less suitable for studying phylogenetic relationships than both isozyme and restriction fragment length polymorphism (RFLP) markers. When population structure is being investigated, different molecular marker systems and the interpretation of the scored fingerprints as phenetic or genetic data may produce different results. Gene diversity estimates obtained from RAPDs may be higher than those obtained from isozymes (Aagaard et al. 1998) because ”an inherently higher rate of detectable mutations and weaker degree of selective constraint at RAPD compared to
allozyme loci”. Furthermore, estimates of among-population differentiation could be inflated when based on RAPD phenotypes compared to RAPD and isozyme genotypes (Isabel et al. 1999). Several studies have also questioned the neutrality of isozyme loci, suggesting that both balancing (Karl and Avise 1992; Raybould et al. 1996) and diversifying (Berry and Kreitman 1993; Lönn 1993; Le Corre et al. 1997) selection may operate on some of the enzymes. The simultaneous application of both techniques thus seems to be a more reliable approach when estimating population parameters and phylogenetic relationships, as indeed has been advocated by, for example, Chan and Sun (1997) and Ayres and Ryan (1999). The purpose of our investigation was: (1) to determine population structure and gene diversity for species and populations within Chaenomeles, and (2) to investigate the correspondence between RAPD- and isozyme-based datasets in analyses of phylogenetic relationships, population structure and relative gene diversity estimates.
Materials and methods Plant material All of the accessions were collected in the wild in China and Japan during the autumn of 1997, except for P9801, P9802 and P9803, which were purchased from local markets (the fruits had been collected in the nearby mountains). Only one fruit, with numerous seeds, was picked from each shrub. The seeds from one fruit were presumed to constitute a family. Following cold stratification, the seeds were germinated in a greenhouse. When the seedlings were 3 months old, 7 plants from each of three randomly selected families per population were sampled for molecular analyses. However, one of the populations (P9724), was represented by only one family (of 21 seedlings to achieve a more balanced plant sampling). Altogether, 189 plants representing nine populations of C. japonica, C. speciosa, C. cathayensis and C. thibetica were initially sampled (Table 1). One-year old plants were used for isozyme extractions. Since 4 plants died before being sampled for isozyme analysis (1 plant per family in two families of population P9702 and in two families of population P9801), the total number of plants used in both analyses was 185.
556 Isozyme analysis Enzymes were extracted from leaflets and phloem tissue, and polyacrylamide gel electrophoresis was carried out as previously described (Garkava et al. 2000). The enzyme assay procedures for acid phosphatase (ACP, EC 3.1.3.2), and esterases (EST, EC 3.1.1.-) were as described by Wendel and Weeden (1989). Glutamate oxaloacetate transaminase (GOT, EC 2.6.1.1), shikimate dehydrogenase (SKDH, EC 1.1.1.25), and phosphoglucomutase (PGM, EC 5.4.2.2) were stained according to Vallejos (1983). Peroxidase (PRX, EC 1.11.1.7) was stained with 0.09% benzidine in 0.32 M sodium acetate buffer adjusted to pH 5.4, and bands were revealed with 0.01% hydrogen peroxide. All isozyme systems were stained in the dark at 37°–38°C. Bands were scored visually as presence and absence of a marker. DNA extraction and polymerase chain reaction (PCR) amplification Young unexpanded leaves (5–15 mg per individual) were collected, placed into an Eppendorf tube (1.5 ml) and stored at –80°C. Leaves were ground with a minipestle to a homogenate in 200–250 µl of 2×CTAB extraction buffer and incubated for 45 min at 65°C. From this point on all procedures for DNA extraction and PCR amplification followed the previously described method of Bartish et al. (1999b). The only exception was the use of a different thermocycler, PTC–100 TM (MJ Research). Ten primers were selected out of 100 (Operon Technologies sets A, B, D, E, F) that had been tested previously (Bartish et al. 1999b). The main criterion for selection was reproducibility of amplification. However, some bias in the direction of higher polymorphism among RAPD markers generated by the primers used in the present study (compared to random sampling of primers) cannot be excluded. Products of amplification from DNA samples of families from different populations were run on the same gel. In all cases, except population P9803, separate families from the same population were analysed on separate gels. For each primer, three samples of each population were replicated in different PCR experiments and analysed on separate gels. Products of PCR amplification were scored visually as presence or absence of a marker. Bands of identical size, amplified with the same primer, were considered to be homologous. Bands, which were very faint and rare (frequency less than 3%), were not included into the analysis. Data analysis Binary data matrices were produced from the scored isozyme and RAPD markers for individual plants. Phenotype frequencies of molecular markers within families of C. japonica and within the total sample of populations and species were calculated and used to create datasets of marker frequencies. The datasets were used to compute phenetic (Euclidean) distances among populations (or families in the case of C. japonica) according to the method of Harrison et al. (1997) and Hancock and Bringhurst (1979) for RAPD-based and isozyme-based data, respectively. This approach allows evaluation of phylogenetic relationships between populations when precise genetic data for molecular markers are absent. In addition, a RAPD-based dataset of null allele frequencies within populations was produced for the whole material. The markers were considered to represent separate loci. Null allele frequencies were calculated for these markers in accordance with Lynch and Milligan (1994) and Bartish et al. (1999a). The dataset of RAPD null allele frequencies for populations was then used to compute Nei’s genetic distances (Nei 1972) among populations. All datasets were analysed with NTSYS-pc software (version 1.8, Rohlf 1997). The SAHN programme from this package was used to produce UPGMA dendrograms from each of two phenetic distance matrices and one genetic distance matrix to show the amount of relatedness among populations and species. Principal
co-ordinate analysis (DCENTER and EIGENVECTOR programmes) was run for each of the two matrices of phenetic distances among populations, and for two more matrices of phenetic distances among families within C. japonica. We used this analysis to obtain additional information about interpopulation relations, which was revealed by different methods. For graphical representation of principal co-ordinate analyses, two-dimensional plots for families and three-dimensional plots for populations were produced by NTSYS. We used the matrix of null allele frequencies within populations from the RAPD dataset for cluster analysis in PHYLIP 3.573c software (Felsenstein 1993). The matrix was bootstrapped to produce 100 random matrices, and Nei’s genetic distances (1972) were calculated by GENDIST from PHYLIP for each of the 100 bootstraps. These matrices were subjected to cluster analysis in the NEIGHBOR programme from PHYLIP with the neighbour-joining algorithm. A strict consensus tree, summarising the relationships described by all 100 resampled datasets (with bootstrap support for each node), was finally produced. Two of the most frequently used approaches in RAPD analysis were employed to evaluate gene diversities on both RAPD and isozyme datasets: estimates of unbiased values of expected heterozygosity, as in Lynch and Milligan (1994), and Shannon’s index, as in Bussell (1999). Monomorphic markers were included into the Shannon’s index calculations as suggested by Bussell (1999), in order to standardise values and enable comparisons between studies in which a different number of markers were recorded. We used the modified standardisation procedure suggested by Liu and Furnier (1993) because the diversity of the total plant sample may have a substantial influence on within-population diversity estimations (Bartish et al. 1999c). Since portions of the genome that are monomorphic for the recessive allele cannot be observed, doubling the number of markers monomorphic for the dominant allele (presence of a band) should yield a good estimate of the number of monomorphic markers and hopefully improve the total estimate of within-species polymorphism. We calculated the total number of monomorphic and polymorphic molecular markers separately for each species; thus, the combined number of markers included into all gene diversity estimates was different for each of the species. The Lynch and Milligan index was calculated for each RAPD marker, i, separately for each population, Hpop(i), species, Hsp(i), and the genus, Hge(i). The mean Lynch and Milligan index for a population, Hpop, was then calculated by averaging Hpop(i) over all markers. Hsp and Hge were calculated similarly. Shannon’s index was calculated for each RAPD or isozyme marker, i, separately for each population, H’pop(i), species, H’sp(i), and the genus, H’ge(i). The average Shannon’s index for a population H’pop was then calculated by averaging H’pop(i) over all markers as in Monaghan and Halloran (1996). H’sp and H’ge were calculated similarly. The mean Shannon’s index was then calculated for ¯ ’sp(i), by averaging H’pop(i) over all each marker within a species, H populations within each species (3 populations for C. japonica and ¯ ’ge/sp (i) C. speciosa, 2 populations for C. cathayensis) . Similarly H ¯ ’ge/pop(i) was calculated by averaging H’sp(i) over all species, and H by averaging H’pop(i) over all populations within the genus. We calculated the components of diversity between groups for different levels of taxonomic hierarchy analogous to Bussel (1999). For each locus the component of diversity between popu¯ ’sp (i)]/H’sp(i), lations within species, G’pop/sp(i), was [H’sp(i)–H and the component between populations within the genus, ¯ ’ge/pop(i)]/H’ge(i). The component of diG’pop/ge(i), was [H’ge(i)–H versity between species within genus, G’sp/ge(i), was correspond¯ ’ge/sp(i)]/H’ge(i). Mean estimates of G’pop/sp, ingly [H’ge(i)–H G’pop/ge and G’sp/ge were calculated by averaging G’pop/sp(i), G’pop/ge(i) and G’sp/ge(i) over all markers. We then calculated 99% confidence intervals for G’pop/sp of each species to reveal markers that deviated significantly from the parametric mean of all markers. The same procedure was also applied to only two populations (P9701 and P9702) of C. japonica. Two matrices of phenetic distances among all individual plants (RAPD and isozyme datasets of polymorphic markers) were used as input distance matrices in AMOVA (Huff et al. 1993), and Φstatistics was calculated from the variance components. In this paper we only report the proportions of variance differentiating among populations within species (Φpop/sp), among populations
557
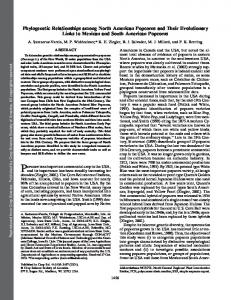
Fig. 2 Dendrogram of phylogenetic relationships between populations of Chaenomeles calculated on RAPD null allele frequencies by the neighbour-joining method with bootstrap support (%) for each node of the tree
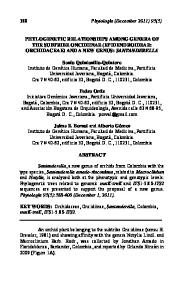
Fig. 1a–c UPGMA dendrograms of RAPD-based (Euclidean distances) (a), isozyme-based (Euclidean distances) (b) and RAPD-based (c) Nei’s genetic distances between populations of Chaenomeles within the genus (Φpop/ge) and among species within genus (Φsp/ge), which correspond to the G’-statistics. We used Pearson product-moment correlation analysis and the standard t-test (paired comparisons), respectively, to evaluate associations between estimates of within-population gene diversity obtained with different molecular datasets. This analysis was also used to estimate associations between some of the molecular markers. The product-moment correlation and the Mantel test statistic were computed with NTSYS (MXCOMP programme) to measure the degree of relationship between the distance matrices.
Results Phenetic relationships among populations For the total plant sample, 271 (including 17 monomorphic) RAPD and 103 (9 monomorphic) isozyme markers were scored. Phenetic (Euclidean) distances between populations varied in the range 2.87–10.07 for RAPD and 1.84–5.77 for isozyme datasets, respectively. Genetic (Nei’s) distances based on RAPDs varied from 0.024 to 0.332. The complete matrices of phenetic and genetic distances for all datasets are available on request. All matrices were significantly (P