ORIGINAL RESEARCH published: 18 March 2015 doi: 10.3389/fmicb.2015.00214
Phylogenomics and systematics in Pseudomonas Margarita Gomila 1 † , Arantxa Peña 1 † , Magdalena Mulet 1 , Jorge Lalucat 1, 2 and Elena García-Valdés 1, 2* 1
Microbiology, Department of Biology, Universitat de les Illes Balears, Palma de Mallorca, Spain, 2 Institut Mediterrani d’Estudis Avançats (Consejo Superior de Investigaciones Científicas-Universidad de las Islas Baleares), Palma de Mallorca, Spain
Edited by: Frank T. Robb, University of Maryland, USA Reviewed by: Edward R. B. Moore, University of Gothenburg, Sweden Kostas Konstantinidis, Georgia Institute of Technology, USA *Correspondence: Elena García-Valdés, Department of Biology, Universitat de les Illes Balears, Crtra. Valldemossa km 7.5, 07122 Palma de Mallorca, Spain
[email protected] †
These authors have contributed equally to this work.
Specialty section: This article was submitted to Evolutionary and Genomic Microbiology, a section of the journal Frontiers in Microbiology Received: 03 December 2014 Accepted: 02 March 2015 Published: 18 March 2015 Citation: Gomila M, Peña A, Mulet M, Lalucat J and García-Valdés E (2015) Phylogenomics and systematics in Pseudomonas. Front. Microbiol. 6:214. doi: 10.3389/fmicb.2015.00214
The genus Pseudomonas currently contains 144 species, making it the genus of Gram-negative bacteria that contains the largest number of species. Currently, multilocus sequence analysis (MLSA) is the preferred method for establishing the phylogeny between species and genera. Four partial gene sequences of housekeeping genes (16S rRNA, gyrB, rpoB, and rpoD) were obtained from 112 complete or draft genomes of strains related to the genus Pseudomonas that were available in databases. These genes were analyzed together with the corresponding sequences of 133 Pseudomonas type strains of validly published species to assess their correct phylogenetic assignations. We confirmed that 30% of the sequenced genomes of non-type strains were not correctly assigned at the species level in the accepted taxonomy of the genus and that 20% of the strains were not identified at the species level. Most of these strains had been isolated and classified several years ago, and their taxonomic status has not been updated by modern techniques. MLSA was also compared with indices based on the analysis of whole-genome sequences that have been proposed for species delineation, such as tetranucleotide usage patterns (TETRA), average nucleotide identity (ANIm, based on MUMmer and ANIb, based on BLAST) and genome-to-genome distance (GGDC). TETRA was useful for discriminating Pseudomonas from other genera, whereas ANIb and GGDC clearly separated strains of different species. ANIb showed the strongest correlation with MLSA. The correct species classification is a prerequisite for most diversity and evolutionary studies. This work highlights the necessity for complete genomic sequences of type strains to build a phylogenomic taxonomy and that all new genome sequences submitted to databases should be correctly assigned to species to avoid taxonomic inconsistencies. Keywords: Pseudomonas, genomics, multilocus sequence analysis, taxonomy, systematics
Introduction The genus Pseudomonas is one of the most complex bacterial genera and is currently the genus of Gram-negative bacteria with the largest number of species; in fact, the number of species in the genus has increased every year (10 additional species in 2013 and six in 2014 through October). The current number of recognized and validly published species is 144, including 10 subspecies; these species are present in the List of Prokaryotic Names with Standing in Nomenclature (Parte, 2014).
Frontiers in Microbiology | www.frontiersin.org
1
March 2015 | Volume 6 | Article 214
Gomila et al.
Genomics in Pseudomonas systematics
Pseudomonas species will assist in validating the proposed methods of comparison. Next-generation sequencing (NGS) currently provides an exponentially increasing number of whole genome sequences of bacterial strains, and the sequences are used frequently for comparative analyses from which phylogenetic or evolutionary conclusions are drawn. The correct strain assignation to a known species, however, is essential for correct conclusions. Many of the Pseudomonas strains under study were isolated and classified several years ago, and their correct taxonomic position is frequently dubious with the current taxonomic tools. The need for a taxonomical revision of several strains defined as different species of the genus Pseudomonas was evident when the strains were analyzed with a MLSA using the combined genes atpD, carA, recA, and 16S rRNA (Hilario et al., 2004) or using gyrB, rpoD, and 16S rRNA (Yamamoto et al., 2000; Mulet et al., 2010). In fact, Mulet et al. (2013) performed a taxonomical revision of P. putida strains based on a MLSA with the combined genes 16S rRNA, gyrB, and rpoD. Their results demonstrated that strains assigned to biovar A of the species were located in the P. putida group although not all belonged to the species P. putida. Biovar B strains were scattered among six subgroups of the P. fluorescens group and also belonged within the P. putida group. Four partial gene sequences of housekeeping genes (16S rRNA, gyrB, rpoB, and rpoD) were obtained from 112 complete or draft genomes of strains related to the genus Pseudomonas that were available in databases until December 2012. These genes were analyzed together with the corresponding sequences of 133 Pseudomonas type strains of validly published species to assess their correct phylogenetic assignations. Because of the complex taxonomical relationships among species and pathovars in the P. syringae phylogenetic group, only six of the 63 available complete P. syringae genomes were considered. The P. syringae species complex has been studied at the intraspecies level in a recent publication with similar methodology (Marcelletti and Scortichini, 2014). The main objectives of the present study were: (i) to infer the phylogeny and taxonomic affiliation of the 112 whole genome sequenced strains in the existing taxonomy of the genus Pseudomonas; (ii) to compare MLSA with the genome-based methods for species delineation (TETRA, ANIb, ANIm, and GGDC); and (iii) to compare the genome-based methods against each other.
The taxonomy of the genus has evolved simultaneously with the available methodologies since its first description. The genus Pseudomonas was described by Migula in 1894 according to the morphological characteristics of its members (Migula, 1900). For many years, the genus comprised many species that were not always well-characterized until the work of Stanier et al. (1966) in which the physiological and biochemical properties clearly established the taxonomical basis for the identification of the species. In 1984, the genus was revised, and a subdivision of five groups was implemented based on the DNA–DNA hybridisation (DDH) and rRNA-DNA hybridisation results (Palleroni, 1984). Later, the five groups were recognized as being associated with the class Proteobacteria (De Vos and De Ley, 1983; De Vos et al., 1985, 1989; De Ley, 1992); the members of the genus Pseudomonas “sensu stricto” were shown to belong to rRNA-DNA group I in the subclass Gammaproteobacteria. Since then, several authors have reviewed the taxonomic status of the genus Pseudomonas (Moore et al., 1996; Anzai et al., 2000; Peix et al., 2009; Mulet et al., 2012a). The approved list of bacterial names (Skerman et al., 1980) included 96 Pseudomonas species; however, only 31 of those species are considered true species in the genus Pseudomonas in the accepted taxonomy. Although the 16S rRNA gene is the basic tool of the current bacterial classification system, it is known that closely related species of bacteria cannot be differentiated based on this gene. Therefore, over the past 10 years, other gene sequences have been used as phylogenetic molecular markers in taxonomic studies, such as atpD, gyrB, rpoB, recA, and rpoD (Yamamoto and Harayama, 1998; Hilario et al., 2004; Tayeb et al., 2005, 2008). Mulet and collaborators have demonstrated that the analysis of the sequences of four housekeeping genes (16S rRNA, gyrB, rpoB, and rpoD) in all known species of the genus clarified the phylogeny and greatly facilitated the identification of new strains (Mulet et al., 2012a; Sánchez et al., 2014). The multilocus sequence analysis (MLSA) approach based on the sequence analysis of the four housekeeping genes has proven reliable for species delineation and strain identification in Pseudomonas (Mulet et al., 2012b). Whole-genome sequences can provide valuable information on the evolutionary and taxonomic relationships in bacteriology. In 2005, Coenye et al. (2005) published an article entitled “Toward a prokaryotic genomic taxonomy” and presented an overview of available approaches to assess the taxonomic relationships between prokaryotic species based on complete genome sequences. These genomic methods are delineated to substitute the experimental DDH by providing the possibility of creating accumulative databases of whole genome sequences. The digital methods used in the genome comparisons for the species delineation in several bacterial genera have been recently discussed by Li et al. (2015) and Colston et al. (2014). The methods tested in the present study, applied to strains in the genus Pseudomonas, were: tetranucleotide usage patterns (TETRA; Teeling et al., 2004), average nucleotide identity (ANIm and ANIb; Goris et al., 2007), and genome-to-genome distance (GGDC; Meier-Kolthoff et al., 2013). Genome sequencing is expected to provide a relevant tool in bacterial taxonomy, and results obtained in the analysis of
Frontiers in Microbiology | www.frontiersin.org
Materials and Methods Data Collection and Genome Selection A total of 253 Pseudomonas strains were analyzed in this study, comprising 112 complete or draft genomes of the Pseudomonas strains available in the databases and 141 strains of validly published Pseudomonas species (Mulet et al., 2012a). Those 141 taxonomically well-characterized strains included 133 Pseudomonas type strains, two subspecies of Pseudomonas chlororaphis (P. chlororaphis subsp. aurantiaca and P. chlororaphis subsp. aureofaciens) and Pseudomonas pseudoalcaligenes, the later synonym of Pseudomonas oleovorans subsp. oleovorans (Saha et al., 2010). In addition to the type strains, four taxonomically well-characterized strains of the Pseudomonas stutzeri
2
March 2015 | Volume 6 | Article 214
Gomila et al.
Genomics in Pseudomonas systematics
genome in the pair (“the reference”) using the BLASTN algorithm (Altschul et al., 1997). The ANI between the query genome and the reference genome was calculated as the mean identity of all the BLASTN matches that showed more than 30% overall sequence identity over an alignable region of at least 70% of their length. The ANI was calculated based on the BLAST algorithm, ANIb (Altschul et al., 1997; Goris et al., 2007), and the MUMmer ultra-rapid aligning tool, ANIm (Kurtz et al., 2004). The recommended species cut-off was 95% for the ANIb and ANIm indices, and higher than 0.99 for the TETRA signature (Richter and Rosselló-Móra, 2009). The GGDC method functions based on the principle that two genomes are locally aligned using BLAST, which produces a set of high-scoring segment pairs (HSPs); the information in these HSPs is transformed to a single GGDC value using a specific distance formula that sets the species cutoff at 70% similarity. GGDC was calculated using the web service http://ggdc.dsmz.de (Meier-Kolthoff et al., 2013). GGDC 2.0 is an updated and enhanced version with improved DDH-prediction models and additional features such as confidence-interval estimation. The matrices obtained in our study for each parameter were used to generate a dendrogram using Permut Matrix software by applying an average linkage method (UPGMA hierarchical clustering) and Pearson’s distance correlation (Caraux and Pinloche, 2005). The dendrograms were constructed using the average value of the duplicate analyses for each strain to assess topology coherence.
phylogenetic group were also included: two strains of the species P. stutzeri (both members of the genomovar 1, ATCC 27951 and A15) and two strains of Pseudomonas balearica (LS401 and st101). “Pseudomonas alkylphenolia” JCM 16553 was also included although it has no standing in the nomenclature (Veeranagouda et al., 2011). The set of 112 genome sequences of Pseudomonas was retrieved from the Genbank database on 31st December of 2012. All complete and draft genomes not taxonomically identified as members of the P. syringae group were included in the analysis. Six genomes affiliated with the P. syringae group were also selected. Genomes that did not contain the full-length 16S rRNA, gyrB, rpoB, and rpoD genes sequences were removed from the dataset. The list of the 112 complete or draft genomes analyzed is shown in Supplementary Table 1.
Multilocus Sequence Analysis The sequences of the 16S rRNA, gyrB, rpoB, and rpoD genes were extracted from each complete genome studied and were compared with the corresponding sequences of all species type strains described until 2012. The 16S rRNA, gyrB, rpoB, and rpoD gene sequences of the type strains were retrieved from our previous publications (Mulet et al., 2010, 2012a) and are available in the public National Centre for Biotechnology Information (NCBI) database. A series of individual trees was generated from the 16S rRNA, gyrB, rpoB, and rpoD partial gene sequences. Concatenated gene trees were constructed using the individual alignments in the following order: 16S rRNA (1309 nt), gyrB (803 nt), rpoD (791 nt), and rpoB (923 nt). The alignments were conducted using a hierarchical method for multiple alignments implemented in the program CLUSTAL_X (Thompson et al., 1997). Automatically aligned sequences were checked manually. Similarities and evolutionary distances were calculated with programs implemented in PHYLIP (Phylogeny Inference Package, version 3.5c) (Felsenstein, 1981). Gene distances were calculated from nucleotide sequences using the Jukes-Cantor method (Jukes and Cantor, 1969), and dendrograms were generated using the neighbor-joining (NJ), minimum-evolution (ME), and maximum parsimony (MP) methods. A bootstrap analysis of 1000 replications was also performed. Values higher than 50% (from 1000) are indicated only at the groups or subgroups branching nodes of the corresponding trees. The topologies of the trees were visualized using the TreeView program (Page, 1996).
Species Delineation Based on MLSA and Genome Indices Thresholds Parametric correlations based on the Pearson’s product-moment coefficient and non-parametric correlations using the Spearman’s rank correlation coefficient and Kendall tau rank correlation coefficient were calculated between all the whole-genome comparison results and the concatenated phylogenetic MLSA. Correlation analysis were performed using SPSS Plot v.11.0 software. Representations between the whole-genome comparison results and the concatenated phylogenetic MLSA were also graphed.
Results MLSA Phylogenetic Analysis The phylogenetic analysis included the 141 reference strains of species that were validly described and used in a previous paper (Mulet et al., 2012a) combined with 112 Pseudomonas strains that had complete or draft genomes available in databases (Supplementary Table 1). A series of individual and concatenated phylogenetic trees from 16S rRNA, gyrB, rpoB, and rpoD partial gene alignments were generated. Individual dendrograms were generated using different methods, namely the NJ, MP, and ME methods. Their topologies were congruent (data not shown), as previously demonstrated by Mulet et al. (2010). Phylogenetic groups (G) and subgroups (SG) were defined by the length and branching order of the concatenated gene tree, as previously proposed (Mulet et al., 2010) and updated in 2012 (Mulet et al., 2012a). The name of the first species described in a group or subgroup was chosen to designate that group or subgroup. The resulting groups were supported by high bootstrap values.
Whole-Genome Comparisons Among the Pseudomonas genomes, the correlation of the tetranucleotide signatures (TETRA), the average nucleotide identity (ANI) and the GGDC were calculated between pairwise genomic comparisons. The statistical calculations of the tetranucleotide frequencies (TETRA) (Teeling et al., 2004), the ANIb and the ANIm were calculated using the JSpecies software tool available at the webpage http://www.imedea.uib.es/jspecies. To calculate the ANI, the genomic sequence from one of the genomes in a pair (“the query”) was cut by the software into 1020 nucleotide consecutive fragments. The 1020 nt fragments were then used to search against the whole genomic sequence of the other
Frontiers in Microbiology | www.frontiersin.org
3
March 2015 | Volume 6 | Article 214
Gomila et al.
Genomics in Pseudomonas systematics
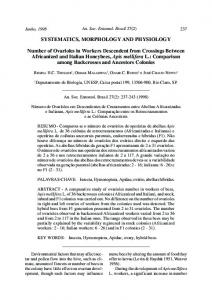
FIGURE 1 | Continued Pseudomonas strains used in this study based on the phylogenetic analysis of four concatenated genes (16S rRNA, gyrB, rpoB, and rpoD). The strains analyzed in this study whose genomes have been sequenced are labeled in red. Distance matrices were calculated by the Jukes-Cantor method. Dendrograms were generated by neighbor-joining. Cellvibrio japonicum Ueda107 was used as outgroup. The bar indicates sequence divergence. Percentage bootstrap values only of groups and subgroups higher than 50% of 1000 replicates are indicated at branching nodes.
A phylogenetic tree (Figure 1) was generated based on the concatenated sequences with a total length of 3711 nucleotides in the following order: 16S rRNA (1278 nt), gyrB (801 nt), rpoD (717 nt), and rpoB (915 nt). Phylogenetic assignation to a known species, group or subgroup of the 112 complete or draft genomes analyzed was congruent in all the trees (data not shown). Fortyeight of the 112 strains (42.8% of the genomes analyzed) were located in the same phylogenetic branch as the corresponding species type strain (or genomovar reference strains in the P. stutzeri species) with a similarity higher than 97%, which was the accepted species threshold (Mulet et al., 2010, 2012a), and their species assignations were considered correct. As observed in Table 1, 22 of the whole genome sequenced strains studied (20%) were only assigned to the genus and 34 strains (30%) were not correctly identified at the species level. For example, strain BBc6R8, which had been identified as P. fluorescens, was included in the P. gessardii phylogenetic subgroup, and P. fulva 12-X was closer to P. straminea than to the P. fulva type strain. The closest species type strain for the 112 complete or draft genomes analyzed based on the concatenated analysis of four genes is listed in Table 1 and in Supplementary Table 2. Thirty-seven of the genomes were less than 97% similar to the closest type strain and might be considered representatives of Pseudomonas species not yet described or have to be assigned to genomovars in the case of P. stutzeri.
Genomic Analysis and Correlation with MLSA TETRA, average nucleotide identity based on MUMmer (ANIm) or BLAST (ANIb) and GGDC comparisons were calculated for the 112 genomes. In total, each final dataset consisted of 12,544 pairwise values, including the 112 pairwise comparisons of each genome with itself. Each square matrix obtained was transformed in a lower-triangular matrix using the average value of the duplicate analyses for each pair. The final dataset consisted of 6328 pairwise values. A dendrogram was generated for each matrix to assess their phylogenetic coherence (data not shown). The ANIb dendrogram showed the best topology congruence compared to the MLSA phylogenetic tree (Supplementary Figure 1). Phylogenetic similarities in the analysis of the four concatenated genes were compared with all the indices calculated in the whole genome analyses. The results are plotted in Figure 2. The overall relationship between the MLSA analysis and the wholegenome analysis was found to be non-linear, which is consistent with previous studies performed using ANI and 16S rRNA gene sequence similarities (Konstantinidis and Tiedje, 2005a,b; Mulet et al., 2010; Kim et al., 2014). Correlation analyses between all
FIGURE 1 | Phylogenetic tree of the 112 complete or draft genomes of strains related to the genus Pseudomonas and the 141 well described (Continued)
Frontiers in Microbiology | www.frontiersin.org
4
March 2015 | Volume 6 | Article 214
Gomila et al.
Genomics in Pseudomonas systematics
TABLE 1 | Phylogenetic affiliation based on concatenated MLSA analysis for the 63 whole genome sequenced strains not assigned, or incorrectly assigned at the species level, including strains of P. stutzeri genomovars. Species
MLSA similarity %
Closest species type strain
MLSA similarity %
Closest-related strain
MLSA similarity % with Representative representative species of species of G or SG the group
P. fluorescens WH6
96.17
P. azotoformans LMG 21611T
96.17
P. azotoformans LMG 21611T
95.03
P. fluorescens SS101
96.11
P. azotoformans LMG 21611T
98.55
P. fluorescens A506
95.11
P. fluorescens A506
96.00
P. azotoformans LMG 21611T
98.55
P. fluorescens SS101
95.03
P. fluorescens BRIP3487
99.54
P. poae LGM 21465T
99.54
P. poae LMG 21465T
95.03
P. fluorescens NZ007
98.47
P. salomonii LMG 22120T
98.47
P. salomonii LMG 22120T
96.26
P. fluorescens SBW25
96.72
P. lurida P 513/18T
96.72
P. lurida P 513/18T
96.07
Pseudomonas sp. Ag1
96.24
P. brenneri DSM 15294T
99.65
P. fluorescens BBc6R8
96.12
P. fluorescens BBc6R8
96.29
P. brenneri DSM 15294T
99.65
Pseudomonas sp. Ag1
96.12
Pseudomonas sp. PAMC25886
96.41
P. brenneri DSM 15294T
98.36
P. fluorescens BBc6R8
95.98
P. psychrophila HA4
95.17
P. psychrophila DSM 17535T
95.17
P. psychrophila DSM 17535T
Pseudomonas sp. UW4
97.89
P. jessenii ATCC 700870T
98.72
Pseudomonas sp. GM48
97.94
P. jessenii ATCC 700870T
Pseudomonas sp. GM74
97.66
Pseudomonas sp. GM55
Group or subgroup
P. fluorescens ATCC 13525T
P. fluorescens SG/P. fluorescens G
P. gessardii CIP 105469T
P. gessardii SG/P. fluorescens G
95.10
P. fragi ATCC 4973T
P. fragi SG/P. fluorescens G
Pseudomonas sp. GM33
97.89
P. jessenii ATCC 700870T
P. jessenii SG/P. fluorescens G
98.36
Pseudomonas sp. UW4
97.94
P. jessenii ATCC 700870T
97.70
Pseudomonas sp. GM48
97.66
97.94
P. jessenii ATCC 700870T
98.00
Pseudomonas sp. GM33
97.94
Pseudomonas sp. GM33
97.97
P. jessenii ATCC 700870T
98.72
Pseudomonas sp. UW4
97.97
Pseudomonas sp. GM78
98.58
P. umsongensis LMG 21317T
98.58
P. umsongensis LMG 21317T
96.91
P. fluorescens Pf0-1
96.46
P. koreensis LMG 21318T
96.55
Pseudomonas sp. GM30
96.46
P. koreensis LMG 21318T
P. koreensis SG/P. fluorescens G
Pseudomonas sp. GM30
97.78
P. koreensis LMG 21318T
98.33
P. fluorescens R124
97.78
P. fluorescens R124
97.53
P. koreensis LMG 21318T
98.33
Pseudomonas sp. GM30
97.53
P. fluorescens NZ011
96.80
P. koreensis LMG 21318T
97.11
Pseudomonas sp. GM80
96.80
Pseudomonas sp. GM80
96.66
P. baetica CECT 7720T
97.11
P. fluorescens NZ011
95.97
Pseudomonas sp. GM50
98.58
P. lini CFBP 5737T
99.51
Pseudomonas sp. GM102
96.83
P. mandelii LMG 21607T
P. mandelii SG/P. fluorescens G
Pseudomonas sp. GM18
97.67
P. lini CFBP 5737T
97.84
Pseudomonas sp. GM50
96.49
Pseudomonas sp. GM60
97.14
P. migulae CCUG 43165T
99.35
Pseudomonas sp. GM67
96.06
Pseudomonas sp. GM21
97.36
P. lini CFBP 5737T
97.36
P. lini CFBP 5737T
96.94
(Continued)
Frontiers in Microbiology | www.frontiersin.org
5
March 2015 | Volume 6 | Article 214
Gomila et al.
Genomics in Pseudomonas systematics
TABLE 1 | Continued Species
MLSA similarity %
Closest species type strain
MLSA similarity %
Closest-related strain
MLSA similarity % with Representative representative species of species of G or the group SG
P. fluorescens NCIMB 11764
96.73
P. migulae CCUG 43165T /P. lini CFBP 5737T
96.96
Pseudomonas sp. GM21
96.38
Pseudomonas sp. GM79
98.47
P. lini CFBP 5737T
99.54
Pseudomonas sp. GM102
96.71
Pseudomonas sp. GM102
98.53
P. lini CFBP 5737T
99.54
Pseudomonas sp. GM79
96.80
Pseudomonas sp. GM67
97.42
P. migulae CCUG 43165T
99.35
Pseudomonas sp. GM60
96.38
Pseudomonas sp. GM17
99.02
P. chlororaphis subsp. chlororaphis ATCC 9446T
99.05
P. chlororaphis subsp. aureofaciens 30-84
99.02
P. chlororaphis subsp. aureofaciens 30-84
98.83
P. chlororaphis subsp. chlororaphis ATCC 9446T
99.05
Pseudomonas sp. GM17
98.83
P. chlororaphis 06
99.65
P. chlororaphis subsp. aureofaciens LMG 1245T
99.73
P. chlororaphis subsp. chlororaphis PG72
98.16
P. chlororaphis subsp. chlororaphis PG72
99.86
P. chlororaphis subsp. aureofaciens LMG 1245T
99.86
P. chlororaphis subsp. aureofaciens LMG 1245T
98.00
P. fluorescens Q8r1-96
99.81
P. brassicacearum DSM 13227T
99.92
Pseudomonas brassicaceae subsp. brassicaceae NFM 421
95.23
P. fluorescens Q2-87
96.88
P. brassicacearum DSM 13227T
97.05
Pseudomonas brassicaceae subsp. brassicaceae NFM 421
95.03
Pseudomonas sp. M47T1
91.01
P. koreensis LMG 21318T
91.04
P. fluorescens R124
–
P. syringae pv. phaesicola 1448A
99.02
P. ficuserectae CCUG 32779T
99.02
P. ficuserectae CCUG 32779T
96.18
P. syringae pv. tomato DC3000
98.78
P. avellanae CIP 105176T
98.78
P. avellanae BPIC 631
94.66
P. putida KT2440
96.80
P. monteilii ATCC 700476T
99.35
P. putida BIRD-1
95.44
P. putida W619
94.78
P. plecoglossicida ATCC 700383T
95.33
Pseudomonas sp. GM84
93.64
P. putida GB-1
96.80
P. monteilii ATCC 700476T
97.09
P. putida KT2440
95.93
P. putida S16
96.04
P. monteilii ATCC 700476T
98.47
P. putida HB3267
95.10
P. putida CSV86
94.97
P. japonica JCM 21532T
94.97
P. japonica JCM 21532T
90.32
P. putida HB3267
96.44
P. monteilii ATCC 700476T
98.47
P. putida S16
95.41
Group or subgroup
P. chlororaphis P. chlororaphis SG/P. fluorescens G subsp. chlororaphis ATCC 9446T
P. corrugata ATCC 29736T
P. corrugata SG/P. fluorescens G
–
n.a. SG/P. fluorescens G
P. syringae ATCC 19310T
P. syringae G
P. putida ATCC 12633T
P. putida G
(Continued)
Frontiers in Microbiology | www.frontiersin.org
6
March 2015 | Volume 6 | Article 214
Gomila et al.
Genomics in Pseudomonas systematics
TABLE 1 | Continued Species
MLSA similarity %
Closest species type strain
MLSA similarity %
Closest-related strain
MLSA similarity % with Representative representative species of species of G or the group SG
P. putida BIRD-1
96.61
P. monteilii ATCC 700476T
99.35
P. putida KT2440
95.13
Pseudomonas sp. TJI-51
94.81
P. monteilii ATCC 700476T
94.92
P. putida HB3267
94.11
Pseudomonas sp. GM84
96.47
P. plecoglossicida ATCC 700383T
96.47
P. plecoglossicida ATCC 700383T
93.58
P. putida B6-2
96.80
P. monteilii ATCC 700476T
99.65
P. putida ND6
95.41
P. putida ND6
96.80
P. monteilii ATCC 700476T
99.87
P. putida F1
95.50
P. putida F1
96.72
P. monteilii ATCC 700476T
99.87
P. putida ND6
95.41
P. putida LS46
96.89
P. monteilii ATCC 700476T
99.68
P. putida ND6
95.38
P. fulva 12-X
96.47
P. straminea LMG 21615T
96.47
P. straminea LMG 21615T
96.47
P. straminea LMG 21615T
P. straminea G
P. pseudoalcaligenes KF707
91.63
P. citronellolis LMG 18378T
91.63
P. citronellolis LMG 18378T
88.67
P. aeruginosa ATCC10145T
P. aeruginosa G
P. pseudoalcaligenes CECT 5344
99.81
P. oleovorans subsp. oleovorans ATCC 8062T
99.81
P. oleovorans subsp. oleovorans ATCC 8062T
99.81
P. oleovorans subsp. oleovorans ATCC 8062T
P. oleovorans G
P. oleovorans MOIL14HWK12
99.54
P. psychrotolerans LMG 21977T
99.54
P. psychrotolerans LMG 21977T
99.40
P. oryzihabitans ATCC 43272T
P. oryzihabitans G
P. stutzeri NF13
92.57
P. stutzeri ATCC 17588T
93.28
P. stutzeri CCUG 29243
92.57
P. stutzeri ATCC 17588T
P. stutzeri G
P. stutzeri SDM-LAC
94.81
P. xanthomarina CCUG 45643T
94.81
P. xanthomarina CCUG 45643T
88.72
P. stutzeri DSM 10701 (JM300)
90.45
P. stutzeri ATCC 17588T
91.27
P. stutzeri TS44
90.45
P. stutzeri ATCC 14445 (ZoBell)
90.55
P. stutzeri ATCC 17588T
92.27
P. stutzeri RCH2
90.55
P. stutzeri RCH2
92.54
P. stutzeri ATCC 17588T
92.87
P. stutzeri CCUG 29243
92.54
P. stutzeri TS44
92.06
P. stutzeri ATCC 17588T
95.18
Pseudomonas sp. Chol1
92.06
P. stutzeri CCUG 29243 (AN10)
91.34
P. stutzeri ATCC 17588T
93.28
P. stutzeri NF13
91.34
Pseudomonas sp. Chol1
91.94
P. stutzeri ATCC 17588T
95.18
P. stutzeri TS44
91.94
Group or subgroup
n.a., not assigned.
the whole-genome comparison results and concatenated phylogenetic MLSA distances were also performed (Supplementary Table 3). Among the various methods proposed for substituting the experimental DDH high correlations were found between MLSA and ANIb (0.933 Spearman’s rho and 0.917 Pearson coefficients) and between MLSA and GGDC (0.928 Spearman’s rho and 0.766 Pearson’s coefficients). The Pearson’s correlation coefficients between ANIm and MLSA, GGDC and MLSA, and
Frontiers in Microbiology | www.frontiersin.org
TETRA and MLSA were 0.838, 0.766, and 0.65, respectively. The ANIb values were selected and thoroughly analyzed as indicated in Figure 3. Square A (ANIb ≥ 95; MLSA ≥ 97, the threshold species delimitation by each index) included 315 pairwise comparisons of strains of the same species, such as P. aeruginosa, P. mendocina, and P. putida, subspecies of P. oleovorans, and P. stutzeri members of the same genomovar. Most of the values (5845) accumulated in square B (ANIb < 90%; MLSA
0.99 and MLSA > 97%; green triangles indicate TETRA > 0.99 and MLSA < 97%; and red triangles
TETRA < 0.99 and MLSA > 97%. ANIb and ANIm black circles indicate genomic values 95% and MLSA > 97%; green triangles genomic values between 90 and 95% and MLSA < 97%; red triangles genomic values between 90 and 95% and MLSA > 97%; and blue circles genomic values between 85 and 90% and MLSA > 97%. The values of GGDC < 70% and MLSA < 97% and GGDC > 70% and MLSA > 97% are indicated in black circles in GGDC plots; in green triangles are indicated values of GGDC < 70% and MLSA > 97%.
range of