Jun 21, 2002 - Runaway electrons are almost completely eliminated by the ... Time (s). Radiated Power (arb). Tile Current (A/tile). Plasma Vertical Position (cm). Plasma Current .... shows a series of trajectories in the phase space of plasma ...
29th EPS Conference on Plasma Phys. and Contr. Fusion Montreux, 17-21 June 2002 ECA Vol. 26B, P-5.060 (2002)
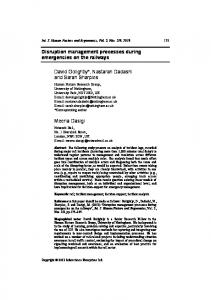
Physics Processes in Disruption Mitigation Using Massive Noble Gas Injection D.A. Humphreys,1 D.G. Whyte,2 T.C. Jernigan,3 T.E. Evans,1 D.S. Gray,2 E.M. Hollmann,2 A.W. Hyatt,1 A.G. Kellman,1 C.J. Lasnier,4 P.B. Parks,1 and P.L. Taylor1 1General Atomics, P.O. Box 85608, San Diego, California 92186-5608 USA 2University of California, San Diego, 9500 Gilman Drive, La Jolla, California 92093 USA 3Oak Ridge National Laboratory, P.O. Box 2008, Oak Ridge, Tennessee 37831 4Lawrence Livermore National Laboratory, P.O. Box 808, Livermore, California 94551 USA I. INTRODUCTION Methods for detecting imminent disruptions and mitigating disruption effects using massive injection of noble gases (He, Ne, or Ar) have been demonstrated on the DIII–D tokamak [1]. A jet of high injected gas density (> 1024 m -3) and pressure (> 20 kPa) penetrates the target plasma at the gas sound speed (~300–500 m/s) and increases the atom/ion content of the plasma by a factor of > 50 in several milliseconds. UV line radiation from the impurity species distributes the plasma energy uniformly on the first wall, reducing the thermal load to the divertor by a factor of 10. Runaway electrons are almost completely eliminated by the large density of free and bound electrons supplied by the gas injection. The small vertical plasma displacement before current quench and high ratio of current decay rate to vertical growth rate result in a 75% reduction in peak halo current amplitude and attendant forces. II. DISRUPTION EFFECTS, DETECTION, AND MITIGATION A vertical displacement event (VDE) disruption is characterized by an initial loss of vertical position, followed by wall limiting, a drop in edge safety factor, and finally a plasmaterminating thermal quench. A major disruption by contrast occurs when the plasma stored energy is lost before any loss in plasma position. Both can apply a large thermal load to plasma facing components (PFC’s), particularly near the divertor strikepoints or the limiting point. Because motion into a limiting surface converts currents on closed field lines to current on open (halo) field lines with high efficiency, a VDE tends to produce the largest halo currents [2]. Finally, the large electric fields produced during a rapid current quench in the very cold (typically Te < 30 eV in DIII-D) post-thermal quench plasma can exceed the critical field required to produce runaway electrons [3]. High performance next-generation devices as well as power reactors will require reliable and accurate disruption detection algorithms, coupled with a robust and effective mitigation method. In DIII-D the imminent onset of a variety of disruptions can be detected by a variety of physics-based recognition algorithms implemented in the DIII-D Plasma Control System (PCS) [4], which can take corrective action or trigger the gas injection mitigation system in response. Figure 1 illustrates the use of a vertical position threshold detector in identifying an intentionally-induced VDE and triggering the mitigation system. Following disabling of vertical control, the plasma moves downward and crosses the specified threshold vertical position (± 5 cm). The PCS generates a signal triggering injection of high pressure Ne, which produces a radiative thermal quench ~4 ms after the trigger. Only 3%–5% of the total plasma (thermal and magnetic) energy is conducted to the divertor surface in a mitigated disruption, while typically 20%–40% is delivered to the divertor in an unmitigated disruption. Peak stress from halo currents is reduced by ~75% from the unmitigated value. Other detection algorithms implemented in the PCS include a radiated power threshold and a sophisticated neoclassical tearing mode (NTM) and locked mode detector.
29th EPS 2002; D.A.Humphreys et al. : Physics Processes in Disruption Mitigation Using Massive Noble Gas In...
2 of 4
Prad (GW)
ne (1020m–3)
Te (keV)
Ip (MA)
dB/BT (%)
VDE Detector Triggers Mitigation 2 High pressure impurity gas injection Gas inject trigger 1 Plasma Current (MA) significantly mitigates all of the principal 0 disruption effects in DIII-D and offers a 20 Vertical limits Plasma Vertical Position (cm) 0 promising option for disruption mitigation in –20 burning plasma experiments. The DIII-D 10 Radiated Power (arb) high pressure impurity gas injection system Mitigated 5 0 consists of a 7 MPa reservoir which can 1.60 1.62 1.64 1.66 1.68 1.70 1.72 1.74 1.76 1.78 1.80 inject ~4×10²² particles into the vessel in 2– 1000 Tile Current (A/tile) Unmitigated 500 (expanded scale) 5 ms using a fast-opening valve. If 0 1.720 1.725 1.730 1.735 1.740 1.745 1.750 1.755 1.760 distributed uniformly throughout the 20 m 3 Time (s) of the DIII-D plasma volume, this yields an Fig. 1. Illustration of vertical position threshold impurity density of ~2×10²¹ particles/m3, detector used to identify an intentionally-induced VDE > 50 times the initial plasma density. The and trigger the impurity gas injection system. ram pressure produced by the jet is typically 20–30 kPa, several times larger than the volumeaveraged plasma electron pressure (~7 kPa) and comparable to the peak plasma pressure in the DIII-D target plasmas studied. That the jet pressure is significantly greater than the plasma pressure is supported by the observation that the propagation of the cold front is ballistic at the sound velocity of each impurity species injected (He, Ne, and Ar). gas jet The KPRAD code [5] makes use of power balance and detailed accounting of impurity and target species ionization states 0.5 to predict the evolution of the thermal nozzle pressure (a.u.) edge ECE , Z , and densities of collapse, including Te eff (a.u.) 0 ionized and neutral impurities. Figure 2 jet radiative cooling release jet reaches thermal collapse edge plasma shows an example of a KPRAD calculation 2 loss of closed flux surfaces for a He-mitigated disruption in which a 1 central soft current quench VDE is not triggered and the final plasma Te X-ray emission (a.u.) 0 equilibrates at ~3.4 eV during the current 2 quench. Virtually 100% of the plasma stored central 1 energy is radiated isotropically by the plasma Te data 0 impurity, principally as UV line radiation, in model 10 a thermal quench of less than 0.1 ms [1]. The midplane ne plasma remains well-centered in the absence 1 of a forced VDE, resulting in a very low peak halo current fraction (peak poloidal halo 4 central current ~0.07Ip0) when the plasma eventually 2 plasma Prad limits against the divertor floor. Good 0 –5 0 5 10 15 agreement is seen between experimental and Time after gas jet trigger (ms) modeled evolution of the plasma electron temperature and density, as well as total Fig. 2. KPRAD simulation of pre-emptive termination using high pressure He-gas injection. radiated power and current decay rate. The detailed evolution of both core and halo plasmas can be simulated with significant accuracy using the GA halo model [1] and plasma geometry evolution data reconstructed by the JFIT code [6]. One key result of this model is that the peak poloidal halo current in a VDE is reduced by increasing the post-thermal quench plasma resistivity or by decreasing the plasma velocity during the wall-limited phase of the VDE. These actions will produce a higher halo safety factor during the current quench, and thus reduce the poloidal halo current since the poloidal halo current is inversely proportional to the instantaneous halo safety
29th EPS 2002; D.A.Humphreys et al. : Physics Processes in Disruption Mitigation Using Massive Noble Gas In...
3 of 4
Peak poloidal halo current (MA)
Toroidal peaking factor
pol Mitigated VDE (110216) Unmitigated VDE (110217) 2 factor, I halo = I tor 2 halo q halo . The toroidal halo Core plasma current (MA) Core plasma current (MA) 1 1 current, I tor JFIT JFIT halo , is proportional to the plasma (b) (a) Model Model 0 0 current at the beginning of the wall-contact 0 0 Vertical position (m) Vertical position (m) phase of the current quench. 1 1 2 2 Mitigation of disruption halo currents by Halo safety factor 5 5 Halo safety factor early injection of high-pressure impurity gas occurs primarily by reducing the plasma 0 0 0.2 current at the beginning of the wall-contact 0.2 Poloidal halo current (MA) Poloidal halo current (MA) JFIT JFIT 0.1 0.1 Model Model phase of the current quench by initiating the 0.0 TCA TCA 0 1.740 1.745 1.750 1.755 1.735 1.740 1.745 current quench well before the plasma is Time (s) Time (s) wall-limited, ideally before any vertical Fig. 3. Application of halo model to unmitigated (a) motion has begun. Figure 3 shows an and mitigated (b) discharges shows good agreement example of the halo model applied to a for Te (unmitigated)=5 eV, Zeff(unmitigated)=1.5, comparison of mitigated and unmitigated T e(mitigated)= 2.4 eV, Zeff(mitigated)=1.5. VDE’s. The mitigated case corresponds to injection of high-pressure Ne gas when the plasma has moved ~5 cm from its equilibrium position. These simulations show that the unmitigated case is consistent with post-thermal quench values of Te ~5.0±0.5 eV, Zeff =1.5, while the mitigated case is consistent with postthermal quench values of Te ~2.4±0.5 eV, Zeff=1.5 (and thus increased resistivity). To explore the importance of prompt 0.2 mitigation, a set of DIII-D experiments was 2.0 performed in which the VDE detector was used to vary the vertical position at which the gas injection occurred. Figure 4 shows the 1.5 peak halo current and toroidal peaking factor 0.1 no mitigation (TPF) measured as a function of the vertical position at time of mitigation. The figure 1.0 0.00 0.05 0.10 shows that the peak halo current is larger the later into the VDE the gas is fired. Figure 5 ∆Zthreshold (m) shows a series of trajectories in the phase Fig. 4. Peak halo current and TPF as a function of space of plasma current Ip(t) versus vertical vertical position at which gas injection occurs. position Z p(t). The line indicating the vertical position at the point of wall contact is crossed at increasingly high values of plasma current with later times of gas injection. The results support the model that the halo current is proportional to the plasma current at the time when the plasma is both in wall contact and undergoing the current quench. The larger plasma minor radius and thus halo safety factor at wall contact further serves to reduce the poloidal component of the halo current. Runaway electrons can be generated when the large parallel electric field (E||) produced by the high resistive loop voltage (typically VLCQ ~ 500–1000 V in DIII-D) in the postthermal quench plasma accelerates electrons to relativistic speeds. If E||> Ecrit ≡ mcν/e α ne(thermal), the acceleration will exceed the collisional drag, allowing any seed relativistic electrons to experience knock-on avalanche amplification to become a population of runaway electrons. The collisional slowing-down rate ν is proportional to the thermal electron density, including both bound and unbound electrons. The amplification is ∝ eG, where G≡γREτCQ, and γRE ∝ ν( E||/Ecrit – 1). Thus, a sufficiently large total (bound+unbound) thermal electron density will yield Ecrit > E|| so that γRE