resonance in the complex frequency plane determines the kind of mixing rate in the time evolution. Introduction. The statistical analysis of chaotic time evolutions ...
Communications in Commun. Math. Phys. 116, 343-352 (1988)
Mathematical
Physics
©Springer-Verlagl988
Resonances in Chaotic Dynamics Stefano Isola Dipartimento di Fisica, Universita di Firenze, 1-50125 Firenze, Italy
Abstract. We present a discussion and some numerical results on the actual possibility of making accessible, by numerical techniques, the complex singularities of the power spectrum (resonances) for a chaotic signal. Henon's transformation is investigated in detail, showing that the position of the leading resonance in the complex frequency plane determines the kind of mixing rate in the time evolution. Introduction
The statistical analysis of chaotic time evolutions proceeds through the introduction of quantities which make us able to study invariant features for the dynamical system we deal with. Let us make this statement more precise. A (differentiable) dynamical system is a time evolution x(t) = ftx(0) on a manifold M, where / is a differentiable function and t may be an integer or a real number. A chaotic time evolution is defined by the presence of sensitive dependence on initial conditions; namely, any small noise (always present in physical as well as in computer experiments) will be exponentially amplified as time goes on. Due to this feature the system undergoes a sort of lack of memory about its past history and precise predictions on the future become impossible. Nevertheless, we assume that the time averages of a given differentiable function, A :M-+R (i.e. an observable): = lim ^ M(/'x0)dt Γ-^oo 1 0
(1)
exist for some x0, defining a probability measure ρ, which is invariant under time evolution and ergodic. Then we can write:
(2) In physical applications this turns out to be true very often (see [1]).
344
S. Isola
In this picture we can define some ergodic quantities, i.e. some functions of the measure ρ, which make it possible to investigate statistical properties of the time evolution. Some of them - characteristic exponents, entropy, information dimension - are already easily accessible and indeed they constitute, at the present time, the main tools to study chaotic behaviors. The aim of this paper is to show that another interesting quantity - the complex singularities of the power spectrum of a signal - is actually accessible and computable by numerical techniques. Poles at complex values of the frequency in the spectrum are naturally interpreted as resonances of the dynamical system and they are strictly related to the decay properties of the time autocorrelation functions. Some theoretical works on this problem have been carried out recently for a particular class of differentiable dynamical systems called Axiom A systems (see [2] and [3-5]). In this case one can deal with the problem through symbolic dynamics and study the time correlation functions corresponding to the invariant measure (chosen as a Gibbs state) as space correlation functions for a onedimensional statistical mechanics system with short range interactions. In this framework the authors proved that the Fourier transform of thfe correlation function is meromorphic in a strip, and the position of the poles does not depend on the observable monitored. Furthermore, for a discrete time mixing system there are no poles in a sufficiently narrow strip above and below the real axis, and this corresponds to an exponential decay of correlations (see [6] and, for some examples where this is true also for a continuous flow, [7, 16, 17].) In the next sections we present some results on the actual presence of resonances in more general (non-Axiom A) dynamical systems, for which numerical studies are often the only accessible tool of investigation. In particular we shall discuss the problem raised above in the case of a two-dimensional map defined by: x^ + l^^O+l-ocC^W] 2 ,
x2(t + V = β x ι ( t ) ,
(3)
where α and β are external parameters. Equation (3) represents the so-called Henon transformation and some of its statistical properties, like entropy and dimensions, have been largely investigated (see [8-11]). We shall report elsewhere on numerical studies (now in progress) on the logistic map of the interval [0, 1] and the Lorenz system. Time Correlation Functions and Mixing Properties
From here on we restrict ourselves to the simplest case where the observable in Eq. (1) is but a position coordinate. In this case the time autocorrelation function is given by: 2
C(0 = (const) [ - ] ,
(4)
where brackets indicate the average along the time evolution and the constant is chosen such that C(0) = 1. We have computed C(ί) by a standard algorithm. Let us introduce: R(t,T)= -^--VxίτWτ + O, 1
I τ= 1
(5)
Resonances in Chaotic Dynamics
345
where t = 1 . . .m, T is the total number of iterations and x(t) is the position which is assumed to have mean zero. Then we have:
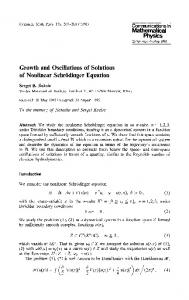
where C(ί, T) is the autocorrelation function averaged over the finite interval T. The choice of m (i.e. the maximum correlation time) is quite delicate. A heuristic argument (see [5]) provides the estimate:
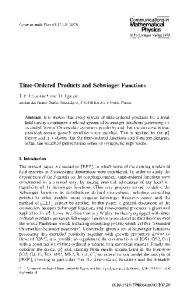
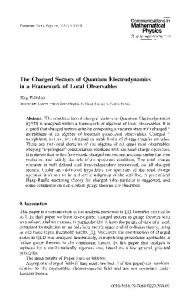
* 1.3, the asymptotic value of C(t) is not strictly zero because of the finite value of Tin Eq. (5). In fact it fluctuates with amplitude —== ~10~ 3 . -/ψ
346
S. ίsola
Fig. la-c. The autocorrelation function C(i) for the Henon map with β = 0.3 and α = 1.4, a; α = 1.35, b;α=1.32,c
Resonances in Chaotic Dynamics
347
-10
Fig. Ic
Power Spectra and Resonances
Let us introduce the Fourier transform for a discrete time signal x(τ), (τeZ):
r-i
x(τ)=
anexp(ίωnτ)
(9)
and \
Γ-l Q
x(τ)exp(-ω n τ),
(10)
where ωn= —— and a* = a_n, V n e Z (because x(τ) is real). Then, the power spectrum is defined as the square of \a(ωn)\ and it measures the amount of energy contained in the signal x(τ) as a function of the frequencies ωn. Because T is finite we have a finite frequency resolution — . From Eqs. (1), (4), and (9) we can get the relation between C(ί, T) and the power spectrum: C(f, T)=~ Y |α(ωj| 2 exp(ϊαv). I
(11)
n=l
In the case of chaotic motion the spectrum becomes continuous in ω and, in the limit T->oo, we get:
(12)
348
S. Isola
where S(ω)= £ C(ί)exp(-iωί).
(13)
ί=0
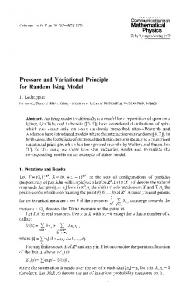
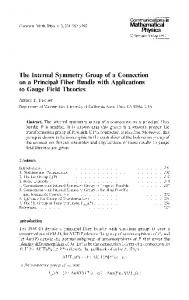
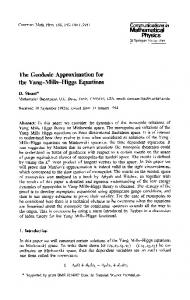
In computing the spectrum for the map (3) we have used the following procedure: compute the function C(t, T) for t as large as 1024, then perform the Fast Fourier Transform (FFT). By taking t as large as 1024 we are able to resolve frequencies as small as —— . The result of this computation corresponding to the situations in Fig. la-c is reported in Fig. 2a-c, while Fig. 2d shows the power spectrum for α= 1.3. In the latter case the peaks correspond to the frequencies ωk = k -— , with fc = l,2,3. It is interesting to notice that in the region with col. 3 (where there is exponential rate of mixing) the shape of the spectrum has bumps which survive in the neighborhood of ω l 5 ω2, and ω 3 ; thus suggesting the presence of resonances. Now, let us introduce an argument which will be useful in the following. Starting from Eq. (12) we can see that the asymptotic behavior of the correlation function is determined by the singularities of the analytic continuation of S(ω) into the complex z plane, which are nearest to the real axis. Indeed, if at a certain value of the parameter α the nearest singularity is a simple pole located at zp = xp + iyp, then, for large f, one gets: C(f)~exp(-j; p f)cos(x p ί + φ).
(14)
So, while xp determines the frequency of the leading resonance, yp turns out to drive the exponential damping of the corresponding oscillation of C(t). Finally we introduce the main result of this paper. First, let us rewrite Eq. (13) as a Taylor expansion: S(w)= Σ 'X,
(15)
π=0
where cn = C(t — n) and w = exp( — iω). The series (1 5) will converge in a suitable ring of analyticity for S(w) in the complex w plane. Nevertheless, we can perform a numerical analytic continuation of (15) by means of Fade approximants (see [13]), namely by appropriate ratios of polynomials in the variable w with coefficients depending on the cn:
and thereby locate the nearest singularities of S(w). In our case a good compromise between numerical precision and the choice of the "good" information on the rate of correlation's decay (according to the discussion in the previous section), is obtained taking 16^L + M5Ξ26. Furthermore, this technique appears to be sufficiently accurate for the study of the nearest and the next-to-nearest singularity of S(w). There is a reassuring check coming from the good consistency among the singularities of the various Fade
Resonances in Chaotic Dynamics
349
0.3
03
ω
π
Fig. 2a-d. The power spectrum S(ω) for the Henon map with β = 0.3 and α= 1.4, a; α= 1.35, b; α = 1.32,c;α = 1.3,d
350
S. Isola
ω
IT
Fig. 2c
u
Fig. 2d
TT
Resonances in Chaotic Dynamics
351
02
Rez
1 57
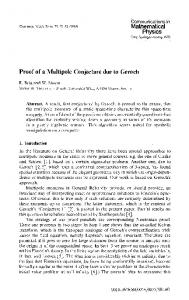
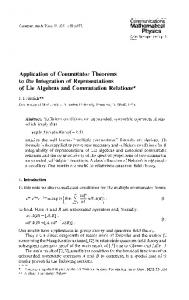
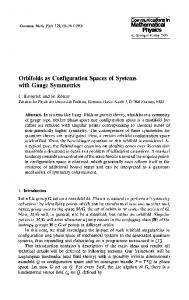
Fig. 3. The displacement of the leading resonance for the power spectrum of the Henon map with /? = 0.3 and α varying from 1.3 (bottom point) to 1.4 (top point) steps 0.01
approximants that can be formed from (15). Figure 3 shows the displacement of the leading resonance in the complex z plane as the parameter α changes from the value 1.3 to the value 1.4 with steps 0.01. For α = 1.3, we can see a real pole located at z = ωί. Increasing the parameter value it moves away from the real axis and accelerates the exponential decay of correlations. As Fig. 3 shows, the motion α-»z(α) = χj(α) + iy^Gt) on the z plane does not appear very regular, and this seems to be a fairly general case; on the other hand, smoothness in the dependence of resonances from the parameter values is not expected in this case, because the Henon map is not structurally stable. Anyway, ^(α) behaves like a monotonic function - at least in the region of parameter values we have considered. To conclude, let us mention that another check of the consistency of this picture comes from the good agreement between the observed rate of decay of C(t) at the various values of α and the corresponding value of ^(α). Conclusions
We have seen how different rates of mixing can be interpreted by the different positions of one or more resonances in the complex frequency plane. On the other hand the presence of a resonance can determine the kind of mixing rate, making it akin to an exponentially damped oscillation. As a matter of fact we have seen that for the one-dimensional map (8) with μ = 4 the power spectrum has no poles at all, and this corresponds to a correlation function which decay faster than any exponential rate, being actually zero after the first step (this agrees to the fact that in these conditions map (8) is conjugated to a Bernoulli shift). However, detailed studies are in progress on this point.
352
S. Isola
Let us conclude mentioning that complex singularities for dynamical systems (in particular concerning intermittency) have been already discussed numerically (see [14,15]), but the approach was completely different because the signal x(t) was involved, rather than its power spectrum. Acknowledgements. A particular thanks to David Ruelle for suggesting the subject of this paper and for helpful discussions. Thanks to S. Ruffo and to J. Zinn-Justin for suggestions concerning numerical aspects and to H. Epstein for providing his graphic software. This work is partially supported by I.H.E.S. (Bures-sur-Yvette, France) and Fondazione Angelo della Riccia (Florence, Italy). References 1. Eckmann, J.-P., Ruelle, D.: Ergodic theory of chaos and strange attractors. Rev. Mod. Phys. 57, No. 3 (1985) 2. Pollicott, M.: On the rate of mixing of Axiom A flows. Invent. Math. 34, 231 (1976) 3. Ruelle, D.: Resonances for Axiom A flows. J. Differ. Geom. 99 (1987) 4. Ruelle, D.: Extension of the concept of Gibbs state in one dimension and application to resonances for Axiom A diffeomorphisms. J. Differ. Geom. 117 (1987) 5. Ruelle, D.: Locating resonances for Axiom A dynamical systems. J. Stat. Phys. 44, No. 3/4, (1987) 6. Ruelle, D.: Thermodynamic formalism. In: Encyclopedia of mathematics and its applications, Vol. 5. (Reading MA: Addison-Wesley 1978) 7. Collet, P., Epstein, H., Gallavotti, G.: Perturbation of geodesies flows on surfaces of constant negative curvature and their mixing properties. Commun. Math. Phys. 95, 61 (1984) 8. Henon, M.: A two dimensional mapping with a strange attractor. Commun. Math. Phys. 50, 69 (1976) 9. Curry, J.H.: On the Henon transformation. Commun. Math. Phys. 68, 129 (1979) 10. Feit, S.D.: Characteristic exponents and strange attractors Commun. Math. Phys. 61, 249 (1984) 11. Paladin, G., Vulpiani, A.: Lett. Nuovo Cim. 41, 82 (1984) 12. Grossmann, S., Thomae, S.: invariant distributions and stationary correlation function of one-dimensional discrete process. Z. Naturforsch. 32 A, 1353 (1977) 13. Baker, Jr., G.A., Graves-Morris, P.R.: Pade approximants. In: Encyclopedia of mathematics and its applications, Vols. 13 and 14. (Reading, MA: Addison-Wesley 1981) 14. Frisch, U., Morf, R.: Phys. Rev. A23, 2673 (1981) 15. Bassetti, B., Butera, P., Raciti, M., Sparpaglione, M.: Phys. Rev. A30, 1033 (1984) 16. Ratner, M.: The rate of mixing for geodesic and horocycle flows, Preprint, Berkeley 1987 17. Pollicott, M.: Analytic extension of the zeta function for surfaces of variable negative curvature. Preprint, I.H.E.S., 1987 Communicated by J.-P. Eckmann Received August 15, 1987; in revised form October 30, 1987