Plant and Soil 256: 253–264, 2003. © 2003 Kluwer Academic Publishers. Printed in the Netherlands.
253
Use of crops for in situ phytoremediation of polluted soils following a toxic flood from a mine spill Mar´ıa Auxiliadora Soriano1 & El´ıas Fereres1,2,3 1 Departamento
de Agronom´ıa, Universidad de C´ordoba, Apartado 3048, 14080 C´ordoba, Spain. 2 Instituto de Agricultura Sostenible, CSIC, Apartado 4084, 14080 C´ordoba, Spain. 3 Corresponding author∗
Received 21 October 2002. Accepted in revised form 13 May 2003
Key words: crops, heavy metals, metal uptake, phytoremediation
Abstract Following a toxic flood from a mine spill that affected over 45 km2 in Southern Spain, experiments were conducted in 1999 to test the feasibility of using crops for phytoremediation of the area, after the mechanical removal of the mud. Two cereals, barley and triticale, and two Brassica spp., rapeseed and ethiopian mustard, were planted in three contaminated plots, 50 × 100 m each, and in a control plot outside the affected area. Soil and plant contents of As, Cd, Cu, Pb, Tl and Zn were measured and bioaccumulation coefficients (BC) were calculated at maturity. The four crops tested accumulated Cd and Zn in the above-ground biomass only in the plot on acid soil. Both species of Brassica accumulated Tl (average BC of 3.6 and 1.4 for rapeseed and mustard, respectively, in contaminated plots). None of the four crop plants accumulated As, Cu and Pb under the experimental conditions. Maximum plant uptake values from soil were 5.4 mg m−2 of As, 0.54 mg m−2 of Cd, 9.7 mg m−2 of Cu, 7.0 mg m−2 of Pb, 3.4 mg m−2 of Tl, and 260 mg m−2 of Zn. Total crop uptake gave estimates for successful phytoremediation of at least five decades, casting doubts on the feasibility of using these crops for decontamination of the area. Nevertheless, cereal grains had mineral contents below toxicity levels for livestock, therefore it might be possible to use these crops for livestock feed while reducing deep percolation and gradually removing metals from polluted soils.
Introduction A toxic flood caused by the failure of a dam holding over 5 000 000 m3 of acid water and toxic mud originated from mine spoil, occurred on April 25, 1998, over 45 km2 in Aznalcóllar, southern Spain. Over 30 km2 of that area were farm lands. A task force of many research groups was created to investigate various aspects of the mine spills (Grimalt and Macpherson, 1999). Simultaneously, the toxic mud was removed mechanically during the period of May– December, 1998. Initial results indicated severe heavy metal pollution in the surface layers of most of the affected, sludge-covered, soils (Cabrera et al., 1999; López-Pamo et al., 1999; Simón et al., 1999). Subsequent studies after the mechanical removal of the ∗ FAX No: +34 957 499 252. E-mail:
[email protected]
mud indicated that soils affected by the spill remained polluted, with highly irregular spatial distribution of the contaminants (Ayora et al., 2001; Galán et al., 2002). The principal pollutants found were Cu, Zn, As, Cd, Tl, and Pb (CSIC, 1999). Among the techniques proposed for reclamation of contaminated soils, phytoextraction, the extraction of contaminants by plants, has been proposed as a cost-effective and an ecologically preferable alternative (Cunnigham et al., 1995; McGrath, 1998; Salt et al., 1995) to the conventional engineering techniques (U.S. Army Toxic and Hazardous Materials Agency, 1987). Among the plant species used in phytoextraction, some are capable of accumulating very high concentrations of heavy metals in their tissues. Such plants are termed hyperaccumulators (Baker and Brooks, 1989; Brooks et al., 1977). However, hyperaccumulator plants usually have low
254 growth rates and annual biomass production (Robinson et al., 1997, 1998). Slow growth rates limit their extraction capacity per unit soil surface, making the time required for an eventual site decontamination a critical factor in phytoextraction technology. Many hyperaccumulators (such as Thlaspi and Alyssum; Baker et al., 2000; Brooks, 1998) are members of the Cruciferae family, which also includes crop plants, such as rapeseed. The use of crop plants for phytoremediation of contaminated soils has the advantages of their high biomass production and adaptive capacity to variable environments. However, to succeed they must be tolerant to the contaminants and be capable of accumulating significant concentrations of phytotoxic chemicals in their tissues. Additionally, crops could make the long time-periods for decontamination more acceptable, economically and environmentally. If the concentration of contaminants in biomass is below critical levels for livestock consumption (Murillo et al., 1999), crops could have an economic value during the phytoextraction process. Use of crops also provides soil protection and reduces dust and potential leaching as positive environmental features. However, there is the risk of the contaminants moving into human and wildlife food-chains (Madejón et al., 2002; Meharg et al., 1999). Field experiments were conducted to test the feasibility of using the following four crops for phytoremediation the contaminated soils from the mine spill at Aznalcóllar: two cereals, barley (Hordeum distichum L.), the cereal crop most tolerant to salinity (Ayers and Wescot, 1985) and known to accumulate Cd and Zn (Ebbs and Kochian, 1998), and triticale (Triticosecale Wittmack), a crop well adapted to acid soils. The two other crops were species of the Brassica genus; rapeseed (B. napus L.), which is tolerant to salinity and capable of accumulating Zn (Ebbs and Kochian, 1997) and ethiopian mustard (B. carinata A. Braun) which has been characterized as a hyperaccumulator of Pb (Kumar et al., 1995).
Materials and methods Experimental layout Three locations within the area flooded by the spill were chosen to establish the experimental plots. They were located to 850 m (C1), 1700 m (C2) and 2500 m (C3) away from the point where the dam was fractured. A control plot (CT) was also established outside
the flooded zone in an area between plots C2 and C3. Preliminary soil analyses indicated that the three locations selected varied widely in their soil contaminant levels, and represented the range of contaminants found within the affected area. Before the accident, the locations selected were devoted to annual crops, primarily a rainfed, sunflower-wheat rotation. In each location (C1, C2, C3 and CT), an experimental plot of 50 m × 100 m was tilled, fenced and prepared for planting. Each plot was subdivided into four strips 12 m wide and 100 m long, and each of the four crops was assigned to a strip in each of the four plots. Soon after crop emergence, the seedlings exhibited substantial variability in visible toxicity symptoms within cropped areas, particularly in the C1 and C3 plots. Evidently, the variability in symptoms was reflecting the spatial variability in the soil concentration of toxic elements following the mechanical removal of the mud and the surface soil. The experimental design was adapted to this situation by selecting, inside each cropped strip, homogeneous areas where growth and symptoms were uniform within each homogeneous area. The selected areas differed gradually from severe symptoms and stunted growth up to normal growth without visible toxicity symptoms. Each individual selected area was considered an elemental plot where soil and plants were sampled for contaminant concentrations. Within each cropped strip, a total of five elemental plots were selected. The resulting experimental design was thus a split plot design with crop as a major factor and degree of plant symptoms as a minor factor. Such experimental design was repeated in the three contaminated locations (C1, C2 and C3) while in the CT, only three sampled areas were selected within each crop at regular intervals within the cropped strip. Soil sampling and analysis To characterize the soil, each experimental plot was subdivided before planting into four 50 m × 25 m areas, and four soil samples from the surface (0– 0.30 m deep) and the subsoil (0.30–0.60 m) were taken within each area with a soil sampling tube, 32 mm in diameter, following a random path, and mixed. Composite soil samples were homogenized and sieved (to 2 mm) and pH and soil texture were determined. At around emergence, gravimetric soil water content, and soil depth, were measured with a soil tube, by taking 0.30 m samples, down to 1.50 m depth where possible,
255 Table 1. Soil characteristicsa of affected (C1, C2 and C3) and unaffected (CT) soils Experimental Plot
Depth (cm)
pH (H2 O)
Sand (%)
Silt (%)
Clay (%)
Mean Texture
CT
0–30
8.3 (8.1–8.4) 8.4 (8.4–8.4)
25.4 (24.6–26.1) 20.9 (18.2–23.6)
40.4 (39.9–40.9) 48.4 (36.6-39.2)
34.2 (33.0–35.5) 41.2 (39.9–42.6)
Clay loam
5.6 (5.1–6.2) 5.7 (5.3–5.9)
43.5 (30.4–65.0) 52.8 (39.7–71.8)
37.7 (25.5–43.9) 31.6 (19.5–38.2)
18.7 (9.5–25.8) 15.6 (8.7–22.1)
Loam
8.1 (8.0–8.1) 8.2 (8.0–8.4)
10.0 (9.7–10.4) 18.1 (15.5–20.7)
51.8 (45.4–58.1) 45.5 (39.0–51.9)
38.2 (32.2–44.2) 36.4 (32.6–40.3)
7.2 (6.7–7.6) 7.6 (7.5–7.8)
30.2 (17.1–52.7) 39.9 (24.2–70.4)
41.4 (30.9–45.2) 37.1 (21.8–43.4)
28.3 (16.4–38.3) 23.0 (7.8–32.4)
30–60
C1
0–30 30–60
C2
0–30 30–60
C3
0–30 30–60
Maximum Soil Depth (cm) >150
Clay
60 to >150
Sandy loam
Silty Clay loam
>150
Silty Clay loam
Clay loam
90 to >150
Loam
a Mean value (range).
at four points within each of the 50 m × 25 m area. Table 1 presents information on texture, pH and depth. Following identification of the elemental plots within each cropped strip, composite soil samples (0– 0.30 m) were taken at each elemental plot for heavy metal analyses, at the crop vegetative stage. A total of five elemental plots per crop differing in plant symptoms were sampled in all three contaminated locations while only three plots per crop were sampled in the control. At crop maturity, each harvested area was sampled in identical fashion for soil heavy metal analyses. Crops and agronomy Barley (Hordeum distichum, cv. ‘Trebon’), triticale (Triticosecale, cv. ‘Trujillo’), rapeseed (Brassica napus, cv. ‘Comet’) and ethiopian mustard (B. carinata) were planted between 14 and 30 January, 1999. The cereals were planted in rows 0.11 m apart at a rate of 11.5 g m−2 . The Brassica spp. were planted in 0.33 m rows with 1 g m−2 of seed. Prior to planting, 5 g N, 9.5 g P2 O5 and 9.5 g K2 O per m−2 were incorporated into the soil, and on 29 March, 9.5 g N m−2 were applied to all four crops as urea.
All experimental plots were harvested at crop maturity, a total of four elemental plots per crop in C1 and C2, five in C3, and three in CT. Harvested areas varied between 2 and 5 m2 depending on the homogeneity of the elemental plot. Plant material was cleaned, seeds were separated from the rest of the above-ground biomass, and all material was oven dried at 65–70 ◦ C to constant weight to determine total biomass and crop yield. Soil and plant heavy metal and arsenic analysis Seeds and the rest of the aerial biomass were ground separately in a metal-free mill. The pulverized plant samples were analyzed to determine As, Cd, Cu, Pb, Tl and Zn content. The average above-ground biomass ion concentrations were calculated as the weighted average of seed and rest of biomass concentrations. Soil samples were air-dried and passed through a 2 mm mesh screen. The screened fraction was analyzed for total metal and arsenic contents (As, Cd, Cu, Pb, Tl and Zn). Chemical analyses were carried out in the Svensk Grundämnesanalys AB (SGAB) laboratories, Luleå Tekniska Universitet, in Sweden. The SGBA laboratory is accredited by
256 the Swedish Board for Accreditation and Conformity Assessment(SWEDAC). Methods used to determine element concentrations were Inductively Coupled Plasma-Atomic Emission Spectrometry (ICP-AES) and Inductively Coupled Plasma-Mass Spectrometry (ICP-MS). The analyses were performed according to US EPA methods 200.7 and 200.8 (modified) for ICPAES and ICP-MS, respectively (USEPA, 1994). The soil and plant tissue samples were dried at 50 ◦ C before digestion and analysis, and the soil samples were homogenized by grinding prior to digestion. Sample digestion was carried out with high purity concentrated nitric acid and hydrogen peroxide in closed teflon vessels in a microwave digestion system (Jones et al., 1991).
Results Heavy metal and arsenic contents in soils Table 2 presents total element concentrations in the first 0.30 m of soil for As, Cd, Cu, Pb, Tl and Zn for the three affected areas (C1, C2 and C3) and for the control (CT). In all cases, soil element concentrations were significantly higher in the contaminated areas than in the CT soil (Table 2) because, despite of the rapid removal of the sludge, significant contamination remained in the affected area (Madejón et al., 2002; Moreno et al., 2001). In fact, the average content of toxic elements in the soils of the contaminated areas, relative to CT, were from 5 to 40 times higher in As, 3–25 times in Cd, 1–10 times in Cu, 2–15 times in Pb, 4–25 times in Tl, and 3–20 times in Zn (Table 2). Among the contaminated areas, the highest concentrations for all elements were in C3 and the lowest in C2. The maximum concentrations observed in some locations within the C3 plot were about two orders of magnitude higher than the maximum values measured in the CT soil (Table 2). Heavy metal and arsenic contents in plant tissues Table 3 presents the concentration of As, Cd, Cu, Pb, Tl, and Zn in the above-ground biomass of each crop sampled at maturity in the four locations. In general, the highest plant concentrations were measured in the C3 and C1 plots, which also had the highest soil concentrations (Table 2). The Cu concentration in aerial biomass of the four crops growing in the affected soils was not significantly different from the control
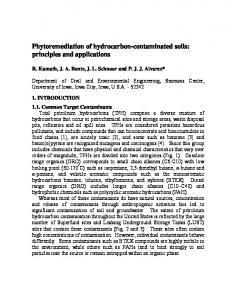
(Table 3). The accumulation of Zn was pH dependent (Table 1), thus the highest Zn accumulation was observed in the plot on acid soil (C1), (Table 3), even though higher levels of Zn in the soil were measured in C3 (Table 2). Element concentrations in the tissues of crops grown in CT were around normal values (Kabata-Pendias and Pendias, 1992). Figure 1 presents the relationships observed between plant and soil element concentrations, which were linearly related in log-log scale, except for Cu (Figure 1). There was no detectable accumulation of Cu in aerial biomass for increasing Cu concentration in the soil, given that concentration in plants did not exceed 20 mg kg−1 Cu even though soil concentrations exceeded 300 mg kg−1 Cu (Figure 1). No differences were detected in the apparent accumulation capacity of the four crops for As, Pb and Zn (Figure 1 and Table 3). However, for the same soil concentrations, there were differences in the Cu and Tl concentrations in the cereals vs. the Brassica spp., and the Cd concentration in barley was lower than in both Brassica species (Figure 1 and Table 3). In the case of Cu, cereals uptake was about twice that of the Brassica spp. (average values of 11.2 mg kg−1 Cu in cereals and 6.6 mg kg−1 Cu in the Brassica spp.). The accumulation of Tl differed among the crops; in cereals, there was essentially no Tl in the aerial biomass (lower than 0.4 mg kg−1 Tl), while the Brassica species accumulated Tl in above-ground biomass at concentrations up to 9.9 and 2.6 mg kg−1 in rapeseed and ethiopian mustard, respectively, (Figure 1, and Table 3). Bioaccumulations coefficients (BC, plant/soil element concentration ratio) are presented in Table 4, for the most contaminated plots (C1 and C3). For Cd and Zn, average BC’s were much higher in C1 (1.4 in rapeseed and 1.1 in mustard, for Cd, and 1.7 for Zn in Brassica spp.) than in C3 (0.5 for Cd and 0.4 for Zn, in both Brassica species), for corresponding total soil concentrations below 500 mg kg−1 Zn and 2 mg kg−1 Cd. As indicated in Table 1, C1 had light soil texture and a pH below 6.2, and it has been shown that Cd and Zn availability and uptake are enhanced in light, acid soils (Kabata-Pendias and Pendias, 1992; Mahler et al., 1982). The BC for As and Pb were below 0.2 and 0.1, respectively, (Table 4), indicating limited accumulation of As and Pb in the aerial biomass of the four crops at physiological maturity. Huang and Cunningham (1996) in short-term pot experiments with soil Pb of 2500 mg kg−1 , observed BC values of 0.09 for corn and 0.05 for wheat. Plants did not accumulate Cu (BC below 0.55 for all crops in the contaminated soils,
257 Table 2. Total concentration (mean and minimum and maximum values, mg kg−1 ) of heavy metal and arsenic in soils (0–0.30 m) in affected (C1, C2 and C3) and unaffected (CT) soils. Means followed by the same letter within each column are not significantly from each other using LSD test (P = 0.05) Experimental Plot CT C1 C2 C3
As
Cd
Element (mg kg−1 ) Cu Pb
6.25 a (4.9–7.8) 57.1 c (17.4–152) 33.4 b (7.4–127) 248 d (53.8–709)
0.094 a (0.07–0.12) 0.577 c (0.14–1.46) 0.333 b (0.12–1.21) 2.42 d (0.48–9.19)
13.0 a (9.4–15.3) 74.1 b (32.3–108) 22.4 a (9.8–63.8) 148 c (44.7–564)
27.0 a (20.4–32.9) 148 c (74.5–235) 73.8 b (19.6–264) 456 d (110–1690)
Tl
Zn
0.094 a (0.05–0.13) 0.526 b (0.08–1.28) 0.444 b (0.10–1.61) 2.67 c (0.59–12.9)
40.0 a (36.1–43.2) 216 c (118–462) 118 b (47.5–430) 787 d (160–3260)
Table 3. (a) Total concentration (minimum and maximum values, mg kg−1 ) of heavy metal and arsenic in aerial biomass of barley, triticale, rapeseed and ethiopian mustard at harvest, growing in affected (C1, C2 and C3) and unaffected (CT) soils. (b) Average for the four crops in the different plots. Means followed by the same letter within each column are not significantly from each other using LSD test (P = 0.05)
As
Cd
Element (mg kg−1 ) Cu Pb
Tl
Zn
Barley Triticale Rapeseed Ethiopian mustard
0.39–1.79 0.64-1.02 0.24–0.43 0.30–0.39
0.051–0.088 0.120–0.140 0.230–0.255 0.322–0.364
9.4–17.1 5.6–15.8 4.2–5.3 4.3–5.0
1.67–6.23 1.54–4.65 0.89–1.13 0.95–1.09
0.023–0.005 0.014–0.009 0.106–0.152 0.033–0.057
21.9–30.6 14.1–24.4 19.4–22.4 21.8–24.0
C1
Barley Triticale Rapeseed Ethiopian mustard
2.21–6.74 1.10–3.31 2.26–5.76 1.83–5.26
0.195–0.436 0.323–0.592 0.253–0.567 0.269–0.450
6.8–13.5 7.0–16.8 6.3–12.7 6.2–11.1
3.62–6.93 4.49–6.04 3.30–9.29 6.02–10.5
0.025–0.070 0.045–0.149 0.59–3.35 0.324–0.659
174–334 168–412 148–273 203–309
C2
Barley Triticale Rapeseed Ethiopian mustard
0.63–1.48 0.84–1.87 1.01–2.81 1.11–1.86
0.045–0.080 0.059–0.177 0.282–0.413 0.258–0.379
9.5–12.6 6.4–11.5 4.8–7.9 3.0–4.2
1.84–4.21 1.85–3.38 2.30–5.54 2.29–3.37
0.010–0.022 0.020–0.068 1.16–5.60 0.204–0.656
64.0–88.5 57.1–96.1 49.8–80.2 35.5–60.3
C3
Barley Triticale Rapeseed Ethiopian mustard
1.46–19.5 2.82–21.2 1.75–4.45 1.31–12.3
0.142–0.434 0.234–1.93 0.276–0.921 0.232–0.747
6.3–15.5 7.5–27.5 4.9–10.6 3.7–9.8
3.5–27.0 4.7–37.3 3.19–7.86 2.54–18.6
0.024–0.163 0.050–0.362 0.16–9.94 0.24–2.55
107–257 93–588 64–293 52–228
All four All four All four All four
0.589 a 3.24 c 1.51 b 6.13 d
0.198 a 0.383 b 0.216 a 0.473 b
7.99 a 10.0 a 6.98 a 10.0 a
2.05 a 5.76 b 3.33 a 10.3 c
0.049 a 0.517 b 0.755 b 1.31 c
22.2 a 238 d 64.1 b 168 c
Plot
(a) CT
(b) CT C1 C2 C3
Crop
258
Figure 1. Trace elements concentration (As, Cd, Cu, Pb, Tl and Zn; mg kg−1 ) in plant tissues (above-ground biomass) of four crop species (barley, triticale, rapeseed and ethiopian mustard) at physiological maturity plotted against soil concentration (both on a logarithmic scale). Linear Regression equations are included in the graph where appropriate. The crossed symbols correspond to data obtained in the C1.
259 Table 4), and the observed Cu concentration values were within normal values in plant tissues (KabataPendias and Pendias, 1992). Both species of Brassica were bioaccumulators of Tl, but rapeseed had a higher BC than the mustard (average BC of 3.6 and 1.4, respectively, in the most contaminated plots, C1 and C3).
For all crops, the maximum observed values for total extraction of contaminants from the polluted soils were 5.4 mg m−2 of As, 0.54 mg m−2 of Cd, 9.7 mg m−2 of Cu, 7.0 mg m−2 of Pb, 3.4 mg m−2 de Tl, and 260 mg m−2 of Zn.
Discussion Toxicity levels in plants Table 5 presents the average concentrations of heavy metals and As in the grain and stover of the four crops tested, in the affected soils. Seeds of all four crops had values below the thresholds indicated as toxic for livestocks with the exception of Tl accumulation in Brassica spp. (Table 5). Accumulation in stover above thresholds occurred in the two Brassica species for Tl and Cd, and in triticale for Cd (Table 5). Total uptake of heavy metals and arsenic by crops Table 6 presents the total above-ground biomass produced by the four crops in C1 and C3 plots (the most contaminated locations). No significant differences in the average biomass were found among the four crops, but there were differences up to one order of magnitude among the selected homogeneous areas within each crop (Table 6). The lack of differences in biomass, combined with the data of Figure 1, meant that all of them extracted about the same amounts of As, Cd, Pb, and Zn, per unit soil surface. For Cu and Tl, there were clear differences in uptake between the cereals and the Brassica species (Table 6). The highest extraction levels per unit surface were observed for the intermediate concentrations in plant tissues (Figure 2). The highest concentrations in plant tissues were measured in the areas where soils had the maximum concentration of pollutants (Figure 1), which impacted plant growth significantly, thus producing very little biomass (Table 6) and consequently, low total extraction per unit ground surface (Figure 2). In the heavily polluted areas, plant growth was so affected that visual estimates of intercepted radiation at peak biomass were less than 20% of incident radiation, thus the very low biomass production (Table 6). The plant tissue concentrations above which plant growth was apparently limited by contaminants were 5–6 mg kg−1 of As, 8–9 mg kg−1 of Pb, and 225–250 mg kg−1 of Zn; such values may be considered as critical toxicity concentrations under the experimental conditions.
The average concentrations found in the soils affected by the spill, when compared to the limit values for agricultural lands proposed by the Commission of the European Communities (CEC, 1986, 1987) indicate that soils in the C3 plot were contaminated with As, Cu, Pb, Zn and Tl, while in the C1 and C2 soils, only As and Pb were above the limit values. If the maximum values reported in Table 2 are considered, then in addition to the five elements mentioned above, C3 is contaminated with Cd, while C1 and C2 have As, Pb, Zn, and Tl levels above the CEC limits. The data in Figure 2 shows that, for a given level of tissue element concentration, there was great variability in total element uptake, particularly at concentrations below those that lead to maximum uptake. That meant that other factors were affecting biomass production in our experiment. Rainfall during the growing season in 1999 was only 150 mm and that caused water deficits in all four crops. Soil water storage at planting was variable among the harvested areas within each plot, because of differences in soil depth and texture (Table 1). Estimated water-holding capacity of the potential root zone varied from 40 mm of water in shallow, light textured soils, up to 190 mm in deep soils of medium and fine texture. Such differences in available water meant that biomass production, and toxic elements uptake, varied substantially depending on the seasonal water supply of the site, regardless of soil contaminant concentration up to a point. For the practical application of phytoremediation, it is necessary to estimate the number of years or croppings required to reduce the content of toxic elements in polluted soils below limit values for agricultural land. To perform such calculations, plant uptake and soil concentration of pollutants are required. Given the large variability in contaminant concentrations within the affected area, the lowering of contaminant concentration via crop extraction would depend on the specific location and toxic element, but our estimates indicate that remediation times would be to the order of several decades. For instance, if we consider an average level for Zn of 450 mg kg−1 soil and calculate
260
Figure 2. Heavy metals (Cd, Cu, Pb, Tl and Zn) and As uptake by aerial biomass of four crop species (barley, triticale, rapeseed and ethiopian mustard) plotted against trace element concentration in tissues (above-ground biomass) at physiological maturity.
261 Table 4. Bioaccumulation coefficients (plant/soil total element concentration ratio) for aerial biomass of barley, triticale, rapeseed and ethiopian mustard at physiological maturity. Minimum and maximum values are reported for the two most contaminated soils (Plots C1 and C3) Plot
Crop As
Cd
Bioaccumulation coefficients Cu Pb Tl
Zn
C1
Barley Triticale Rapeseed Ethiopian mustard
0.07–0.15 0.03–0.09 0.08–0.15 0.07–0.20
0.25–1.10 0.70–1.15 1.20–1.75 0.90–1.30
0.15–0.25 0.15–0.25 0.15–0.25 0.15–0.20
0.04–0.06 0.04–0.06 0.03–0.08 0.04–0.10
0.08–0.50 0.20–0.50 2.90–9.50 1.00–3.20
0.60–1.70 0.90–1.40 1.20–2.55 1.45–2.10
C3
Barley Triticale Rapeseed Ethiopian mustard
0.07–0.15 0.05–0.10 0.01–0.07 0.03–0.15
0.07–0.30 0.15–0.70 0.15–0.80 0.35–1.30
0.50–0.20 0.07–0.055 0.03–0.20 0.07–0.25
0.02–0.05 0.03–0.10 0.01–0.06 0.03–0.10
0.03–0.06 0.03–0.30 0.40–2.95 0.50–1.85
0.15–0.55 0.20–0.90 0.10–0.50 0.20–0.75
the time required to lower such concentration to the limit value indicated in CEC (1986) of 300 mg kg−1 , the crops would have to remove 40.5 g m−2 of Zn from the first 0.20 m of soil. Assuming that the extraction levels of Table 6 apply to that situation, we estimated that the average crop extraction of Zn would be about 400 mg m−2 , thus requiring over 100 croppings for soil remediation. This calculation assumes a constant rate of uptake over the whole period of phytoextraction and a biomass production commensurate with the average rainfall of the area. If we consider the case of Tl (BC above 1 for Brassica spp.), lowering the soil concentration from 2 to 1 mg Tl kg−1 (the threshold proposed by CEC) would take over 50 years, with assumptions similar to those made for the Zn calculations. For ions such as As and Pb, which were not taken up by the aerial parts of the crops tested here, phytoremediation with these four crops is clearly unfeasible. Thus, the prospects of using the crops tested here for phytoremediation of soils contaminated by the Aznalcóllar mine spill are limited, given that most authors (Felix, 1997; Robinson et al., 1998) suggest that for phytoremediation to be competitive, cropping periods should last 5–10 years and should not exceed 20 years (Glass, 1999). In the case of Zn, the highest Zn uptake levels observed have been obtained with the Zn hyperaccumulator Thlaspi caerulescens. Baker et al. (1994) measured maximum Zn uptake of 2.76–3.01 g m−2 in small plots of Thlaspi under intensive cropping conditions, and soil Zn concentration of 444 mg kg−1 . Felix (1997) observed in small plots in the field maximum Zn uptake of 3.41 g m−2 , from soils that had around 810 mg kg−1 Zn with an average biomass
production of 1340 g m−2 . Such level of biomass production for Thlaspi caerulescens appears extremely high, even under conditions of homogeneous soils and high nutrient and water inputs; others authors (i.e., Robinson et al., 1998) have reported biomass levels of only 260 g m−2 . In these studies, the concentration of Zn in Thlaspi tissues was almost an order of magnitude higher than those reported in Table 3 for the four crops tested here. However, it is doubtful that, given the water regime and fertility conditions of the soils in the contaminated area of Aznalcóllar, the Zn biomass production and thus the Zn extraction by T. caerulescens could reach the values reported previously (Baker et al., 1994; Felix, 1997). One advantage of using crops for phytoextraction is the possibility of obtaining some economic returns during the process. As shown in Table 5, cereal grains were perfectly suited for livestock and their use for stock fodder would contribute to the profitability of using phytoremediation under the experimental conditions. Crop yields are relatively low, however, as they are grown under rainfed conditions (Table 6). The use of plants to clean up contaminated soils with heavy metals makes sense only if the cropping period is reasonable. None of the plants tested here fulfils this prerequisite in the contaminated soils studied becauseuptake rates were too low, and contaminant levels were very variable and high. Phytoremediation by crops may be viable under certain conditions if they can be used for livestock feed while reducing deep percolation and gradually removing metals from the polluted soil. Other advantages of phytoremediation (assuming a vegetative cover sufficiently dense) in-
262 Table 5. Heavy metal and arsenic concentrations (mean ± S.D., or range, mg kg−1 dry matter) in seeds and stover of barley, triticale, rapeseed and ethiopian mustard at harvest, growing in the affected soils, and toxic levels for livestock feed Crop As
Cd
Cu
Element (mg kg−1 ) Pb
Tl
Zn
Barley
Seed Stover
N.D.1 –0.335 5.72 ± 6.71
0.035 ± 0.024 0.297 ± 0.210
8.23 ± 1.08 11.7 ± 3.9
0.277 ± 0.167 9.66 ± 8.74
N.D.–0.004 0.067 ± 0.059
88.1 ± 13.7 196 ± 125
Triticale
Seed Stover
N.D.–0.297 6.62 ± 8.01
0.081 ± 0.066 0.575 ± 0.664
8.89 ± 1.26 12.4 ± 7.9
0.175 ± 0.121 11.7 ± 13.5
N.D.–0.002 0.159 ± 0.144
92.0 ± 17.9 228 ± 213
Rapeseed
Seed Stover
N.D.–0.429 3.27 ± 1.50
0.055 ± 0.046 0.516 ± 0.339
3.95 ± 0.95 7.98 ± 2.65
0.401 ± 0.249 5.77 ± 2.38
2.03 ± 2.55 2.72 ± 3.81
84.8 ± 12.8 180 ± 151
Ethiopian mustard
Seed Stover
N.D.–2.16 4.58 ± 4.23
0.072 ± 0.037 0.515 ± 0.229
3.30 ± 0.57 7.65 ± 3.77
1.44 ± 1.26 8.38 ± 6.44
0.680 ± 0.432 0.881 ± 0.983
79.3 ± 15.6 158 ± 123
50
0.5
25–300
30
0.5–13
300–1000
Maximum levels tolerated by livestock (mg kg−1 dry diet)2
1 N.D. indicate non detectable levels (