PICASSO: Exploratory Search of Connected Subgraph Substructures in Graph Databases Kai Huang1,2
Sourav S Bhowmick1
Shuigeng Zhou2
Byron Choi3
1
2
School of Computer Science and Engineering, Nanyang Technological University, Singapore Shanghai Key Lab of Intelligent Info. Proc., School of Computer Science, Fudan University, China 3 Department of Computer Science, Hong Kong Baptist University, Hong Kong
[email protected], khuang14|
[email protected],
[email protected] ABSTRACT Recently, exploratory search has received much attention in information retrieval and database fields. This search paradigm assists users who do not have a clear search intent and are unfamiliar with the underlying data space. Specifically, query formulation evolves iteratively as the user becomes more familiar with the content. Despite its growing importance, exploratory search on graph-structured data has received little attention in the literature. We demonstrate a system called picasso to realize exploratory substructure search on a graph database containing a set of small or medium-sized data graphs. picasso embodies several novel features such as progressive (i.e., iterative) formulation of queries visually and incremental processing, multistream results exploration wall to visualize, explore, and analyze search results to identify possible search directions.
1.
INTRODUCTION
Explosive growth of graph data in many real-world applications has lead to a rejuvenation of research on graph query processing. Particularly, techniques to efficiently support an important query primitive called substructure search have attracted considerable attention from the data management community. In this search primitive, given a graph database D and a query graph q, the aim is to find all data graphs in D that contain (i.e., exact or isomorphic search) or “nearly” contains (i.e., similarity search) q. The vast majority of these efforts have focused on “lookup” retrieval with the assumption that users have clear intent and sufficient knowledge of D to accurately specify their search goal in the form of a connected query graph. Exploratory search represents a class of search activities that go beyond such lookup retrieval and typically involves users who may not be familiar with the underlying data in a specific domain [7]. As the underlying data space is unfamiliar to the user, the query formulation evolves iteratively or progressively as the user becomes more familiar with the
This work is licensed under the Creative Commons AttributionNonCommercial-NoDerivatives 4.0 International License. To view a copy of this license, visit http://creativecommons.org/licenses/by-nc-nd/4.0/. For any use beyond those covered by this license, obtain permission by emailing
[email protected]. Proceedings of the VLDB Endowment, Vol. 10, No. 12 Copyright 2017 VLDB Endowment 2150-8097/17/08.
content. Hence, exploratory search activities have no predetermined goals and are considered as open-ended [7]. For instance, due to the topological complexity of data graphs, end users may not possess precise knowledge of the subgraph structures in D. Also, they may not always have a clear search intent leading to difficulty in formulating precise query graphs. Consequently, support for exploratory search on graph data is paramount. In recent years, exploratory search in general has received much attention in information retrieval and database fields [1, 3]. Specifically, in database research, the majority of efforts have focused on building search and exploration frameworks for structured data (e.g., relational) [3]. However, scant attention has been paid to build such a framework on graphstructured data. Particularly, exploratory search on a graph database must confront the following challenges: ways to formulate, reformulate, and process the query graph where multiple and iterative (i.e., progressive) query formulation is necessary; cues to guide users to learn about the underlying graph data and identify possible search directions beyond the starting point specified by the initial query graph. In this demonstration, we present an exploratory substructure search engine called picasso (ProgressIve Connected SubgrAph Substructure Search TOol), which exhibits the following innovative features. First, it provides a user-friendly visual interface to formulate query graphs iteratively and a query processing engine to efficiently evaluate each reformulation incrementally. Second, it generates a multi-stream results exploration wall where the results of the initial and reformulated query graphs are juxtaposed in the form of parallel search streams (i.e., parallel query-results pairs) that facilitates exploration of the underlying data and possible identification of new search directions. Third, it provides a framework to further search and analyze various features of the search results during the exploration process to facilitate understanding of the data.
2.
SYSTEM OVERVIEW
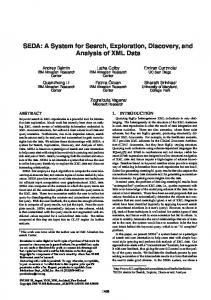
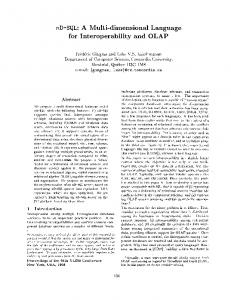
Figure 1 shows the system architecture of picasso and mainly consists of the following modules. The Visual Query Editor module. Figure 2 depicts the screenshot of a progressive substructure search (a.k.a subgraph query) interface of picasso. It consists of four panels. Panel 1 enables us to load a new graph dataset to query, build indexes, trigger iterative formulation and processing of a new query, visualize query results, set various parameters (e.g., minimum support threshold, subgraph distance threshold), and invoke similarity search when no iso-
1861
Load Manager
Graph Database
Resu lts
Visual Query Editor Qu ery
GUI
Progressive Query Processor
Index Constructor
Indices
User
Results Exploration Wall Actions
Multi-stream Results Viewer Exploration History Analyzer
Results Statistics Generator
Figure 1: Architecture of PICASSO. morphic matches to a subgraph query can be found. Panel 2 comprises of two subpanels. The top subpanel lists the graph data stores that are currently available. Upon selecting a specific dataset (e.g., the aids dataset), the bottom part of Panel 2 displays the unique labels of nodes that appear in it. Panel 4 displays the set of canned patterns, grouped according to their size, which can be utilized to formulate a query graph. Panel 3 depicts the area for progressively formulating visual queries. During the query formulation process, a user may choose a label from Panel 2 or a canned pattern from Panel 4 for creating a node or a subgraph, respectively, in the query graph by dragging and dropping it in Panel 3. An edge between two nodes in a query graph can be created by left and right clicking on a pair of nodes. Particularly, this module enables a user to construct a connected query graph in Panel 3, reformulate it iteratively, and execute it multiple times by clicking the "Run" icon in Panel 1. The Load Manager module. This module enables us to store all relevant information related to a data graph store such as the ids of the data graphs, edge relations, node labels of each data graph, and precomputed unique labels in the data graph store [5]. When a user selects a data store to query, it populates Panel 2 with appropriate information. The Index Constructor module. The goal of this module is to build indexes of the underlying graph database offline to support exploratory visual subgraph search. Specifically, the indexing framework should support efficient evaluation of a partially formulated query graph as well as leverage the result matches of former queries to generate results of the current reformulated query on demand (i.e., whenever a user clicks the "Run" icon). To this end, it implements the action-aware indexing framework of prague [5] to support such search paradigm. It first mines frequent fragments 1 from the graph database D using an existing frequent graph mining technique (the current version uses gSpan). Given a fragment g which is a subgraph of G and G ∈ D, we refer to G as the fragment support graph (fsg) of g. Since each data graph in D has a unique identifier, f sgIds(g) denotes the set of identifiers of fsgs of g. A fragment g is frequent in D if its support is no less than α|D| where 0 < α < 1 is the minimum support threshold. Otherwise, g is an infrequent fragment. Specifically, it finds discriminative infrequent fragment (dif) [5], which is a smallest infrequent subgraph of an infrequent fragment. Note that if one of the subgraphs of g is a dif, then g is infrequent [5]. Next, it generates action-aware frequent index (a2 f) and action-aware infrequent index (a2 i) to index frequent subgraphs and difs, respectively. The a2 f index is a graph1
We use the term fragment (resp. query fragment) to refer to a small subgraph existing in a graph database (resp. query graph).
Figure 2: GUI of PICASSO. structured index that enables efficient retrieval of fsg identifiers of a given frequent fragment. The a2 i-index is an array of difs and associated information. It facilitates pruning of the candidate space for infrequent queries. Progressive Query Processor module. This module extends the visual subgraph query processing technique of prague [5] to support exploratory subgraph search. Specifically, prague utilizes the latency offered by the gui actions to retrieve candidate data graphs matching a partial query fragment during visual query formulation. Note that prague assumes edge-at-a-time query formulation and hence does not support canned patterns (e.g., Panel 4 in Figure 2). Hence, we extend it to support both canned patterns as well as exploratory search. In an exploratory subgraph search, a user may iteratively reformulate and re-execute a query fragment by adding new query fragments or by deleting existing ones (an update is a sequence of deletion and insertion). When a user adds a new edge or a canned pattern p (from Panel 2 or 4) to the current query fragment q (initially empty), then the edges of p are inserted into a list eList for subsequent processing. If eList contains multiple edges, then it reorders the edges such that q will remain a connected subgraph at each step when the edges in eList are added to q in the specified order. Next, these edges are added to q and a dynamic on-the-fly index called spig set [5] is constructed. For each new edge, it retrieves identifiers of data graphs (i.e., fsg identifiers) containing the query fragment q (denoted by Rq ) and monitors its status. If q is a frequent fragment or a dif, then it retrieves f sgIds(q) by probing a2 f-index or a2 i-index, respectively. If q is a non-dif infrequent fragment, then it leverages the spig set and the action-aware indexes to generate the candidate set. This is possible as a non-dif infrequent fragment must contain at least one dif. If Rq is non-empty at a specific step then q has exact matches in D. On the other hand, if Rq becomes empty, then q has evolved into a similarity search query and candidates that approximately match q are retrieved using the spig set by identifying relevant subgraphs of q that need to be matched for retrieving candidates. Given a subgraph distance threshold (i.e., maximum number of missing edges permissible for a query graph to be “nearly” contained in a data graph), the approximate match in this framework is based on maximum connected common subgraph (mccs) [5]. In the case of deletion of an edge or a fragment during query reformulation, the spig set is updated by removing the information related to it. Then, depending on the status of the modified query fragment (i.e., frequent, dif, or non-dif infrequent), Rq is updated.
1862
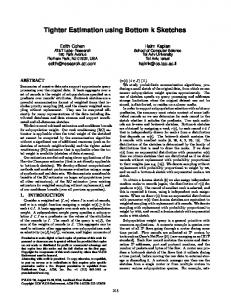
Figure 3: Multi-stream results viewer. Whenever the user clicks the Run button, the current query fragment q is processed to retrieve result matches R by leveraging Rq . If q is a frequent fragment or a dif, then the results are directly computed from Rq without performing subgraph isomorphism test. If it is a non-dif infrequent exact query fragment, then the exact results are computed by filtering the false candidates using VF2. Otherwise, if q has evolved to a subgraph similarity query then it generates the result set from the candidates by extending VF2 to handle mccs-based similarity verification [5]. Since in an exploratory search a query may be executed several times, for each run the (q, R) pair is stored to generate a search stream. The candidate set Rq is also incrementally utilized to generate candidates using the aforementioned strategy whenever q is reformulated during the search process. Observe that the expensive candidate verification step is performed only after the Run button is clicked. Consequently, Rq can be constructed efficiently throughout the search process by utilizing the gui latency and indexes. Results Exploration Wall module. This module generates a results exploration wall to view and analyze former and current results during an exploratory search in a userfriendly manner. It consists of the following submodules. The Multi-stream Results Viewer submodule. To foster iterative query reformulation, we introduce the notion of search streams, which is an interactive structure for viewing the query graphs and related results. Figure 3 shows an example of the multi-stream results view to enable viewing results in the form of parallel multiple search streams. Each search stream is divided into two areas: the query graph view at the bottom and the results view on top. Each execution of a query graph fragment creates an instance of the query graph view and results view. Specifically, Figure 3 shows a scenario where the query graph was iteratively formulated and executed three times: (1) after dragging the shaded pattern in Figure 2 (Pattern 0 ) on to Panel 3 and adding the edge 6, (2) after deleting the edge 6 from the query fragment, and (3) after adding edge 7. Hence, there are three parallel search streams. Each result data graph in a stream displays an exact or similar match to the corresponding query graph by highlighting a matching subgraph with different colored nodes and edges. The user can browse through results in each stream by clicking on the Prev or Next button at the top. She may also browse a specific result data graph by selecting its GraphId using the drop-down menu. Note that in the current instantiation (Figure 3), the query fragments at timestamps 1 and 2 have exact matches in the database.
However, the reformulated query fragment at timestamp 3 does not have any exact match and hence similarity search is invoked. Consequently, in the rightmost stream the results are ranked based on the number of missing edges in ascending order. The number of missing edges and their details are displayed in each data graph and the query fragment. For example, in Figure 3, edges 4 and 7 in the query (highlighted in red) are missing in the above data graph. For visual clarity, picasso shows one representative matching subgraph in each data graph. If one wishes to see all matches in a data graph, she may simply click on the AllMatch button to view them. Each match is shown separately in the data graph by scrolling the results view panel of a stream vertically. For example, consider the search stream at timestamp 2 in Figure 3. There are four isomorphic subgraphs to the query graph in the data graph (id 76). We can retrieve all of them by clicking on the AllMatch button. The Exploration History Analyzer submodule. This submodule is invoked when the "Exploration history" item is chosen from the drop down menu of Analysis in the menu bar of Figure 3. It enables us to gain insights of the results space by further searching it to track data graphs in the search streams of an exploratory search. Figure 4 depicts an instantiation of the analyzer. Currently, it supports two binary operators, namely "In" and "Not In". The former retrieves data graphs that appear in both input search streams (identified by timestamp) whereas the latter retrieves those that exist in the left operand search stream but not in the right operand. For instance, in Figure 4, results that are in timestamp 2 but not in 1 are retrieved. There are 3094 data graphs in the results that satisfy this condition. One of them (graph 76) is shown in Figure 4. Consequently, this feature enables a user to keep track of data graphs that appear or do not appear in the results of a reformulated query graph and choose her search direction accordingly. The Results Statistics Generator submodule. Results in different search streams may have different topological and statistical properties. This submodule aids a user to view and compare them. For instance, it shows the number of results in each search stream and type of matches (exact vs similar) using a bar chart. Figure 5 (left) depicts an example for the three search streams in Figure 3. Clicking on a bar of a search stream enables us to view the size distribution of the data graphs in it. Figure 5 (right) shows the size distribution when the first bar (stream at timestamp 1 ) is clicked. This module also supports comparison of these statistics across different search streams. It also visually
1863
Figure 4: Exploration history analyzer. displays several topological properties of the data graphs in a search stream (e.g., average degree, k-core, label distribution) and how they evolve with every reformulation of a query. In summary, the Results Exploration Wall module facilitates users to formulate queries toward their search goals. Specifically, search streams foster to explore the underlying data without fear of losing current work. It allows users to keep track of former query fragments, revisit them if necessary, while branching out to reformulate them to reach their search goals. Furthermore, features to support results comparison can potentially facilitate quick instantiation of new queries and query reformulation.
3.
RELATED SYSTEMS AND NOVELTY
There has been considerable work on exact and approximate subgraph query processing on a collection of small or medium-sized data graphs [6] and large networks [2]. Also, several research prototypes on subgraph search have been recently demonstrated in data management venues (e.g., [4]). However, these efforts do not focus on exploratory search and multi-stream exploration of query results. Recently, an exploratory querying framework on knowledge graphs (i.e., rdf graphs) has been demonstrated in [8]. It focuses on automatic query relaxation, query suggestions, and explanation of answers. In contrast, picasso is designed for a large collection of data graphs (e.g., chemical compounds) and focuses on multi-stream exploration of query results. Hence, picasso is complimentary to this effort. More germane to this work is our effort in [4] where we demonstrate the blending of visual subgraph query formulation and processing. In particular, the final query graph was executed once in contrast to iterative query reformulation and execution during an exploratory search. Furthermore, it does not support multi-stream results exploration framework as it is not designed for exploratory search.
4.
Figure 5: Results statistics. possible search directions by exploring query results iteratively in real-time. Through the Visual Query Editor, the audience can gain such experience by exploring the underlying data graphs through iterative refinement of a subgraph query, generating results of a query fragment in real time by leveraging the Progressive Query Processor module, and multi-stream results exploration and analysis by utilizing the Results Exploration Wall. Specifically, the Results Exploration Wall module facilitates gaining rich experience in viewing query results of incremental exploration with its multi-stream configuration and performing various analysis on different search streams for sense-making and determining possible search directions. Acknowledgement. Kai Huang and Sourav S Bhowmick are supported by the Singapore-MOE AcRF Tier-2 Grant MOE2015-T2-1-040. Shuigeng Zhou is funded by the Key Projects of Fundamental Research Program of Shanghai Municipal Commission of Science and Technology under grant No. 14JC1400300. Byron Choi is supported by HKRGC GRF 12201315 and 12232716.
5.
DEMONSTRATION OBJECTIVES
picasso is implemented in Java JDK 1.8. Our demonstration will be loaded with a few synthetic and real datasets (e.g., aids, eMolecules 2 ) with different sizes (up to 1.3 million data graphs). Example initial query graphs will be presented for exploratory search. Users can also formulate their own search through our gui. The key objective of the demonstration is to enable the audience to interactively experience multiple reformulation of the initial subgraph query in a progressive manner to learn about the underlying information space and identify 2
REFERENCES
[1] J. Ahn, P. Brusilovsky. Adaptive Visualization for Exploratory Information Retrieval. Info. Proc. & Man. 49, 5, 2013. [2] F. Bi, et al. Efficient Subgraph Matching by Postponing Cartesian Products. In SIGMOD, 2016. [3] S. Idreos, O. Papaemmanouil, S. Chaudhuri. Overview of Data Exploration Techniques. In SIGMOD, 2015. [4] C. Jin, S. S. Bhowmick, X. Xiao, B. Choi, S. Zhou. Gblender: Visual Subgraph Query Formulation Meets Query Processing. In ACM SIGMOD, 2011. [5] C. Jin, S. S. Bhowmick, B. Choi, S. Zhou. prague: A practical framework for blending visual subgraph query formulation and query processing. In In ICDE, 2012. [6] F. Katsarou, N. Ntarmos, P. Triantafillou. Performance and Scalability of Indexed Subgraph Query Processing Methods. In PVLDB, 8(12), 2015. [7] R. W. White, R. A. Roth. Exploratory Search: Beyond the Query-response Paradigm. Synth. Lec. on Inf. Conc., Retr., and Serv. 1, 1, 2009. [8] M. Yahya, K. Berberich, M. Ramanath, G. Weikum. Exploratory Querying of Extended Knowledge Graphs. In PVLDB, 9(13), 2016.
www.emolecules.com/info/plus/download-database
1864