in FOCus. 11 education policy education policy education policy education policy
education ... were assessed by PISA or who have at least one parent who.
PISA 11
in Focus
education policy education policy education policy education policy education policy education policy education policy
How are school systems adapting to increasing numbers of immigrant students? • On average among OECD countries, the percentage of students with an immigrant background grew by two percentage points between 2000 and 2009.
• Immigrant students represent more than 5% of the student population in 13 OECD and partner countries and economies that participated in PISA 2009.
• In most countries, immigrant students lag behind native students in performance; in many countries, the difference is considerable. However, Australia, Belgium, Canada, Germany, New Zealand and Switzerland have been able to narrow, and in some cases close, this performance gap.
Whether in flight from conflict, with the hope of building a better life, or to seize a social or economic opportunity, people have been crossing borders for as long as there have been borders to cross. Modern means of transportation and communication, the globalisation of the labour market, and the ageing of populations in OECD countries will drive migration well into the next decades. The key to maintaining social cohesion during these population movements is to integrate immigrants and their families well into their adopted countries; and education can be a powerful lever to achieve this.
Native students are those born in the country in which they were assessed by PISA or who have at least one parent who was born in that country. Immigrant students are those with an immigrant background, and they can be either first-generation (those who are foreign-born and whose parents are also foreign-born) or second-generation (those who were born in the country of assessment but whose parents are foreign-born).
PISA IN FOCUS 2011/11 (December) – © OECD 2011
1
PISA in Focus
Percentage of students with an immigrant background in 2000 and 2009 2009
2000 Percentage of students with an immigrant background
45 40 35 30 25 20 15 10 5
Hong Kong-China Liechtenstein New Zealand Canada Switzerland Australia Israel United States Germany Belgium France Russian Federation Sweden Spain Greece Denmark Ireland Norway Italy Portugal Latvia Argentina Finland Iceland Czech Republic Hungary Mexico Brazil Albania Bulgaria Chile Peru Romania Japan Indonesia Poland
– + + + + o – + o o o + o + + + + + + + – o + + + o – + o o o o o o o –
0
2009 higher than 2000
2009 lower than 2000
No statistically significant difference
+
–
o
Change in the percentage of students with an immigrant background between 2000 and 2009
95% confidence level
Countries are ranked in descending order of percentage of students with an immigrant background in 2009. Source: OECD, PISA 2009 Database. Table V.4.4 (1 2 http://dx.doi.org/10.1787/888932382235). Figure V.4.6 (1 2 http://dx.doi.org/10.1787/888932360005).
The proportion of immigrant students continues to grow… Based on information gathered from questionnaires distributed with the PISA 2009 assessment, the percentage of 15-year-old students with an immigrant background grew by two percentage points, on average, between 2000 and 2009 among OECD countries with comparable data. Immigrant students now constitute more than 5% of the 15-year-old student populations in 13 OECD and partner countries and economies. In Ireland, New Zealand, Spain, the United States, and the partner countries Liechtenstein and the Russian Federation, the percentage of students with an immigrant background increased by five percentage points or more over the past decade, and these students now represent from 8% to 30% of these countries’ student populations. In Italy, Greece and Canada, the percentage of students with an immigrant background increased by three to five percentage points over the same period. Nearly 25% of Canada’s student population has an immigrant background.
2
PISA IN FOCUS 2011/11 (December) – © OECD 2011
…but in some countries, the performance gap is shrinking. Why do these numbers matter for education policy? Because PISA results in 2000 and 2009 show that although native students tend to outperform their immigrant peers by an average of more than 40 score points, some countries have been able to narrow that gap considerably. For example, in Belgium and Switzerland, the performance gap narrowed by nearly 40 score points during that period, even though native students still outperform students with an immigrant background by 68 score points in Belgium and by 48 score points in Switzerland. And Switzerland has been able to reduce the performance gap despite the fact that the percentage of students with an immigrant background rose during the period. Germany, New Zealand and the partner country Liechtenstein also show a narrowing of the performance gap between these two groups of students.
PISA in Focus
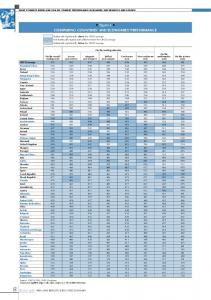
Reading performance by immigrant status, before and after accounting % of students in PISA 2009 for socio-economic background
with an immigrant background (1st or 2nd generation)
Qatar Dubai (UAE) Kyrgyzstan Serbia Israel Macao-China Kazakhstan Australia Hungary United States Hong Kong-China Jordan Montenegro Azerbaijan Canada Trinidad and Tobago Singapore Croatia Latvia New Zealand Netherlands United Kingdom Argentina Czech Republic Liechtenstein Luxembourg Russian Federation Lithuania Slovenia Portugal OECD average Germany Switzerland France Norway Ireland Estonia Panama Greece Denmark Austria Sweden Belgium Spain Italy Finland Iceland Colombia Mexico Brazil
Before accounting for socio-economic background After accounting for socio-economic background
Some school systems are successful at minimising performance differences across students, regardless of their immigrant backgrounds. For example, in Australia, students with an immigrant background perform better than native students. In Canada, immigrant students performed as well as native students in 2009, and they represent a large – and growing – proportion of the student population.
46 71 2 9 20 70 12 23 2 19 39 14 7 3 24 2 14 11 4 25 12 11 4 2 30 40 12 2 8 5 10 18 24 13 7 8 8 4 9 9 15 12 15 9 6 3 2 0 2 1
Students WITH an immigrant background perform better
Students WITHOUT an immigrant background perform better
Socio-economic background explains only part of the performance gap. What these trends tell us is that there are ways that governments and schools can help students from immigrant backgrounds to overcome some of the disadvantages associated with that background. Often, students with an immigrant background are socio-economically disadvantaged. On average across OECD countries, the parents of these students are less educated and work in lower-status occupations than their native peers. In addition, these students tend to have access to fewer educational and material resources at home than their native peers. So, for example, if the socio-economic status of students in Luxembourg is taken into account, the performance gap between immigrant and native students there narrows from 52 to 19 score points. On average across OECD countries, the gap is reduced from 43 to 27 score points when comparing students of similar socio-economic status, regardless of whether they are from immigrant backgrounds or are native to the country in which they were tested.
-120
-80
-40
0
40
80
120
Score point difference
But the fact that a performance gap equivalent to well over half a school year persists, even after accounting for socio-economic status, implies that other factors also have an impact on student performance. To some extent, these may be related to where the students were born – for example, whether they are secondor first-generation immigrants – or whether, when they’re at home, they speak the same language as that used in the PISA test.
Note: Score point differences that are statistically significant are shown in a darker tone. Countries are ranked in ascending order of score point differences after accounting for the economic, social and cultural status of students. Source: OECD, PISA 2009 Database. Table II.4.1 (1 2 http://dx.doi.org/10.1787/888932381418). Figure II.4.5 (1 2 http://dx.doi.org/10.1787/888932343608).
PISA IN FOCUS 2011/11 (December) – © OECD 2011
PISA in Focus
Immigrant students and reading performance in 2000 and 2009 2000
2009 Score point difference
120 100 Students WITHOUT an immigrant background perform better
80 60 40 20 0
2009 lower than 2000
No statistically significant difference
+
–
o
Italy +
Mexico o
Finland o
Sweden o
Belgium –
Denmark o
Spain o
2009 higher than 2000
France o
Greece o
Norway o
Argentina o
Switzerland –
Ireland +
Liechtenstein –
Portugal o
Russian Federation o
United States o
Czech Republic o
Latvia o
New Zealand –
Canada o
Israel o
Hong Kong-China o
Hungary o
Australia –
-40
Germany –
Students WITH an immigrant background perform better
-20
Change in the performance difference between students without and those with an immigrant background between 2000 and 2009
95% confidence level
Note: Statistically significant score point differences are marked in a darker tone. Countries are ranked in ascending order of the performance difference between students without and those with an immigrant background in 2009. Source: OECD, PISA 2009 Database. Table V.4.4 (1 2 http://dx.doi.org/10.1787/888932382235). Figure V.4.7 (1 2 http://dx.doi.org/10.1787/888932360005).
Yet given that the performance gap varies so widely across countries, even taking into account these other characteristics, and given that in some countries the performance gap has changed markedly over time, it is clear that public policy can make a difference. For example, effective language education is key: students who do not understand their teachers will not be able to learn from them.
The bottom line: School systems can nurture immigrant students’ full social and economic integration into their adopted country by identifying the obstacles to high performance that are particular to immigrant students and developing programmes that are tailored to meet these students’ needs. For more information Contact Maciej Jakubowski (
[email protected]) See PISA 2009 Results: Overcoming Social Background: Equity in Learning Opportunities and Outcomes (Volume II) and PISA 2009 Results: Learning Trends: Changes in Student Performance Since 2000 (Volume V) Visit www.pisa.oecd.org www.oecd.org/pisa/infocus
4
PISA IN FOCUS 2011/11 (December) – © OECD 2011
Coming next month
Are boys and girls ready for the digital age?