May 11, 1996 - Natural Killer Cells (Pit Cells) in Rat Liver. DIANZHONG .... zymosan (Sigma Chemical Co., St. Louis, MO) at a dose of 20 mg/kg via the penile ...
The Role of Adhesion Molecules in the Recruitment of Hepatic Natural Killer Cells (Pit Cells) in Rat Liver DIANZHONG LUO,1 KARIN VANDERKERKEN,1 LUC BOUWENS,2 PETER J. K. KUPPEN,3 MARIJKE BAEKELAND,1 CARINE SEYNAEVE,1 AND EDDIE WISSE1
Previous studies showed that blood large granular lymphocytes (LGL), which possess natural killer (NK) activity, develop within rat liver sinusoids into highdensity (HD) and subsequently into low-density (LD) pit cells which show an increasing level and spectrum of tumor cytotoxicity. In this study, we investigated the role of adhesion molecules, such as CD2, CD11a, CD18, and CD54 in the recruitment of pit cells to the liver. Immunostaining for electron microscopy, and two color flow cytometry showed that most pit cells expressed CD2, CD11a, CD18, and CD54. After intravenous injections into rats with anti-CD2, anti-CD11a, and anti-CD18 antibodies, the number of pit cells per square millimeter in frozen sections of liver tissue decreased. Treatment of rats with zymosan increased the number of pit cells fivefold, whereas subsequent treatment with anti-adhesion-molecule antibodies resulted in approximately 60% lower number of pit cells. Anti-CD54, supposed to block CD54 expression on sinusoidal endothelial cells, also decreased the number of pit cells. The number of blood LGL was, however, not affected by these antibodies. These results indicate that blocking of CD2, CD11a, CD18, and CD54 antigens on blood LGL and/or liver endothelium decreased the number of pit cells in the liver. These adhesion molecules therefore play an important role in the recruitment of pit cells in the liver. (HEPATOLOGY 1996;24:1475-1480.) Pit cells are a unique population of cells occurring in rat liver sinusoids,1 and can be considered as natural killer (NK) cells2,3 with large granular lymphocyte (LGL) morphology.4 Previous studies have shown that pit cells originate from blood LGL that first differentiate into liver high-density (HD) and subsequently into low-density (LD) pit cells (hepatic NK cells), which show an increasing level and spectrum of tumor cytotoxicity.5,6,7 The initial stage in the recruitment of LGL from the vascular compartment into the liver is adhesion to sinusoidal endothelial cells. It has been shown that attachment and recruitment of cells is regulated by cell adhesion
Abbreviations: NK, natural killer; LGL, large granular lymphocyte; HD, high density; LD, low density; CAM, cell adhesion molecule; LFA-1, leukocyte function associated molecule-1; PBS, phosphate-buffered saline; Mabs, monoclonal antibodies; IgG, immunoglobulin G; FACS, fluorescent activated cell sorter. From the Laboratory for Cell Biology and Histology, 1Department of Hematology and Immunology, 2Laboratory of Experimental Pathology, Free University of Brussels (VUB), Brussels-Jette, Belgium; and 3Department of Surgery and Pathology, University of Leiden, Leiden, The Netherlands. Received March 31, 1995; accepted July 31, 1996. Supported by the Belgian National Fund for Scientific Research, grants No. 3005392 and 3005095 and the Research Council (OZR) of the Free University of Brussels (VUB), grants No. 1953371310 and 1953220160, Brussels, Belgium. Address reprint requests to: Prof. Dr. E. Wisse, Laboratory for Cell Biology and Histology, Free University of Brussels (VUB), Laarbeeklaan 103, B-1090 Brussels, Belgium. Copyright q 1996 by the American Association for the Study of Liver Diseases. 0270-9139/96/2406-0029$3.00/0
molecules (CAMs), which mediate cell-to-cell and cell-to-matrix interactions.8 In humans, several CAMs, such as CD11a/ CD18 (leukocyte function associated molecule-1 [LFA-1]), CD2 (LFA-2), CD54 (intercellular adhesion molecule-1), CD56 (neural cell adhesion molecule), CD58 (LFA-3), have been reported to occur on the surface of NK cells.9 CD2 has been reported to be involved in the adhesion of NK cells.9 CD11a/CD18 has been identified as the main adhesion structure involved in NK to endothelial cell interaction.10,11 By flow cytometry, the percentages of cells positively reacting for CD11a, CD18, CD2, and CD54 in human liver-associated lymphocytes are described to be 97%, 95%, 76%, and 55%, respectively.12 However, this cell population included T and B lymphocytes, besides hepatic NK cells. Little is known about the expression of CAMs on pit cells and the role of these molecules in the recruitment of these cells to the liver. The aim of this study was to determine the expression of CAMs on pit cells and to explore which CAMs are required for the recruitment of pit cells in the liver. MATERIALS AND METHODS Animals. Male specific pathogen-free Wistar rats (Proefdierencen-
trum, Leuven, Belgium) weighing 260-280g were used at an age between 8 to 12 weeks. The rats had free access to tap water and food. The rats were killed by rapid exsanguination while under ether anaesthesia. The protocols were in compliance with the guidelines of the European Community (No. L358, 18-12-1986). Isolation of Pit Cells. Hepatic LGL (pit cells) were isolated using the method of Bouwens et al.2 Briefly, the cells were washed out of the liver by perfusion through the portal vein with 300 mL of phosphatebuffered saline (PBS) supplemented with 0.1% ethylenediaminetetraacetic acid, at a pressure of 50 cm H2O, and the perfusate was collected through cannulation of the inferior vena cava. The erythrocytes and granulocytes were removed by Ficoll-Paque (Pharmacia AB, Uppsala, Sweden) gradient centrifugation (450g for 20 minutes). This procedure was followed by nylon-wool (Wako Chemicals, Neuss, Germany) adherence to remove B lymphocytes and monocytes. The hepatic LGL population was then separated by density gradient centrifugation on 45% isosmotic Percoll (Pharmacia AB) (500g for 25 minutes). HD cells were collected in the pellet, whereas LD cells were floating on top of the gradient. Blood LGL were isolated from blood drawn from the abdominal aorta. The same purification procedure was applied, starting with Ficoll-Paque gradient centrifugation and followed by nylon-wool adherence. LGL from peripheral blood were further enriched on a 50% iso-osmotic Percoll gradient (500g for 25 minutes). All LGL were floating on top of this gradient. Antibodies. The following mouse anti-rat monoclonal antibodies (MAbs) were used: WT1 (anti-CD11a, immunoglobulin G2a [IgG2a]), WT3 (anti-CD18, IgG1),13 and 1A29 (anti-CD54, IgG1)14 were a gift from Dr. Miyasaka (Tokyo Metropolian Inst. Med. Science, Tokyo, Japan). 3.2.3 (anti-NKR-Pl, IgG2b)15 was a gift from Dr. Chambers (Pittsburgh Cancer Institute, Pittsburgh, PA). OX34 (anti-CD2, IgG2a) and OX8 (anti-CD8, IgG1) were purchased from ECACC (Porton Down, Salisbury, UK). The peroxidase-labelled anti-mouse IgG was purchased from Amersham (Little Chalfont, Buckinghamshire, UK). The fluorescein-conjugated antimouse IgG1 and IgG2a, biotinconjugated antimouse IgG2b, and streptavidin R-phycoerythrin conjugates were purchased from Rockland (Gilbertsville, PA). Anti-CD2, anti-CD11a, anti-CD18, and anti-CD54 antibodies were used to as-
1475
AID
Hepa 0006
/
5p19$$$101
11-05-96 17:31:15
hpta
WBS: Hepatology
1476
LUO ET AL.
HEPATOLOGY December 1996
sess the expression of CAMs on pit cells (LGL). MAb 3.2.3, a specific marker of rat NK cells and pit cells,15,16 was used to stain pit cells. Treatment of Rats In Vivo. Rats (n Å 3 for each group) were injected intravenously with the different antibodies (anti-CD2, antiCD11a, anti-CD18, anti-CD54, and anti-CD8). For each antibody, two different intravenous doses were applied; one group received 50 mg/kg and another (n Å 3) received 1 mg/kg on day 0 and day 5. Control animals received injections of 50 mg/kg and 1 mg/kg purified, irrelevant nonimmune mouse IgG1 antibody. To accurately assess the recruitment of pit cells in the liver, the rats were killed 10 days later, which let preexisting pit cells naturally disappear because the life span of pit cells in rat liver is about 2 weeks.6 The samples of blood and liver were collected. The method for isolation of lymphocytes from the blood was the same as described above. The blood lymphocytes were used to count the number of 3.2.3-positive cells and the expression of CAMs. To count the number of pit cells in liver tissue, livers were perfused through the portal vein by a peristaltic pump at a constant rate of 10 mL per minute with Gey’s balanced salt solution (pH 7.4), until the liver became pale. Two tissue blocks from the lobus sinister lateralis and pars infraportalis were cut and frozen in liquid nitrogen and stored at 0707C. Frozen tissue sections (5 mm) were prepared and stained with MAb 3.2.3 to localize and count the number of pit cells in situ. To determine the recruitment of pit cells during immunostimulation by biological response modifiers,17 normally enhancing the number of pit cells fivefold, Wistar rats were injected intravenously with zymosan (Sigma Chemical Co., St. Louis, MO) at a dose of 20 mg/kg via the penile vein under light ether anaesthesia.17 At the time of zymosan injection, the same antibodies at the dosage of 50 mg/kg were injected (n Å 3 for each group) as in unstimulated rats. These injections of antibodies were repeated 3 days later. Control animals (n Å 3) treated with zymosan received injections of 50 mg/kg purified irrelevant nonimmune mouse IgG1 antibody. Because the maximum number of pit cells appears on the fifth day after zymosan injection,17 the rats were killed 5 days later and treated as described above. Immunostaining for Light Microscopy. Frozen sections were airdried and fixed in 4% paraformaldehyde (pH 7.4) for 20 minutes. Endogenous peroxidase activity was blocked for 20 minutes in methanol containing 0.3% H2O2 . After an incubation for 30 minutes with normal goat serum to prevent nonspecific binding of the antibody, the sections were incubated overnight in 100 mL of undiluted primary antibody at 47C. Normal mouse IgG and PBS were used as negative controls. Then, the sections were incubated in 1/50 diluted peroxidase-labelled anti-mouse IgG (Amersham) for 30 minutes and stained using 3.3*-diaminobezidine tetrahydrochloride with 0.1% H2O2 . The sections were counterstained with hematoxylin.
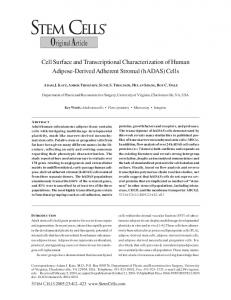
FIG. 1. Immunoelectron micrograph of a CD18-positive LGL in an isolated hepatic HD pit cell fraction. The reaction product is located on the cell surface (arrow). (Original magnification 15,200.)
AID
Hepa 0006
/
5P19$$$102
11-05-96 17:31:15
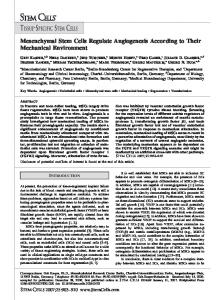
FIG. 2. Expression of CD2, CD18, and CD54 per 100 LGL in LD and HD pit cell fractions of rat liver and in the peripheral blood LGL fraction. LGL fractions were recognized and counted in the transmission electron microscope. Values were percentages { SE of three rats in each group.
Immunoperoxidase Staining of Isolated Cells for Electron Microscopy. The applied staining procedure has been described earlier.4
Briefly, the isolated cells (10-15 1 106 cells) were prefixed for 5 minutes in cold 1% distilled glutaraldehyde in .1 mol/L cacodylate buffer, pH 7.4, supplemented with 0.5% guanidinium hydrochloride. To avoid aspecific binding of the antibodies, the cells were washed once during 20 minutes in 1.5% guanidinium hydrochloride in water at room temperature. After washing twice in PBS with 0.5% bovine serum albumin, the cells were resuspended in undiluted various primary antibodies and incubated at room temperature for 2 hours with continuous shaking. The cells were then incubated in peroxidase labelled anti-mouse IgG (Amersham), diluted 1/50, during 1 hour at room temperature with continuous shaking. The cells were subsequently incubated for 15 minutes in 0.075% 3.3*-diaminobezidine tetrahydrochloride and .01% H2O2 in 0.14 mol/L cacodylate buffer, pH 7.4, at room temperature. The cells were then resuspended in 1.5% glutaraldehyde in .14 mol/L cacodylate buffer and spun down in small Eppendorf tubes (Merck Belgolabo, Brussels, Belgium) in a microfuge (4 minutes at approximately 9,000g). The pellets were postfixed during 15 minutes in the same glutaraldehyde fixative and subsequently for 1 hour in 1% buffered osmium tetroxide. Pellets were dehydrated in a graded ethanol series, and embedded in Epon (Fuka, Bornem, Belgium). Preparations with omitted primary antibody or substituted normal mouse IgG for the primary antibody served as controls. Flow Cytometry. The isolated pit cell and blood lymphocyte fractions were adjusted to a concentration of 0.5 1 106 cells per mL in fluorescent activated cell storer (FACS) buffer consisting of PBS with 1% bovine serum albumin and 0.02% NaN3 . The cells were incubated for 30 minutes at 47C in 100 mL of saturating primary antibodies, WT1 (IgG2a), WT3 (IgG1), 1A29 (IgG1), OX34 (IgG2a), or 3.2.3 (IgG2b). Then, the cells were washed twice with FACS buffer, resuspended, and incubated in 100 mL of saturating fluorescein-conjugated antimouse -IgG1 or -IgG2a and biotin-conjugated IgG2b. After 30 minutes incubation at 47C, the cells were washed twice with FACS buffer and incubated in 100 mL of streptavidin R-phycoerythrin conjugate for 30 minutes at 47C. The stained cells were fixed in FACS buffer containing 2% paraformaldehyde and analyzed within 2 days. All two-color staining experiments included the following controls: (1) unstained cells; (2) staining with second stage reagents alone, to establish the background; and (3) staining omitting only one or other of the two MAbs, to check that each parameter remained the same in two-color analysis as in one-color analysis, and thus that the reagents did not cross-bind or interact. The phenotypic analysis was performed with a FACScan (Becton Dickinson). Dead cells were gated out by forward and side light scatters. Quantitation and Statistics. For the phenotypic analysis in electron microscopy, 100 LGL were, at least, counted for each sample and one sample per rat, whereas a total of three rats for each group was observed. In liver sections, the number of 3.2.3 positive cells
hpta
WBS: Hepatology
HEPATOLOGY Vol. 24, No. 6, 1996
LUO ET AL.
1477
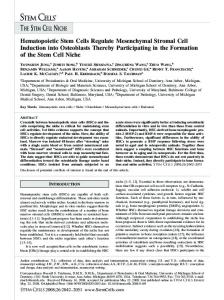
FIG. 3. Expression of CD2, CD11a, CD18, and CD54 on hepatic NK cells (pit cells) and blood NK cells. Cells were stained with 3.2.3 antibody (phycoerythrin) and anti-CAMs (fluorescein) and analyzed by two-color flow cytometry. (A) Two-color flow cytometry profiles are given for nature killer related-protein 1 (NKR-P1) and CAMs on hepatic NK cells and blood NK cells. CAMs are expressed on the x-axis (fluorescein), NKR-P1 on the y-axis (phycoerythrin). (B) CAM expression on hepatic NK cells and blood NK cells. Values are percentages of 3.2.3-positive cells { SE of three rats in each group. , hepatic NK cells; j, blood NK cells.
was determined using a Zeiss Photomicroscope III (Gescha¨ftsbereich Mikroskopie, Oberkochen, Germany) and a 401 objective. The area of the examined tissue was measured by a light microscope equipped with a video camera, connected to a Macintosh Quadra 700 computer (Apple Computer, Inc., Cupertino, CA) using NIH Image 1.41 software (Automatix, Billerica, MA). At least 4 mm2 area for each section was measured. The ANOVA and unpaired Student’s t test were used for data analysis and statistical significance was considered at the level of P õ .05. RESULTS The Expression of CD2, CD11a, CD18, and CD54 in Blood LGL and Isolated LD and HD Pit Cells. The expression of
CAMs was examined by immunoelectron microscopy. In the
AID
Hepa 0006
/
5P19$$$102
11-05-96 17:31:15
electron microscope, LGL (blood NK cells and pit cells) were easily recognized by their electron dense granules. Immunoperoxidase reaction product was uniformly located all over the cell surface (Fig. 1). After the application of anti-CD2 and anti-CD18 primary antibody, approximately 80% positive LGL were found in the blood lymphocyte and hepatic LD and HD fractions. With anti-CD54, approximation 35% of the LGL reacted positively (Fig. 2). There were no significant differences in the percentages of CD2, CD18, and CD54 positive cells among LD, HD, and blood LGL (P ú .05). Because there was no significant difference between LD and HD cells expressing CD2, CD18, CD54, and NKR-P116 in electron microscopy, the total hepatic pit cell fraction (including LD and HD cells) was used for two-color flow cytome-
hpta
WBS: Hepatology
1478
LUO ET AL.
HEPATOLOGY December 1996
FIG. 4. Effect of anti-CAMs on the recruitment of hepatic NK cells (pit cells) in normal rat liver after low dose antibody treatment (50 mg/kg). The rats were injected intravenously at day 0 and 5. The rats were killed 10 days later and the number of pit cells in the liver was assessed by light microscopy after immunostaining with MAb 3.2.3. Mean values of the number of 3.2.3positive cells { SE are given per mm2 of three rats in each group, except the untreated group which contained five rats.
try. As shown in Fig. 3, approximately 50% of 3.2.3 positive cells in hepatic pit cell fractions and blood lymphocytes were found to be CD2 positive. Approximately 90% of 3.2.3 positive cells were CD18 positive and approximately 70% of 3.2.3 positive cells were CD54 positive. There was no significant difference between 3.2.3 positive pit cells and blood NK cells in expressing CD2, CD18, and CD54 (P ú .05). However, the percentage of CD11a positive cells in pit cells (90.2% { 1.9%) was significantly higher than the percentage of CD11a positive cells in blood NK cells (54.6% { 11.9%) (P õ .05) (Fig. 3). Involvement of CD2, CD11a, CD18, and CD54 in Rat Liver Pit Cell–Recruitment In Vivo. In animals, treated with a sin-
gle low dose (50 mg/kg) of antibody and not treated with zymosan, the mean number of 3.2.3 positive cells in liver tissue was approximately five per square millimeter, which was significantly lower than the value in normal rat liver (13.7 { 1.1/mm2) and after irrelevant nonimmune IgG1 (13.6 { 1.8/ mm2) (P õ .05) (Fig. 4). There were no significant differences among the numbers of 3.2.3 positive cells in the livers of rats treated with various antibodies (P ú .05). The results of groups of rats injected with a high dose of antibodies (1 mg/kg) was similar to the low dose groups. The number of 3.2.3 positive cells in the livers of rats treated with various antibodies was approximately four per square millimeter, which was significantly lower than the values in normal rat liver (13.7 { 1.1/mm2) and IgG1-treated rat liver (13.8 { 3.2/mm2) (P õ .05) (Fig. 5). No significant difference in the number of 3.2.3-positive cells among the livers of rats treated with various antibodies was found (P ú .05). In zymosan-treated groups, the number of 3.2.3 positive cells in situ increased fivefold and 3.2.3-positive cells were diffusely spread over the liver lobule (Fig. 6). The mean number of 3.2.3-positive cells in livers of rats treated with zymosan was 63.8 { 11.1/mm2 (control 13.7 { 1.1/mm2) (P õ .05). The number of 3.2.3-positive cells in the livers of rats treated with zymosan and anti-CD2, zymosan and anti-CD18, zymosan and anti-CD2 plus anti-CD18, and zymosan with antiCD8 was much lower (range, 23.7-28.4/mm2) than that in livers of rats treated with zymosan only and zymosan with irrelevant nonimmune mouse IgG1 (59.7 { 1/mm2) (P ú .05) (Figs. 7 and 8). The number of 3.2.3-positive cells in livers of
AID
Hepa 0006
/
5P19$$$102
11-05-96 17:31:15
FIG. 5. Effect of anti-CAMs on the recruitment of hepatic NK cells (pit cells) in animals treated with high dose antibody (1 mg/kg). Rats were treated as described in Fig. 4. Mean values of 3.2.3-positive cells { SE are given per mm2 from three rats in each group.
rats treated with zymosan and with anti-CD54 (46.2 { 9.1/ mm2) was not significantly decreased (P ú .05). The numbers of 3.2.3-positive cells in the groups treated with zymosan and anti-CD2, zymosan and anti-CD18, zymosan and anti-CD2 plus anti-CD18, and zymosan and anti-CD8 groups were higher than that in the control group (P õ .05), but there were no significant differences among them. Effect of Blocking of CD2, CD8, CD11a, CD18, and CD54 In Vivo on Blood NK Cell Counts and on the Expression of CAMs on Blood NK Cells. To check the availability of blood NK cells
for homing to the liver, the number of NK cells in the blood was assessed after intravenous injection of anti-CAMs. As seen in Fig. 9, the number of blood NK cells in rats treated with anti-CD8 (63.3 { 12/mL) was much lower than that in normal rats (300 { 40.4/mL), the rats treated with IgG1 (330 { 50.3/mL) and the rats treated with anti-CAMs (approxi-
FIG. 6. Immunohistochemical staining of frozen sections with MAb 3.2.3 of a rat, 5 days after intravenous injection of zymosan. Numerous 3.2.3-positive cells (arrows) are diffusely distributed in the liver sinusoids. (Original magnification 1400.)
hpta
WBS: Hepatology
HEPATOLOGY Vol. 24, No. 6, 1996
LUO ET AL.
FIG. 7. Immunohistochemical staining with MAb 3.2.3 of frozen sections from rat liver, 5 days after intravenous injection of zymosan and anti-CD18. The number of 3.2.3-positive cells (arrows) is decreased as compared with animals treated with zymosan only. (Original magnification 1400.)
mately 250/mL) (P õ .05). There was no significant difference between normal rats and the rats treated with anti-CD2, anti-CD11a, anti-CD18, and anti-CD54 (P ú .05). To investigate whether the expression of CAMs on blood NK cells was affected by the antibody injections and to confirm that the decreased number of pit cells in the liver was not caused by lost expression of CAMs on blood NK cells after the antibody injections, two-color flow cytometry was used to analyze the expression of adhesion molecules on the blood NK cells of the rats treated with the antibodies. No significantly different changes of the CAM expression were found between the antibody-treated and -untreated rats (P ú .05) (data not shown).
FIG. 8. Effect of anti-CAMs on zymosan-induced hepatic NK cells (pit cells) accumulation. The rats were injected intravenously with zymosan, preceding the injection of antibodies. The injection of antibodies was repeated 3 days later. Five days later, the rats were killed and the number of pit cells in the liver was assessed by light microscopy after MAb 3.2.3 immunostaining. Values are the mean of the number of 3.2.3-positive cells { SE per mm2 of three rats in each group. The normal group consisted of five rats.
AID
Hepa 0006
/
5P19$$$102
11-05-96 17:31:15
1479
FIG. 9. The number of blood NK cells in anti-CAMs treated rats. The rats were treated as mentioned in Fig. 4. The blood lymphocytes were obtained by Ficoll-Paque gradient centrifugation and nylon-wool adherence. The total number of blood lymphocytes/mL was counted. The cells were stained with 3.2.3 antibody (phycoerythrin) and analyzed by flow cytometry. The absolute number of NK cells/mL was assessed by multiplying the percentages of 3.2.3positive cells and the total number of blood lymphocytes/mL. Values are the mean of 3.2.3-positive cells { SE/mL from three rats in each group.
DISCUSSION
Previous studies have shown that pit cells originate from blood LGL.5,6 The present results show that both pit cells and blood NK cells express CD2, CD11a, CD18, and CD54 adhesion molecules, whereas no significant differences were found in the percentages of expression of CD2, CD18, and CD54 between pit cells and blood NK cells, or between LD and HD pit cells. The percentage of CD11a positive hepatic pit cells was higher than that in blood NK cells, which may be an effect of staying in the liver microenviroment. In this respect, Kupffer cells play an essential role in the differentiation of peripheral blood LGL into pit cells,18 probably by secreting cytokines. Our results allow the conclusion that the adhesion molecules concerned are involved in the recruitment of pit cells in rat liver. To determine whether anti-CD2, anti-CD18, and antiCD54 affect the recruitment of pit cells in rat liver, we injected these antibodies intravenously into rats and assessed the number of pit cells in the liver, whereas one group of rats were additionally treated with a biological response modifier (zymosan). In rats injected with various anti-CAMs, the number of pit cells in the liver was lower than in control rats, indicating that CD2 and CD18 are playing a role in the normal recruitment of pit cells. It is known that biological response modifiers, including zymosan, increase the number and activity of both pit cells and Kupffer cells.17,19 The increased number of pit cells is believed to be caused by the recruitment of blood LGL in addition to local proliferation.17 The present data show that the increased number of pit cells after zymosan injection could also be partly inhibited by the injection of anti-CD2 and anti-CD18, but not by mouse nonimmune IgG. This indicates that blocking these adhesion molecules also influenced the recruitment of pit cells in stimulated conditions. The enhanced number of remaining pit cells in these animals might be the result of local proliferation of preexisting pit cells. Anti-CD54 also decreased the number of pit cells in both zymosan-treated and -untreated groups. This effect may be related to the blocking of CD54 (ligand of LFA-1) on the sinusoidal endothelial cells. It has been shown that anti-CD8 depletes blood NK cells and liver pit cells.20 The possible mechanism was that anti-
hpta
WBS: Hepatology
1480
LUO ET AL.
HEPATOLOGY December 1996
CD8 antibody lysed the cells through antibody dependent cellular cytotoxicity and complement mediated lysis. We confirm this observation, which occurs also in the zymosantreated group. In this case, the decreased number of pit cells could be related to the depletion of blood NK cells. Other anti-CAMs, however, did not deplete circulating LGL and did not interfere with the expression of CAMs, assuring an undisturbed presence of blood LGL available for homing to the liver. It is therefore concluded that the decreased number of pit cells in the livers treated with anti-CAMs was the result of blocking the homing of blood LGL to the liver. CD2 is a well-known adhesion and activation molecule present on peripheral T cells and most NK cells.21,22 Its ligand, CD58 (LFA-3), has a wide distribution on haematopoietic and various nonhaematopoietic cells including endothelium.22 Recently, it has been shown that CD58 is also present on liver endothelial cells.23 Our data show that CD2 is also present on pit cells. The blocking of CD2 would disturb the interaction of CD2 and CD58 and was found to interfere with the recruitment of pit cells in the liver. LFA-1/CD54 is another adhesion pathway which was believed to be essential for the recruitment of pit cells. It has been shown that liver endothelial cells consistently express a high level of CD54, in contrast to the endothelial cells of other organs expressing CD54 only after induction by cytokines.23,24 The CD11/CD18 leukocyte adhesion molecules consist of three surface membrane heterodimeric glycoproteins named LFA-1 (CD11a/CD18), Mac-1 (CD11b/CD18) and p150,95 (CD11c/CD18). The subunits CD11a, CD11b, and CD11c are distinct molecular masses of 180 kd, 155 kd, and 150 kd, respectively, each associating with a common b subunit (CD18) to form a1b1 heterodimers. CD11/CD18 are expressed only in leukocytes, including NK cells.13 It is proved that LFA-1 (CD11a/CD18) is the main structure involved in NK/endothelial cell adhesion, whereas Mac-1 and p150, 95 fail to be identified as having a functional role in this type of binding.10 Although CD18-positive cells in the present study most probably included LFA-1, Mac-1, and p150, 95 positive cells, we assume that the decrease in the number of pit cells after intravenous injection of anti-CD18 was mainly caused by the blocking of LFA-1 (CD11a/CD18). The results were further confirmed by the intravenous injection of anti-CD11a alone. Moreover, Kupffer cells are also found to display CD54 and LFA-1, which is believed to contribute to the adhesion of Kupffer cells and liver associated lymphocytes.23 The blocking of LFA-1 and/or CD54 would also interfere with pit cell adhesion to the Kupffer cells and partly disturb the homing of pit cells in liver. Recent studies show that liver endothelial cells and Kupffer cells express CD106 (vascular cell adhesion molecule-1) and liver associated lymphocytes express CD49d (very late antigen-4).23,24 This might provide an additional adhesion pathway involved the recruitment of pit cells in liver, besides the CD2/CD58 and LFA-1/CD54 pathways. The present study shows (1) that pit cells express CD2, CD11a, CD18, and CD54 adhesion molecules and (2) that the recruitment of pit cells (hepatic NK cells) in rat liver is, at least, supported by the LFA-1/CD54 and CD2/CD58 adhesion pathways. Acknowledgment: We thank Laurent De Lange for his technical assistance in flow cytometry, Ronald De Zanger for his assistance in statistics, and Chris Derom for her photographic support.
AID
Hepa 0006
/
5p19$$$102
11-05-96 17:31:15
REFERENCES 1. Wisse E, van’t Noordende JM, Van der Meulen J, Daems WTh. The pit cell: description of a new type of cell occurring in rat liver sinusoids and peripheral blood. Cell Tissue Res 1976;173:423-435. 2. Bouwens L, Remels L, Baekeland M, Van Bossuyt H, Wisse E. Large granular lymphocytes or ‘‘pit cells’’ from rat liver: isolation, ultrastructural characterization and natural killer activity. Eur J Immunol 1987;17:3742. 3. Bouwens L, Wisse E. Immuno-electron microscopic characterization of large granular lymphocytes (natural killer cells) from rat liver. Eur J Immunol 1987;17:1423-1428. 4. Kaneda K, Wake K. Distribution and morphological characteristics of pit cells in the liver of the rat. Cell Tissue Res 1983;233:485-505. 5. Vanderkerken K, Bouwens L, Wisse E. Characterization of a phenotypically and functionally distinct subset of large granular lymphocytes (pit cells) in rat liver sinusoids. HEPATOLOGY 1990;12:70-75. 6. Vanderkerken K, Bouwens L, De Neve W, Van den Berg K, Baekeland M, Delens N, Wisse E. Origin and differentiation of hepatic natural killer cells (pit cells). HEPATOLOGY 1993;18:919-925. 7. Wisse E, Braet F, Luo DZ, Vermoesen A, Jans D, Crabbe´ E, De Zanger R. On the tumoricide function of pit cells, the NK cells of the liver. In: VidalVanaclocha F, eds. Functional heterogeneity of the liver tissue. Austin: R. G. Landes Company, 1996: 207-235. 8. Katz AM, Rosenthal D, Sander DN. Cell adhesion molecules. Int J Dermatol 1991;30:153-159. 9. Lotzova E. Definition and functions of natural killer cells. Nat Immun 1993;12:169-176. 10. Allavena P, Paganin C, Martin-Padura I, Peri G, Gaboli M, Dejana E, Marchisio PC, et al. Molecules and structures involved in the adhesion of natural killer cells to vascular endothelium. J Exp Med 1991;173:439-448. 11. Timonen T, Gahmberg CG, Patarroyo M. Participation of CD11a-c/CD18, CD2 and RGD-binding receptors in endogenous and interleukin-2 stimulated NK activity of CD3-negative large granular lymphocytes. Int J Cancer 1990;46:1035-1040. 12. Garcia-Barcina M, Winnock M, Huet S, Bedin C, Saric J, Balabaud C. Differences on cell adhesion molecules (CAM) expression between liver associated lymphocytes and peripheral blood lymphocytes in patients undergoing partial hepatectomy. In: Knook DL, Wisse E, eds. Cells of the hepatic sinusoid Vol 4. Leiden: The Kupffer Cell Foundation, 1993:508511. 13. Tamatani T, Kotani M, Miyasaka M. Characterization of the rat leukocyte integrin, CD11/CD18, by the use of LFA-1 subunit-specific monoclonal antibodies. Eur J Immunol 1991;21:627-633. 14. Tamatani T, Miyasaka M. Identification of monoclonal antibodies reactive with the rat homolog of ICAM-1 in the adherence of resting versus activated lymphocytes to high endothelial cells. Int Immunol 1990;2:165-171. 15. Chambers WH, Vujanovic NL, Seleo AB, Olszowy MW, Herberman RB, Hiserodt JC. Monoclonal antibody to a triggering structure expressed on rat natural killer cells and adherent lymphokine activated killer cells. J Exp Med 1989;169:1373-1389. 16. Luo DZ, Vanderkerken K, Bouwens L, Kuppen PJK, Crabbe´ E, Wisse E. The number and distribution of hepatic NK cells (pit cells) in rat liver. HEPATOLOGY 1995;21:1690-1694. 17. Bouwens L, Wisse E. Tissue localization and kinetics of pit cells or large granular lymphocytes in the liver of rats treated with biological response modifiers. HEPATOLOGY 1988;8:46-52. 18. Vanderkerken K, Bouwens L, Van Rooijen N, Van Den Berg K, Baekeland M, Wisse E. The role of Kupffer cells in the differentiation process of hepatic natural killer cells. HEPATOLOGY 1995;22:283-290. 19. Bouwens L, Marinelli A, Kuppen PJK, Eggermont AMM, Van de Velde CJH, Wisse E. Electron microscopic observations on the accumulation of large granular lymphocytes (pit cells) and Kupffer cells in the liver of rats treated with continuous infusion of interleukin-2. HEPATOLOGY 1990;12: 1365-1370. 20. Like AA, Biron CA, Weringer EJ, Byman K, Sroczynski E, Guberski DL. Prevention of diabetes in biobreeding/worcester rats with monoclonal antibodies that recognize T lymphocytes or natural killer cells. J Exp Med 1986;164:1145-1159. 21. Yong K, Khwaja A. Leukocyte cellular adhesion molecules. Blood Rev 1990; 4:211-215. 22. Springer TA, Dustin MLL, Kishimoto TK, Marlin SD. The lymphocyte function-associated LFA-1, CD2 and LFA-3 molecules: cell adhesion receptors of the immune system. Annu Rev Immunol 1987;5:223-252. 23. Lukomska B, Garcia-Barcina M, Gawron W, Winnock M, Bioulac-Sage P, Balabaud C, Olszewski WL. Adhesion molecules on liver associated lymphocytes and sinusoidal lining cells of human livers. In: Wisse E, Knook DL, Wake K, eds. Cells of the hepatic sinusoid. Vol 5. Leiden: The Kupffer Cell Foundation, 1995:99-102. 24. Van Oosten M, Van de Bilt H, De Vries HE, Van Berkel THJC, Kuiper J. VCAM-1 and ICAM-1 expression on rat liver cells after lipopolysaccharide administration in vivo. In: Wisse E, Knook DL, Wake K, eds. Cells of the hepatic sinusoid. Vol 5. Leiden The Kupffer Cell Foundation, 1995:193194.
hpta
WBS: Hepatology