complex speech spectrum to recover the carrier offset. ... Keywords: speech detection, carrier recovery, speech compression, speech recognition, pitch ...
Pitch based methods for speech detection and automatic frequency recovery Douglas Nelson and Joseph Pencak Dept. of Defense, 9800 Savage Rd., Ft. Meade, Md. 20755
ABSTRACT There are many applications for which it is desirable to reliably detect the presence of speech. Examples of these applications are speech compression, voice activated devices and machine speech recognition. In this paper, a method of speech detection is developed which uses a frequency-domain pitch-based signal-to-noise ratio (SNR) estimate. This method takes full advantage of the spectral structure of pitch, which is the primary speech excitation function. The primary output of the detection algorithm is a decision that speech is present or not present. In addition, the algorithm provides an estimate of the speech SNR which may be used to estimate signal quality. This SNR estimate is important for applications such as estimating the reliability of machine based recognition processes. Additional advantages of this method are that it is independent of signal gain and it works well under adverse conditions such as poor SNR and in the presence of interference. A by-product of the pitch-based detection process is a method for automatic recovery of frequency offset of mistuned analog speech. Mistuning is a condition which can arise in the demodulation of single-side-band amplitude-modulated (SSB-AM) speech if the precise carrier is not used in the demodulation process. This can cause severe problems since speech becomes nearly unintelligible if it is mistuned more than 100 Hz. The methods presented here uses a double complex correlation of the complex speech spectrum to recover the carrier offset. This process provides significantly better resolution than more conventional correlation processes based on the speech power-spectrum. Keywords: speech detection, carrier recovery, speech compression, speech recognition, pitch estimation, higher order cumulans, correlation, analytic signals
1. INTRODUCTION This paper discusses two pitch-related speech analysis algorithms. The first of these processes is a speech activity detection algorithm which is an improvement of the algorithm published by Nelson and pencakl1. In this new implementation, the activity detection is based on a frequency domain pitch estimation algorithm, which functions as a voicing detector. The pitch detector effectively isolates the spectral energy which results from pitch. In addition, the portion of the spectrum containing only non-speech energy is isolated, allowing the process to estimate the signal-to-noise ratio (SNR). This process performs well in the presence of noise and interference and is computationally efficient. A by-product of the speech detection process is an algorithm for recovery of true carrier of mistuned single-side-band amplitude modulated (SSB-AM) speech. This process is based on complex valued higher order cumulants of the complex speech spectrum. This carrier recovery algorithm uses both the phase and magnitude of the harmonic pitch structure, resulting in dramatically better resolution than can be obtained from the power-spectrum alone. There are many situations in which it is necessary to have a reliable method for segmenting data into speech and non speech events. Examples of such processes are machine based recognition, data base compression, tactical signal sorting, and speech compression. For all of these process, the requirements are similar. The problem is to minimize the non-speech data without discarding any of the speech. The benefits of speech detection to each of the applications are slightly different. In database compression, accurate speech detection algorithm may be used to minimize the storage requirements. In tactical search, the observation time required to determine whether a signal contains speech is minimized, resulting in the ability to search a larger signal space. In vocoding, compression is used to reduce the transmission bandwidth. In machine recognition, error rates can be reduced by eliminating non-speech events which may be erroneously recognized by the machine. The process presented in this paper was developed as a multi-channel front end which sorts signals and routs signals to the correct storage device. The primary requirement is that none of the speech may be discarded since the system does not have the ability to store data which is undetected by this front-end process.
Appeared in SPIE Transactions on TimeFrequency, July, 1995
In developing the speech detection algorithm, the concept of spectral correlation was exploited. This technique has also proven to be valuable in attacking the problem of SSB-AM carrier offset recovery. Since speech becomes almost unintelligible if it is offset in frequency by more than approximately 100 Hz. this process could prove useful for HF scanning receivers which must automatically lock to SSB-AM signals. The process has nlogn computational complexity if implemented using fast FFT-based convolutions, making it efficient as well as effective.
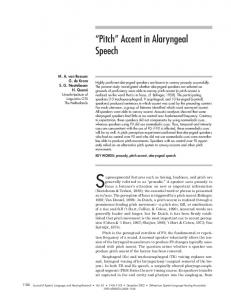
2. STRUCTURE OF SPEECH The vocal tract may be modeled as several acoustically coupled resonant cavities excited by at least two excitation functions. The primary excitation is voicing, which consists of a quasi-periodic (FM modulated) sequence of relatively narrow pulses which are produced at the glottal end of the vocal tract. The components of speech which result from the glottal pulse excitation are referred to as voiced, and the repetition rate of the glottal pulses is called pitch. The voiced components of speech are rich in harmonics in the spectrum below approximately 2500 Hz. The energy in the voiced spectrum is contained in the pitch harmonics which are usually called pitch bars. In addition to the FM modulation of pitch, there is a simultaneous amplitude (AM) modulation. In most machine-based speech processing, both the FM and AM components are ignored. In this paper, the FM components will be a key factor in carrier offset recovery but plays no direct role in the speech activity detection. Both the AM and FM modulation are exploited in secondary tests used in the speech activity detection, where they are used to help eliminate machine generated signals.
Simplified Physical Model of Speech ------
Figure 1
GLOTTAL PULSES
*
NAkk-1 CAVITY
BACK CAVITY
'
'
b
A secondary excitation function is frication, caused by the passage of air through constricted regions of the vocal tract. Frication is noise-like, resulting in a spectrum which appears as bands of high-energy noise whose spectral distribution is shaped by the filter characteristics of the portion of the vocal tract excited by frication. Both the time and frequency domain representations of unvoiced speech have very little structure which may be exploited in the problems addressed in this paper. By contrast, voiced speech is rich in structure in both the time and frequency domains. The distinctive structure of the pitch bars and the fact that they are locally nearly stationary, make them ideal features to exploit in a variety of signal processing algorithms.
I
---.,-
I
I
-
Figure 2
.....
.
,
,
ii
11
11 ,
.
I. ?
i I
~&e-domainvoiced Speech
]
Speech Formant Structure
"
The excitation functions, themselves carry information such as stress and inflection, which are pitch and energy related. However, most of the information is imposed on the speech signal by changes in the configuration of the vocal tract. The vocal tract acts as an exponentially decaying IIR filter, which modulates the speech excitation functions. As the vocal tract is reconfigured, the resonant properties change, and the structure of the speech signal changes. In the time domain, the voiced speech waveform consists of a train of relatively narrow glottal pulses with the exponentially decaying reflections. The unvoiced components appear noise-like in the time domain. What is observed in the frequency domain is a slowly changing spectrum, which is the product of the excitation spectrum and the formant spectrum. The formants are closely Appeared in SPIE Transactions on Timemrequency, July, 1995
related to the resonant properties of the vocal tract. They are the frequency response of several time-varying broad-band filters which pass the energy from the speech excitation functions.
Simplified Functional Model of Speech
2.1 The spectral structure of the voiced spectrum In Figure 5, the time-domain speech production process is represented. The time-domain speech signal is the convolution of the excitation function and the time-domain impulse response of the vocal tract. By the convolution theorem, the spectrum is the product of the spectrum of the excitation function and the frequency response of the vocal tract. Since the Fourier transform is linear, we can therefore represent the frequency-domain process equivalent to Figure 5 simply by replacing the convolutions with products. For the voiced speech spectrum, this process is essentially an AM modulation in the frequency domain of the pitch harmonics by the formants. It is well known that the spectrum of any stationary, periodic waveform consists of a fundamental bulge at the repetition frequency of the waveform, and spectral bulges at harmonics or integer multiples of the fundamental. If we could remove the variations in the magnitudes of the harmonics, the expected spectrum of the FM modulated voiced speech excitation function would be a complex valued harmonic structure in which the harmonics are integer dilations of the fundamental. We let s(t) be the speech signal then the short time FFT (STFFT) of speech has the representation
where i = and I is the time interval over which the spectrum is estimated. Since the pulsed excitation function is FM modulated, it is better to model the spectrum as a dilation or scale spectrum. The justification for this is that in FM modulation, the observed bandwidth of spectral components is dependent on the phase uncertainty which a linear function of frequency. FM modulation is a constant-Q process. The harmonic structure of voiced speech has the structure which may therefore be represented as Sl(w) = F ( ~ ) C P , ( W n where F ( o ) is the formant spectrum, Po(w) is the expected distribution of the pitch fundamental and 7
(2)
are the pitch harmonics. The pitch harmonic structure is an even function of o in the sense that the structure represented by (3) has an expected Fourier expansion whose primary components are only the cosine terms. An important observation is that the spectrum has an absolute zero reference which is not present in the time-domain representation of the signal. Speech is not stationary since speech components change slowly. For short observation intervals, the pitch harmonic structure is nearly stationary, with phase and frequency uncertainty increasing linearly with frequency. If we confine our processes to short time intervals and relatively low frequencies, we can effectively exploit the harmonic
Appeared in SPIE Transactions on TimeIFrequency,July, 1995
structure of the speech spectrum. An experimental observation is that the phase of the complex spectrum of voiced speech is not totally random. Some spectral phase relationships should be expected since the pulsed excitation function has a tendency to phase synchronize all of the pitch related spectral components each time a glottal pulse occurs. All of these observations are important since they enable the use of a variety of coherent complex operations. In fact, the spectral phase relationships of voiced speech was exploited by ~ o l t o nand ~ others in their work on features related to the phase velocity on the basilar membrane. In this paper, spectral phase relationships are exploited in carrier recovery for mistuned speech. This topic will be discussed in more detail in that section
3. SPEECH DETECTION 3.1 The application The speech detection process presented in this paper was developed to do real-time compression and separation of various signal types to form a database. This procedure involves processing large volumes of data, and, because of the design requirements, the speech detection algorithm must be very accurate and very efficient. The primary purpose of this algorithm is to function as part of a real time signal sorting process which separates speech and various types of bauded signals and eliminate the dead time when no signals are present. The design constraints for the device are extremely tight. The device must be able to make and post decisions each 100 milliseconds, with a total allowed latency of less than half a second. In addition, there is a requirement to detect speech without losing any understandable speech in an environment severely corrupted by noise and interference and a potential 20 dB instantaneous change in signal power. Finally, the system allows one DSP32C chip per channel for processing with detection using about 25 percent of the DSP resources. Several speech detection algorithms were considered before developing the current algorithm. Most of those algorithms could not perform acceptably in the high noise and interference, and the requirement to perform with 20 dB near1 far power changes eliminated the others. The two most common classes of detection techniques are based on signal power fluctuations and autocorrelation respectively. The power algorithms attempt to calculate the power of the ambient environment in the absence of speech and detect speech by looking for bursts of data with significantly more energy than the ambient environment. The autocorrelation methods attempt to detect pitch by detecting bulges in the autocorrelation function in the expected pitch range. The power methods require extensive time averaging to recover the ambient environment. None of these power methods tested could adapt rapidly enough to operate in the 20 dB nearlfar situation. In addition, the power methods failed catastrophically in the presence of dynamically changing background interference. The autocorrelation methods could adapt to the nearlfar situation, but had trouble with narrow band interference since the correlation properties are similar to pitch.
3.2 The general approach Because of this nearlfar situation and the fact that the 100 millisecond decision intervals represent several pitch periods, a spectral based algorithm was developed for this application. The detection algorithm is based on an SNR estimate in which the signal power for voiced speech is estimated in the pitch bars residing primarily in the first formant. The noise power is estimated in the spectral components between the pitch bars in the same first formant region used for the signal power spectral estimate. In addition, two secondary tests are performed, the first of these is a spectral whitening process and the second is a variance test. The process described here is specifically based on hardware design considerations. The parameters work well in this implementation, but slight changes would be necessary if the hardware and signal conditions are different from those for which this process was designed. To start the process, the signal is blocked into frames of length 100 milliseconds, a design specification. Since the sample rate is 8000 Hz, these frames consisted of 800 samples. The frames are each padded with additional 224 samples of data in order to take advantage of fast transform algorithms. The frames are then windowed to minimize the end effects, and the power spectrum is computed from each padded frame of data. The spectra are then transformed to estimate the signal power and the noise power. In this process, only the energy in approximately the first
Appeared in SPIE Transactions on TimeIFrequency, July, 1995
formant region of the spectrum is processed. The energy below approximately 195 Hz is discarded to remove the near-DC components and the first few harmonics of the domestic AC carrier. The upper cutoff is set between 1200 and 1500 Hz. The 1024 point transform is actually a very good transform size for signal detection since pitch is usually between 50 and 250 Hz. At these frequencies, there are between 6.4 and 32 pitch periods in each transform interval. In addition, pitch may be expected to be relatively stationary over the interval of each transform, so that it may be expected the pitch bars in the first formant region to be well separated from each other.
General Detection Algorithm
Secondary tests
high-power components
Threshold
Figure - 6
low-power components
In their paper, Nelson and Pencak described a DSP implementation of a speech activity detection algorithm designed for use in the same device described above. That algorithm is based on an SNR estimate calculated from a sorted spectrum. In that work, the spectrum was sorted to produce a permutation of the original signal spectrum which is ordered by ascending 2 2 power < Is1(@ (K)) , for 5 < K and p is the permuted signal spectrum. The SNR can then be estimated as
IS^(@(