Pixel-Based Texture Classification of Tissues in Computed Tomography Ruchaneewan Susomboon, Daniela Stan Raicu, Jacob Furst Intelligent Multimedia Processing Laboratory School of Computer Science, Telecommunications, and Information Systems DePaul University, Chicago, Illinois, 60604
[email protected], {draicu, jfurst}@cs.depaul.edu
Abstract Previous research has been done to classify different tissues/organs of interest present in medical images, in particular in Computed Tomography (CT) images. Most of the research used the anatomical structure present in the images in order to classify the tissues. In this paper, instead of using the anatomical structure, we propose a pixel-based texture approach for the representation and classification of the regions of interest. The approach incorporates various texture features and decision trees to accomplish tissue classification in normal Computed Tomography (CT) images of the chest and abdomen. First, we introduce a new “direction vs. displacement pairs” (DDP) approach to calculate a co-occurrence matrix for capturing all possible combination between directions and displacements necessary in calculating the texture features at the pixel-level. Second, we evaluate various different neighborhood sizes for the pixel-based texture representation in order to find the optimal window size for differentiating among 8 organs/tissues of interest: aorta, fat, kidney, liver, lung, muscle, spleen, and trabecular bone. For all organs/tissues (except for aorta), the optimal window was 13-by-13 allowing the classification sensitivity metric to be at least 96% for all organs/tissues. For aorta, the optimal window size was 9-by-9 with the classification sensitivity being 81%.
1 Introduction Automatic analysis of images from various medical imaging modalities is in high demand in order to increase the productivity of radiologists when interpreting and diagnosing hundreds of images every day. In medical imaging research, texture information plays an important role for several reasons. First, the organ shapes are different across different slides due to the generated sequences of two-dimension (2D) images from three-dimension (3D) structure. Since sequences of 2D images represent a cross section of human body, the shape of an organ throughout the entire slide of 3D is not consistent. Moreover, some organs can have different sizes from one patient to another. Therefore, the shape-based discrimination techniques [7, 8] may not be appropriate to identify the organs. To avoid these limitations, low-level features based on the gray-level information present in the image are used to capture the content of the medical images. However, the gray -levels alone are not sufficient as many soft tissues have overlapping gray level ranges [10]. Therefore, low-level features based on texture information, that is
expected to be homogenous and consistent across multiple slides for the same organ, are mostly used to perform automatic image analysis in the medical imaging field. The goal of the approach presented in this paper is to achieve automatic classification of tissues of interest in normal CT images of the chest and of the abdomen. Our approach, “direction vs. displacement pairs” (DDP), is based on texture features calculated at the pixellevel instead of a global-level as it has been done before in the texture analysis literature: for each pixel, we calculate a co-occurrence matrix for capturing all possible combinations between directions and displacements within a small neighborhood centered on that pixel. The optimal neighborhood size is determined by the window size producing the best pixel-classification accuracy of the regions of interest. To classify the regions, 1) a Classification and Regression (C &RT) decision tree is used to produce the pixel-level classification and then 2) a majority vote scheme is applied to label each of the regions of interest based on the majority of pixel labels within the corresponding region. The beauty of the proposed approach consists in its applicability to 1) perform automatic segmentation of regions of interest by using the classification rules derived at the pixel-level; 2) build context-sensitive reporting tools (for instance, apply a computer-aided diagnosis tool for liver only if the region of interest is a liver); and 3) develop educational software for medicine. 2 Background Research in the field of image classification using texture information is mostly limited to specific pathologies and a single organ tissue. In [11], Karkanis et al. applied a multilayer feedforward neural network based on texture features to classify cancer regions in colonoscopic images. Baeg and Kehtarnavaz [13] proposed a three-layer back-propagation neural network based on two image texture features to classify abnormalities in digitized mammograms. Wroblewska et al. [15] proposed an automatic feature selection algorithm and multilayer feedforward back-propagation neural network to detect and classify of micro-calcifications in digital mammograms. Zaiane et al. [14] proposed an automatic classification of benign and malign tumors in mammography images based on an association rule mining approach. There is also some work done with respect to the identification of several organs at the abdomen level. In [9], a Hopfield neural network was applied to perform organ identification based on Haralick texture features applied at the pixel level. The advantage of this technique is that it does not require a priori knowledge. However, the technique gives poor results in identifying liver, spleen and muscle because of a block-wise contour effect from calculating the texture features at the block-level. Lee at al. [12] proposed a multi-module contextual neural network and fuzzy rules to overcome the difficulties in Koss’s technique. The multi-module contextual neural network segments images by classifying the pixels into disjoint region based on the gray-level and contextual information of neighboring pixels. Then, the fuzzy rule is applied to the region features, including relative location, relative distance, tissue-intensity, area, compactness, and elongatedness, in order to give the final segmented organs. Furthermore, the texture feature analysis has been performed either at the global-level (organ/tissue) or local-level (small region within the tissue/organ of interest) rather than at the pixel-level. The DDP approach proposed in the paper will extract all possible texture characteristics with respect to direction and displacement instead of considering all pixel pair within a small neighborhood centered on the corresponding pixel; furthermore, a decision tree is employed to do a pixel-based classification. Since this process is done at the pixel-level, the
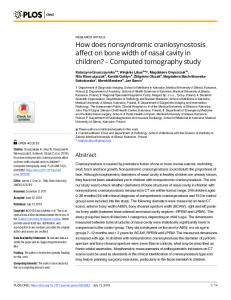
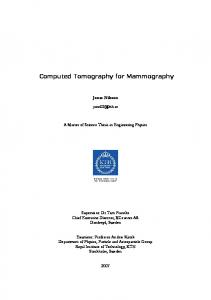
limitations of the previous approaches in dealing with inconsistent organ shapes and positions, and overlapping gray-levels will be overcome by the proposed approach. The rest of this paper is organized as follows. The methodology of the approach for organ classification is discussed in Section 3 and the evaluation of the approach is described in Section 4. The preliminary experimental results are presented in Section 5; finally, conclusions and future work are discussed in Section 6. 3 Methodology Our approach to pure patch tissue classification consists of three stages: 1) pre-processing; 2) pixel-level texture extraction; and 3) classification. Figure 1 illustrates the overview of our proposed system. First, the pre-processing stage strengthens the contrast in the image and reduces the noise in the data. Second, the pixel-level texture stage extracts the characteristics of the texture at the local level. Finally, a supervised learning technique is utilized in order to classify each pixel, and further each tissue of interest. Pre-Processing: Clipped Binning CT Images
Pixel-Level Texture Extraction: Haralick Enhance Image
Classification: Decision Tree (Pixel –Level)
Neighborhood of a pixel
Classified Annotated images
Figure 1: Diagram of the proposed system. 3.1 Pre-processing: Gray-level reduction using clipped Since most of the soft tissues have overlapping gray-levels and the contrast among the tissues is very low within the CT images, especially given the large range of gray-levels in DICOM (Digital Imaging and Communications in Medicine) format of 4096 gray-levels for a 12 bit resolution, an image enhancement pre-processing technique is needed to increase the gray-level contrast among the tissues. We apply a clipped binning technique [1] to enhance the contrast within the soft tissues necessary for good texture feature extraction. The clipped binning technique incorporates 1) a Kmeans algorithm that automatically determines the range of the gray levels for the soft tissues in the given CT images; 2) the gray-levels that are lower than the soft tissue range and the graylevels that are higher than the soft tissue range will be assigned to the minimum bin and maximum bin, respectively; the gray values within the soft tissue range will be linearly divided into equal bins. 3.2 Pixel-level texture extraction Pixel-level texture extraction will be used to discover the texture of each pixel within a small neighborhood. These overlapping regions allow a certain ambiguity to be incorporated in the texture property for improving organ/tissue classification. In order to capture the spatial distribution of the gray-levels within the neighborhood, a two-dimensional co-occurrence matrix
[3] is applied to calculate the local texture information around that pixel. While Kalinin et al. [4] and Koss et al. [9] calculated the local texture based on an “all-pairs” (AP) approach, which considers all the pixel pairs within the neighborhood, we propose a new “direction vs. displacement pairs” (DDP) approach, which considers every direction and displacement separately around the pixel of interest. In this way, the checker board problem introduced by the AP approach (two textures having different patterns will have the same co-occurrence matrix if they have same values for the gray-levels) will be overcome by the proposed DDP approach. The DDP is based on the estimation of joint conditional probability of pixel pair occurrences Pij (d ,θ ) . The Pij denotes the normalized co-occurrence matrix by total number of the
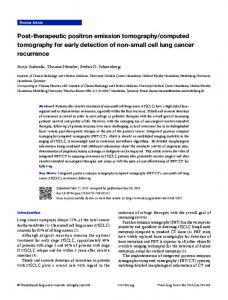
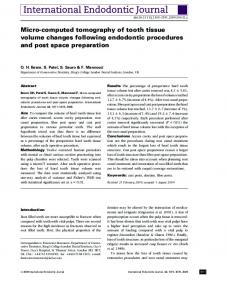
occurrence of two neighboring pixels between i gray-intensity at vertical direction (row) and another j gray-level at horizontal direction (column) of specify by displacement vector d and angle θ . There are four different directions including 0°, 45°, 90°, and 135° are generally used in image processing as in Figure 2 and (n-1) is a number of displacement vector in n-by-n window size, where n denotes resolution vector in row and column. j
90°
135°
4
3
45°
0 0
2 1
1 2 3
0°
i
1 2 3
Figure 2: From the centered pixel; pixel 1 represents 0° at d=1; pixel 2 represents 45°; pixel 3 represents 90°and pixel 4 represents 135°at d=1
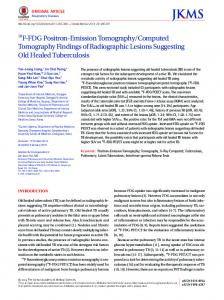
Original Image
Co-Occurrence
Figure 3: Co-occurrence matrix for distance 1, direction 0°
In terms of computational time, the DDP approach is Ο ( n3 ) since the number of pixel comparisons of DDP is given by formula (1), where n denotes the size of the window: n ⎡ n ⎤ 2 × ⎢n ∑ i + ∑ i2 ⎥ (1) ⎣⎢ i = 1 i = 1 ⎦⎥ Furthermore, for computational efficiency purposes, the co-occurrence matrix implementation represents only the gray-levels that appear within the pixel neighborhood under consideration. Once the co-occurrence matrix is calculated around each pixel, ten Haralick texture descriptors [2] measuring different properties of the texture are obtained; 1) Entropy to measure the randomness of gray-level distribution; 2) Energy to measure the occurrence of repeated pairs within an image; 3) Contrast to capture the local contrast in an image; 4) Homogeneity to measure the homogeneity of the image; 5) Sum Average to provide the mean of the gray intensity within an image; 6) Variance to estimate the variation of gray level distribution; 7) Correlation to measure a correlation of pixel pairs on gray-levels; 8) Maximum probability to represent the most predominant pixel pair in an image, 9) Inverse Difference Moment (IDM) to measure the smoothness of an image and 10) Cluster Tendency to measure the grouping of pixels that have similar gray-level values. The calculation of Haralick features are shown in Appendix. At the end of this stage, each pixel will be characterized along each distance and displacement by a 10-dimensional vector: [d1 ,… , d10 ]
3.3 Classification
The classification stage consists of 2 stages: pixel-based texture classification and pure patch classification. 3.3.1 Pixel-based texture classification. There are many types of classifiers that could be used to differentiate among the organs/tissues in pixel-based space. Decision trees have a relatively fast learning speed compared with other classification techniques and also have the ability to eliminate the irrelevant attributes from the set of features. Furthermore, the decision trees do not make any assumptions about the distribution of the data and this property makes them appropriate to be used when the distribution of the data is unknown. In our approach, a Classification and Regression Tree (C&RT) classifier is applied to discriminate the pixel-based pattern among different tissues [16]. C&RT implements the classification process based on splitting the current node into two child nodes based on the predictors’ values which are the texture descriptors in our case. The best predictor is chosen using the Gini impurity index such that each child node is more pure than its parent node [16]. The goal is to produce subsets, leaf nodes, which are as homogeneous as possible with respect to the class label. In order to not overfit the data, there are several stopping criteria used for the tree growth [5]: • Maximum tree depth: d • Minimum number of cases for the parent node (internal node): np • Minimum number of cases for child nodes (left/ terminal node): nc • Minimum change in impurity: imp Depending on these parameter values (d, np, nc, imp), a different tree will be produced. The optimal tree will be the tree whose parameters produce the highest classification accuracy at the pixel level on the testing data. Once the optimal decision tree is developed, its decision rules will be used to classify each pixel within the tissue region of interest. 3.3.1 Tissue classification. The classification of a tissue region involves a majority scheme in which each pixel from the region is classified using the rules derived from the C&RT. The most frequent label within the corresponding region will become the classification label of that patch. Therefore, the tissue classification is the representation of the majority of predicted tissues at the pixel level. Since a set of rules is applied to each pixel within the region, the tissue classification is independent of the tissue regions’ sizes, so regions of different sizes can be automatically classified by our proposed approach. This advantage will allow us to use the technique for image segmentation in regions having not necessary equal sizes as it is the case for multiple organs/tissues segmentation in CT images. 4 Evaluation model
The evaluation of our approach is performed with respect to eight different pure tissue patches including aorta, fat, kidneys, liver, lung, muscle, spleen, and trabecular bone. The segmented pure tissues have been manually generated by a clinical expert. The proposed results will be compared against the clinical expert’s manual patch labels; in order to assess the accuracy of the approach, each tissue will be evaluated separately.
Two classification metrics are used to measure the classification performance: TP sensitivity = (2) TP + FN TN specificity = (3) TN + FP in which TP denote true positives, FP denote false positives, TN denotes true negatives, and FN denote false negatives. True positive is a number of the patches that belong to that organ that are correctly classified as that organ. False positive is a number of patches that belong to that organ that are incorrectly classified as that organ. True negative is a number of patches that belong to other organs that are correctly classified as other organs. False negative is a number of the patches that belong to that organ that are incorrectly classified as other organs. 5 Experimental results 5.1 Data
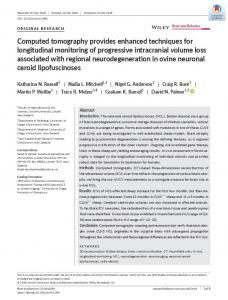
In this study, 440 pure patches (55 patches per organ/tissue) from multiple, serial, axial normal CT images derived from helical, multi-detector CT acquisitions of 5 patients were manually segmented and annotated by an expert radiologist. The images were in DICOM format, size of 512 by 512 with 12 bit resolution. The segmented tissues have been manually annotated in one of the following categories: aorta, fat, kidneys, liver, lung, muscle, spleen, and trabecular bone; some examples of pure patches are shown in Figure 4. Kidney
Original
Liver
Clipped
Spleen
Original
Clipped
Origina
Clipped
Trabecular bone
Origina
Clipped
Figure 4: Result of pure patches contrast enhancement using clipped binning with 256 bins. 5.2 Pre-processing
We found that the soft tissues in DICOM format (with 4096 gray levels) are nearly always placed into an approximately gray-level range between 856 and 1368. Therefore, the clipped binning approach allocates all gray intensity within a lower bound (0-855) to a single lowest bin and allocates a single maximum bin to an upper bound (1367-4095). The rest of the gray levels are equally divided into equal sized bins; by varying the number of gray levels, we found that 256 equal-sized bins is an optimum number for contrast enhancement of soft tissues in CT images [1].
5.3 Texture features
We assess the co-occurrence matrix calculation for both the AP and DDP approaches: AP calculates the co-occurrence by considering all the pixel pairs within the neighborhood; DDP is an integration of every possible co-occurrence which considers direction and displacement separately. For the DDP approach, we consider four different directions of 0°, 45°, 90°, and 135°; in terms of displacement, since DDP approach considers every direction and displacement separately, the values of the displacement will vary accordingly to the pixel window size. For example, in a 5-by-5 window, we will have 4 different displacements and thus, 16 (4 directions by 4 displacements) co-occurrence matrices in total. The ten Haralick texture features are calculated for each co-occurrence matrix. 5.4 Classification
To obtain the C&RT decision tree, we divided the 440 pure patches into a training set containing a random sampling of 66% of the pixels and a testing set containing the other 34%. Since the texture feature have different value as a pre-processing step, we scaled all the features to the range 0 to 1; the scaling was done using the max-min normalization approach [5]. The optimal tree was found for number of parents equal to 100 and number of children equal to 5. For this tree, 155 rules and 188 rules were found for the AP and DDP approaches, respectively, for a window size equal to 13 by 13. In both approaches, the lowest number of rules was obtained for fat, lung, and muscle, and the highest number of rules was obtained for liver and spleen; this indicates that there is not much difference among the texture pixels for fat/lung/muscle pixels, while there is significant difference among the tissue pixels of a single organ/tissue such as liver or spleen. Once all the pixels in the pure-patch are classified using the derived decision rules, the highest frequency of the organ/tissue label in the patch will be used as the label representation of this patch in order to get the final classification. In addition to the classification task, the decision tree approach helps us identify the most importance features for discriminating among the organs/tissues. We found that the IDM descriptor is the most important feature for the classification task. 5.5 Patch Classification Results
With respect to the way of calculating the texture features, in all cases, the DDP approach produced at least the same or better results than the AP approach (Tables 1 & 2) regardless of the organ consideration. Varying the window size from 5 by 5 to 13 by 13, had a slight effect on the result of AP approach, but had a significant effect on the DDP approach. An explanation of this result may rely on the fact that, as the window becomes larger, more local texture properties are captured for the calculation of the co-occurrence matrix, and thus of the texture features used for classification. The window size was varied from 5-by-5 to 13-by-13 because 1) sensitivity of aorta starts to decrease from 9-by-9 window; 2) at 13-by-13 most of tissue classifications get almost 100% classification sensitivity; and 3) the computation time involved in DDP cooccurrence calculation increases cubically with the size of the window. Table 1 presents the significant improvement of the DDP approach’s sensitivity with the window size. For example, the sensitivity of kidneys rises from 64% to 97% and there is a
significant improvement from 61% to 100% for spleen, when the window size grows up from 5by-5 to 13-by-13. The sensitivity of aorta went up from 45% to 81% when window size increased from 5-by-5 to 9-by-9; however, the sensitivity started dropping at that point. Thus, from these preliminary results, it seems like there are different patterns within the aorta tissue patches and a 9-by-9 window size will be more appropriate for aorta. On the other hand, the sensitivity for fat, liver, lung and backbone did not increase significantly because the sensitivity was already almost 100% at a window size of 5-by-5. Table 2 presents the specificity results for the eight organs of interest. Regardless of the window size, the specificity value for each organ was above 90% for both AP and DDP approaches. Table 1: Sensitivity for the pure patch classification for DDP and AP Aorta Window 5x5 7x7 9x9 11x11 13x13
Fat
DDP
AP
45.28% 67.92% 81.13% 63.83% 66.67%
20.00% 21.82% 27.27% 30.61% 30.43%
DDP
Kidney AP
DDP
AP
98.18% 98.18% 63.64% 36.36% 100% 98.15% 81.48% 44.44% 100% 100% 78.85% 51.92% 100% 100% 86.67% 55.56% 100% 100% 96.55% 72.41%
Liver
Lung
Muscle
Spleen
Trabecular Bone
DDP
AP
DDP
AP
DDP
AP
DDP
AP
DDP
AP
100% 100% 100% 100% 100%
100% 100% 98.18% 98.18% 100%
100% 100% 100% 100% 100%
100% 100% 100% 100% 100%
100% 100% 100% 100% 100%
100% 100% 100% 100% 100%
60.47% 83.33% 94.44% 94.34% 100%
44.44% 67.44% 83.33% 86.79% 96.67%
100% 100% 100% 100% 100%
92.86% 93.75% 95.24% 100% 100%
Table 2: Specificity for the pure patch classification for DDP and AP Aorta Window 5x5 7x7 9x9 11x11 13x13
Fat
Kidney
Liver
Lung
DDP
AP
DDP
AP
DDP
AP
DDP
AP
DDP
99.07% 99.60% 99.51% 99.49% 100%
99.44% 98.80% 99.32% 99.30% 100%
100% 100% 100% 100% 100%
100% 100% 100% 100% 100%
96.24% 96.39% 98.04% 95.43% 92.97%
96.08% 96.11% 95.96% 97.22% 95.43%
94.04% 96.37% 99.00% 98.93% 98.43%
91.60% 95.50% 96.60% 97.48% 97.13%
100% 100% 100% 100% 100%
AP
Muscle DDP
AP
Spleen DDP
100% 99.70% 99.72% 94.56% 100% 100% 99.70% 96.79% 100% 100% 100% 95.54% 100% 100% 100% 96.30% 100% 100% 100% 97.64%
Trabecular Bone
AP
DDP
AP
90.78% 91.30% 90.17% 91.43% 96.55%
95.92% 96.55% 96.26% 96.50% 99.24%
91.08% 92.42% 92.18% 92.78% 96.59%
6 Conclusion and future work
Our preliminary results show that that the co-occurrence calculation scheme at the pixel level and the window size have a significant influence upon the classification results, especially for the soft tissues. With respect to the DDP approach, the optimal window size was 13-by-13 allowing the sensitivity metric to be at least 96% for all organs except for aorta. For aorta, the optimal window size was 9-by-9 with the classification sensitivity being 81%. Therefore, different window sizes are appropriate for different organs and the larger the window size, the more local information will be captured to calculate the texture. In terms of the overall classification result and operational efficiency, we suggest that the best window size for identify regions of interest is 9-by-9. As future work, the proposed approach can be extended to 1) include other texture features; and 2) assign probabilistic labels to the regions of interest instead of just the label which most predominant within the corresponding region. This will allow applying the proposed approach for 1) probabilistic annotation of “unknown” pure patches; 2) automatic probabilistic segmentation of pure patches in CT images using split and merge segmentation algorithms; and 3) creation of context-sensitive tools for CAD systems. We also plan to investigate the effect of
using three dimensional texture models and incorporating more sophisticated decision algorithms to move from a pixel classification to a patch classification. Finally, we will begin testing the applicability of texture-based classification to certain pathologies. References
[1] R. Lerman, D. S. Raicu, and J. D. Furst, “Contrast enhancement of soft tissues in Computed Tomography images”, SPIE Medical Imaging, 2006. [2] R.M. Haralick, K. Shanmugam, and I. Dinstein, “Textural Features for Image Classification”, IEEE Trans. on Systems, Man, and Cybernetics, vol. Smc-3, no.6, pp. 610-621, 1973. [3] R. Jain, R. Kasturi, and B.G. Schunck, “Machine Vision”, New York: McGraw-Hill, 1995. [4] M. Kalinin, D.S. Raicu, J. Furst, and D.S. Channin, “A classification Approach for anatomical regions segmentation”, IEEE Int. Conf. on Image Processing, 2005. [5] D. Channin, D. S. Raicu, J. D. Furst, D. H. Xu, L. Lilly, and C. Limpsangsri, "Classification of Tissues in Computed Tomography using Decision Trees", The 90th Scientific Assembly and Annual Meeting of Radiology Society of North America (RSNA04), 2004. [6] M. Kass, A. Witkin, and D. Terzopoulos, “Snakes: Active contour models”, Int’l. J. of Comp. Vis. 1(4), 1988. [7] E. Persoon, K. S. Fu, “Shape discrimination using Fourier descriptors,” IEEE Trans. Pattern Analysis & Machine Intelligence., vol. Pami-8, no. 3, pp. 388-397, 1986. [8] R. N. Dave, T. Fu, “Robust shape detection using Fuzzy clustering: Practical application”, Fuzzy Sets Syst., vol. 65, pp. 161-185, 1994. [9] J. E. Koss, F. D. Newman, T. K. Johnson, D. L. Kirch, “Abdominal organ segmentation using texture transform and a Hopfield neural network,” IEEE Trans. Medical Imaging, vol. 18, no. 7, pp. 640-648, 1999. [10]M. Kobashi, L. G. Shapiro, “Knowledge-based organ identification from CT images,” Pattern Recognition, vol. 28, no. 4, pp 475-491, 1995. [11]S. A. Karkanis, et al.,“Detecting abnormalities in colonoscopic images by texture descriptors and neural networks,” Proc. of the Workshop Machine Learning in Med. App., pp 59-62, 1999. [12]C. C. Lee, P. C. Chung, and H. M. Tsai, “Identifying multiple abdominal organs from CT image series using a multi-module contextual neural network and spatial fuzzy rules,” IEEE Trans. on Info. Tech. Biomedical, vol. 7, no. 3, 2003. [13]S. Baeg, N. Kehtarnavaz, “Texture based Classification of Mass Abnormalities in Mammograms,” Proc. of IEEE CBMS Symposium, 2000. [14]O. R. Zaiane, M. L. Antonie, A. Coman, “Mammography Classification by an Association Rule-based Classifier,” Int. Workshop on Multimedia Data Mining., 2002 [15]A. Wroblewska, P. Boninski, A. Przelaskowski, M Kazubek, “Segmentation and feature extraction for reliable classification of micro calcifications in digital mammograms,” OptoElectron. Rev., vol. 11, no. 3, 2003. [16]R. O. Duda, P. E. Hart, D. G. Stork, “Pattern Classification,” A Wiley-Interscience, 2001
Appendix
Suppose M and N represent resolution vector at row and column respectively. The ten Haralick features are calculated as the following: M
N
i
j
−∑∑ Pij log Pij
Entropy:
M
N
∑∑ P
Energy:
2
ij
i
j
M
N
∑∑ (i − j )
Contrast:
i
j
M
N
i
j
2
Pij
Pij
∑∑ | i − j |
Homogeneity:
;i ≠ j
Sum Average:
1 M N ∑∑ (iPij + jPij ) 2 i j
Variance:
1M N ∑∑ ((i − µr )2 Pij + ( j − µc )2 Pij ) 2 i j M
N
i
j
∑∑
Correlation:
(i − µr )( j − µc ) Pij
σ r2 × σ c2
M ,N
Maximum Probability: Inverse Difference Moment: Cluster Tendency:
Max Pij i, j
M
N
i
j
M
N
Pij
∑∑ 1 + (i − j ) ∑∑ (i − µ i
r
2
+ j − µc ) 2 Pij
j
where µr , µc , σ r2 , σ c2 are the mean and variance of row and column defined as follow: M
N
µr = ∑∑ iPij i
j
M
N
σ r = ∑∑ (i − µr ) 2 Pij i
j
M
,
,
N
µc = ∑∑ jPij i
j
M
N
i
j
σ c = ∑∑ ( j − µc ) 2 Pij


![usa.siemens.com/computed-tomography [PDF]](https://m.moam.info/img/260x300/usasiemenscom-computed-tomography-pdf_6479f808098a9ec7448b4651.jpg)