Planar photonic crystal microspectrometers in silicon-nitride for the visible range Babak Momeni,1 Ehsan Shah Hosseini,1 and Ali Adibi1,* 1
School of Electrical and Computer Engineering, Georgia Institute of Technology, Atlanta, GA 30332, USA *
[email protected]
Abstract: We demonstrate the feasibility of forming a compact integrated photonic spectrometer for operation in the visible wavelength range using the dispersive properties of a planar photonic crystal structure fabricated in silicon nitride. High wavelength resolution and compact device sizes in these spectrometers are enabled by combining superprism effect, negative diffraction effect, and negative refraction effect in a 45° rotated square lattice photonic crystal. Our experimental demonstration shows 1.2 nm wavelength resolution in a 70 µm by 130 µm photonic crystal structure with better performance than alternative structures for on-chip spectroscopy, confirming the unique capability of the proposed approach to realize compact integrated spectrometers. ©2009 Optical Society of America OCIS codes: (130.3120) Integrated optics devices; (230.5298) Photonic crystals.
References and links 1. 2. 3. 4. 5. 6. 7. 8. 9. 10. 11. 12. 13. 14. 15. 16.
A. Ksendzov, and Y. Lin, “Integrated optics ring-resonator sensors for protein detection,” Opt. Lett. 30(24), 3344–3346 (2005). A. Yalcin, K. C. Popat, J. C. Aldridge, T. A. Desai, J. Hryniewicz, N. Chbouki, B. E. Little, O. King, V. Van, S. Chu, D. Gill, M. Anthes-Washburn, M. S. Unlu, and B. B. Goldberg, “Optical sensing of biomolecules using microring resonators,” IEEE J. Sel. Top. Quantum Electron. 12(1), 148–155 (2006). A. Densmore, D.-X. Xu, P. Waldron, S. Janz, P. Cheben, J. Lapointe, A. Delâge, B. Lamontagne, J. H. Schmid, and E. Post, “A silicon-on-insulator photonic wire based evanescent field sensor,” IEEE Photon. Technol. Lett. 18(23), 2520–2522 (2006). J. Xu, D. Suarez, and D. S. Gottfried, “Detection of avian influenza virus using an interferometric biosensor,” Anal. Bioanal. Chem. 389(4), 1193–1199 (2007). K. Zinoviev, L. G. Carrascosa, J. Sanchez del Rio, B. Sepulveda, C. Dominguez, and L. M. Lechuga, “Silicon photonic biosensors for lab-on-a-chip applications,” Adv. Opt. Technol. 2008, 383927 (2008). B. Momeni, S. Yegnanarayanan, M. Soltani, A. A. Eftekhar, E. S. Hosseini, and A. Adibi, “Silicon nanophotonic devices for integrated sensing,” J. Nanophoton. 3(1), 031001 (2009). R. F. Wolffenbuttel, “State-of-the-art in integrated optical microspectrometers,” IEEE Trans. Instrum. Meas. 53(1), 197–202 (2004). D. S. Goldman, P. L. White, and N. C. Anheier, “Miniaturized spectrometer employing planar waveguides and grating couplers for chemical analysis,” Appl. Opt. 29(31), 4583–4589 (1990). D. Sander, M.-O. Dücker, O. Blume, and J. Muller, “An optical microspectrometer in SiON-slab-waveguides,” Proc. SPIE 2686, 100–107 (1996). Y. Maruyama, K. Sawada, H. Takao, and M. Ishida, “A novel filterless fluorescence detection sensor for DNA analysis,” IEEE Trans. Electron. Dev. 53(3), 553–558 (2006). D. A. Zauner, A. M. Jorgensen, T. A. Anhoj, and J. Hübner, “Concave reflective SU-8 photoresist gratings for flat-field integrated spectrometers,” Appl. Opt. 45(23), 5877–5880 (2006). Y. Komai, H. Nagano, K. Okamoto, and K. Kodate, “Compact spectroscopic sensor using a visible arrayed waveguide grating,” Jpn. J. Appl. Phys. 45(No. 8B), 6742–6749 (2006). S. Janz, A. Balakrishnan, S. Charbonneau, P. Cheben, M. Cloutier, A. Delâge, K. Dossou, L. Erickson, M. Gao, P. A. Krug, B. Lamontagne, M. Packirisamy, M. Pearson, and D.-X. Xu, “Planar waveguide Echelle gratings in silica-on-silicon,” IEEE Photon. Technol. Lett. 16(2), 503–505 (2004). Y. Hibino, “Recent advances in high-density and large-scale AWG multi/demultiplexers with higher indexcontrast silica-based PLCs,” IEEE J. Sel. Top. Quantum Electron. 8(6), 1090–1101 (2002). H. Kosaka, T. Kawashima, A. Tomita, M. Notomi, T. Tamamura, T. Sato, and S. Kawakami, “Superprism phenomena in photonic crystals: toward microscale lightwave circuits,” J. Lightwave Technol. 17(11), 2032– 2038 (1999). B. Momeni, J. Huang, M. Soltani, M. Askari, S. Mohammadi, M. Rakhshandehroo, and A. Adibi, “Compact wavelength demultiplexing using focusing negative index photonic crystal superprisms,” Opt. Express 14(6), 2413–2422 (2006).
#111848 - $15.00 USD
(C) 2009 OSA
Received 26 May 2009; revised 14 Jul 2009; accepted 29 Jul 2009; published 10 Sep 2009
14 September 2009 / Vol. 17, No. 19 / OPTICS EXPRESS 17060
17. B. Momeni, M. Chamanzar, E. S. Hosseini, M. Askari, M. Soltani, and A. Adibi, “Strong angular dispersion using higher bands of planar silicon photonic crystals,” Opt. Express 16(18), 14213–14220 (2008). 18. B. Momeni, and A. Adibi, “An approximate effective index model for efficient analysis and control of beam propagation effects in photonic crystals,” J. Lightwave Technol. 23(3), 1522–1532 (2005). 19. B. Momeni, and A. Adibi, “Preconditioned superprism-based photonic crystal demultiplexers: analysis and design,” Appl. Opt. 45(33), 8466–8476 (2006). 20. E. Shah Hosseini, S. Yegnanarayanan, A. H. Atabaki, M. Soltani, and A. Adibi, “High quality planar silicon nitride microdisk resonators for integrated photonics in the visible wavelength range,” Opt. Express 17(17), 14543–14551 (2009). 21. J. J. Baumberg, N. M. B. Perney, M. C. Netti, M. D. C. Charlton, M. Zoorob, and G. J. Parker, “Visiblewavelength super-refraction in photonic crystal superprisms,” Appl. Phys. Lett. 85(3), 354–356 (2004). 22. B. Momeni, Q. Li, and A. Adibi, “Ultra-compact implementation of planar superprism-based demultiplexers in silicon,” in preparation. 23. T. Baba, and D. Ohsaki, “Interfaces of photonic crystals for high efficiency light transmission,” Jpn. J. Appl. Phys. 40(Part 1, No. 10), 5920–5924 (2001). 24. B. Momeni, and A. Adibi, “Adiabatic matching stage for coupling of light to extended Bloch modes of photonic crystals,” Appl. Phys. Lett. 87(17), 171104 (2005). 25. K. Okamoto, Fundamentals of Optical Waveguides, San Diego: Academic Press, 2000. 26. P. E. Barclay, K. Srinivasan, O. Painter, T. J. Watson, B. Lev, and H. Mabuchi, “Integration of fiber-coupled high-Q SiNx microdisks with atom chips,” Appl. Phys. Lett. 89(13), 131108 (2006). 27. B. Momeni, M. Askari, E. S. Hosseini, A. Atabaki, and A. Adibi, “An on-chip silicon grating spectrometer using a photonic crystal reflector,” submitted for publication. 28. M. Notomi, “Theory of light propagation in strongly modulated photonic crystals: Refractionlike behavior in the vicinity of the photonic band gap,” Phys. Rev. B 62(16), 10696–10705 (2000).
1. Introduction The potential of integrated photonic platforms to realize strong light-matter interaction and efficient sensing functionalities in a compact structure has been the driving force for the emerging field of integrated photonic sensors. Different integrated sensing platforms and devices have been proposed to implement a variety of mechanisms for biological and chemical sensing [1–6]. Many such sensing mechanisms of interest (e.g., fluorescence and surface-enhanced Raman effects) rely on optical phenomena that occur in the visible wavelength range, which require the development of functional integrated photonic structures in the visible range. Among different material platforms available for this realization, siliconnitride (SiN) is a preferred choice, since (1) it is compatible with mature silicon microelectronics fabrication techniques, and (2) it has good optical quality (i.e., low loss in a wide wavelength range and a relatively large index, n ≈ 2 at visible wavelengths). Development of the required components in SiN to form a complete sensing system is the next step in the path to capacitate these systems to address major demands of different sensing applications. Spectrometers, which enable spectral analysis and detection of spectral emission and absorption features, are one of the essential building blocks required to implement the systems needed for many sensing applications. While conventional sensing approaches rely on using bulky off-chip spectrometers, the need for compact mobile or handheld structures has motivated extensive recent progress in the development of integrated onchip microspectrometers [7]. Several approaches to realize compact spectrometers in the visible range have been proposed previously, including off-chip separation of wavelengths [8], grating spectrometers in low index contrast material [9], frequency-selective detection of light [10], polymer-based implementation [11], and integrated optical spectrometers [12]. However, all these approaches require large structures and offer limited spectral resolution. The focus of this paper is to use the relatively large index contrast in SiN on SiO2 (through fabricating strongly dispersive photonic crystals) to demonstrate the potential for realizing high-resolution integrated photonic spectrometers with a very small footprint in the visible wavelength range (around 656 nm). The availability of compact spectrometers enables new sensing mechanisms (e.g., monitoring fluorescence and Raman spectra) and new sensing architectures (e.g., multiplexing several resonators for parallel sensing) [6] in the visible integrated photonic systems. The potential integration of silicon detectors and electronic processing units in a
#111848 - $15.00 USD
(C) 2009 OSA
Received 26 May 2009; revised 14 Jul 2009; accepted 29 Jul 2009; published 10 Sep 2009
14 September 2009 / Vol. 17, No. 19 / OPTICS EXPRESS 17061
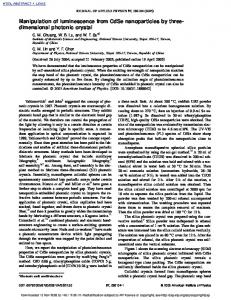
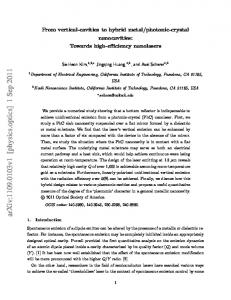
compatible platform with SiN sensing components offers a unique prospective for the future of such modules for low-cost, compact, sensitive, and portable sensing applications. In the following sections, the demonstration of a photonic crystal spectrometer in SiN is described. In Section 2, the operation principle and theoretical background of these spectrometers are explained. In Section 3, the process of fabricating these spectrometer devices and the experimental characterization results are presented. The implementation issues are discussed and future steps to further improve the spectrometer performance are laid out in Section 4. Finally, in Section 5, the results are summarized and conclusions are made. 2. Operation principle Implementation of compact on-chip spectrometers naturally require a mechanism to differentiate between the wavelengths of the input light. This differentiation may occur in a lumped element (e.g., at an interface) as in grating spectrometers [13], using the dispersion of a set of waveguides as in arrayed waveguide gratings [14], or through propagation in a dispersive material as in superprism-based devices [15]. It is clear that employing stronger dispersion in all these cases results in more compact high-resolution devices. Here, we use the superprism effect in photonic crystals as the main mechanism to achieve spatial spectral mapping in the spectrometer. We follow the basic principle used in silicon-based focusing superprism wavelength demultiplexers [16] to realize compact devices in SiN. The operation concept is based on combining the superprism effect, the negative diffraction effect, and the negative refraction effect inside a photonic crystal structure. The overall configuration is schematically visualized in Fig. 1(a), in which different wavelengths are separated inside the photonic crystal region. In this approach, the angular dispersion inside the photonic crystal is used to steer different wavelengths in different directions inside the structure. At the same time, the negative diffraction property is used to focus the (initially broadened) beam into small spots at the output to make the overall device compact, and the negative refraction is employed to separate the signal of interest from unwanted stray light [16]. It can be observed that the in-plane band structure of the first TE-like mode (i.e., electric field inside the plane of periodicity of the photonic crystal) of a 45°-rotated square lattice photonic crystal, as shown in Fig. 1(b), satisfies all the requirements for achieving superprism, negative diffraction, and negative refraction simultaneously. This band structure is calculated using a threedimensional plane wave expansion method (based on a supercell) considering the finite thickness of the SiN slab (205 nm). The diameter of holes in this simulation is 170 nm, and the lattice constant is 240 nm. As it can be seen from Fig. 1(b), in this structure there is an operation range below the light line that shows strong dispersion effects while demonstrating simultaneous negative diffraction and negative refraction. To explore the extent of strong dispersion in this structure, we can also consider higher photonic bands of the planar photonic crystal [17]; however, because of the limited contrast between the SiN layer and the underneath SiO2 layer, higher photonic bands of this planar structure are not confined to the slab anymore. To find the optimal device parameters, we use the envelope transfer function [18] to approximately model the beam propagation inside the photonic crystal region. The configuration of the structure used in this modeling is shown in Fig. 2(a). The input beam is incident on the photonic crystal interface from an unpatterned slab region (to simulate the operation of the actual device) at an incident angle of 13° in this case. The beam undergoes some diffractive broadening prior to entering the photonic crystal region, such that the overall second-order diffraction is canceled at the output of the device at the center wavelength of 656 nm. The width of the photonic crystal region is L = 70 µm, and it has a 45°-rotated square lattice with lattice constant a = 240 nm and hole diameter 2r = 170 nm. Figure 2(b) shows the simulated intensity of the beam at the output of the photonic crystal region at three different wavelengths. The separation of adjacent wavelength channels with wavelength difference ∆λ = 2.4 nm is evident from Fig. 2(b). For this structure, two non-idealities determine the crosstalk between these wavelength channels: (1) relatively strong side-lobes in the intensity profile introduced by the third-order diffraction effect in these structures [19], and (2) second#111848 - $15.00 USD
(C) 2009 OSA
Received 26 May 2009; revised 14 Jul 2009; accepted 29 Jul 2009; published 10 Sep 2009
14 September 2009 / Vol. 17, No. 19 / OPTICS EXPRESS 17062
order broadening at wavelengths away from the center wavelength of operation. These effects degrade the cross-talk isolation level from potentially higher than 12 dB (for non-distorted Gaussian beams with 2.4 nm spacing in the same structure) to around 6 dB. Figure 2(c) shows the effect of changing the width of the incoming optical beam in the same structure. Increasing the input beamwidth has two direct effects. On one hand, it directly increases the spatial extent of the beam at the output (even when the beam is not affected by diffractive broadening); on the other hand, it reduces the effect of both second-order and third-order distortions [19], by reducing the spatial frequency content of the beam. Figure 2(c) clearly shows both of these effects. The intensity of each plot in Fig. 2(c) is compared to its nondistorted Gaussian case; therefore, lower peak intensity for smaller beamwidths in this figure is an indication of more diffractive broadening. The optimal beamwidth, 2w0, can be determined by considering the trade-off between the original extent of the beam and its diffractive broadening inside the structure. In this particular design, we have chosen 2w0 = 4 µm as the waist of the input beam.
Fig. 1. (a) Schematic visualization of the wavelength separation in a focusing superprism photonic crystal spectrometer is shown. (b) Band structure of a 45°-rotated square lattice planar photonic crystal in SiN on oxide, with holes of 85 nm radius and a lattice constant of 240 nm is shown. Numbers on each contour are the corresponding wavelength for that contour. The shaded regions exclude the modes that leak to the substrate and are not confined to the SiN layer slab. The inset shows the relative direction of the lattice with respect to the principal lattice directions.
#111848 - $15.00 USD
(C) 2009 OSA
Received 26 May 2009; revised 14 Jul 2009; accepted 29 Jul 2009; published 10 Sep 2009
14 September 2009 / Vol. 17, No. 19 / OPTICS EXPRESS 17063
Fig. 2. (a) The configuration used for the simulation of optical beam propagation in a SiN PC is shown. A 45°-rotated square lattice photonics crystal with L = 70 µm, 2r = 170 nm, a = 240 nm is assumed. The thickness of the SiN slab is 205 nm, the incident angle is 13°, and the light has TE-like polarization. (b) Output beam profiles at different wavelengths (653.6 nm, 656.0 nm, and 658.4 nm) for input beam waist of 2w0 = 4 µm are plotted. The input beam is preconditioned to compensate the effect of second-order diffraction at 656 nm. (c) For the same structure as in part (b), output beam profiles at different input beam waists of 2w0 = 2.7, 4.0, and 6.0 µm are shown.
3. Implementation and experimental results To experimentally demonstrate the operation of these SiN spectrometer devices, we have used standard microelectronic fabrication facilities to pattern the planar SiN slab [20]. The process consists of electron-beam lithography (EBL) followed by CF4-based inductively coupled plasma (ICP) etching to transfer the desired pattern into the wafer. The stoichiometric SiN wafer used in our fabrication has a 205 nm (±5 nm) thick SiN device layer deposited on 6 µm of thermally grown silicon dioxide (SiO2). The SiO2 layer completely isolates the light in the device layer from the lossy silicon substrate. Figure 3(a) shows the scanning electron microscope (SEM) image of the fabricated structure consisting of a photonic crystal region, similar to the configuration in Fig. 2(a), and an array of waveguides at the output to spatially sample the beam profile and carry it to the output edge of the sample. Figure 3(b) shows the details of the photonic crystal structure fabricated in SiN. To characterize the performance of the device, we have used a tunable laser (New Focus Velocity TLB-6305) covering the 652-660nm wavelength range. The output beam from the laser source is collimated and focused using a 40× objective lens to the input facet of the sample to couple the light into the planar input waveguide. The input waveguide has an initial width of 2.5 µm at the input interface and is gradually tapered down to 500 nm to suppress #111848 - $15.00 USD
(C) 2009 OSA
Received 26 May 2009; revised 14 Jul 2009; accepted 29 Jul 2009; published 10 Sep 2009
14 September 2009 / Vol. 17, No. 19 / OPTICS EXPRESS 17064
higher-order modes in the input beam. The input waveguide is then tapered up to 4 µm, and is then terminated to an unpatterned SiN slab to launch the incident beam to the photonic crystal region. To precondition the beam, the input beam propagates and diffracts in the unpatterned SiN slab region before reaching the photonic crystal region [16]. The length of the preconditioning region in this structure is 1.1 mm; however, note that this length does not impose an intrinsic limit on the compactness of the structure, since, for example, it can be replaced by a curved mirror [22]. After passing through the photonic crystal, the output light from the photonic crystal region is coupled into an array of output waveguides with 3 µm spacing. The signal in these output waveguides is measured by imaging the output facet onto a single detector (using a 20× objective lens at the output). The signal from individual output waveguides is isolated using an iris and measured while the tunable laser scans the wavelength. Figure 4(a) shows the measured power in seven of the output waveguides that fall within the range of the available tunable laser.
Fig. 3. (a) SEM image of the fabricated structure is shown with a rotated PC region and an array of waveguides at the output. The incident beam is directed from a tapered waveguide from the left side of the device at an incident angle of 13° with respect to the interface of the photonic crystal region. (b) SEM image of the details of the photonic crystal region is shown. From SEM images, the lattice constant in the fabricated device is a = 240 nm, and the diameter of holes is 168 nm (compared to the 170 nm designed value).
From the measurement results in Fig. 4(a), we mark the wavelength of the peak of the beam intensity at each output and deduce the angular dispersion of the photonic crystal structure. Figure 4(b) shows the angle of refraction found from the measurement (solid line) and compares it with the estimated angle of refraction from the theoretical model (dotted line, based on the band structure calculations in Fig. 1). It can be seen that the measured dispersion matches the theoretical expectations closely. From Fig. 4(b) it can be observed that the device is operating in the negative refraction regime (as designed), and the angle of refraction changes rapidly with wavelength (strong superprism effect). Considering the 3 µm spacing between the adjacent output waveguides, the extent of the output beam intensity at each wavelength can be estimated from Fig. 4(a) to be around 5 µm. By comparing this beam extent with the initial beam waist (~4 µm) and the beamwidth at the input plane of the photonic crystal region (~80 µm), we can readily see that the device is working in the negative diffraction regime. These observations confirm the operation of the fabricated device in the desired operation regime. This fabricated device shows spatial separation of different wavelength channels with around 1.2 nm wavelength resolution in a 70 µm × 130 µm photonic crystal structure. To further validate the operation of the device, we have simulated the propagation of optical beams at different wavelengths in a photonic crystal structure with the parameters similar to our fabricated device. Note that the actual parameters of the fabricated device are slightly different from the design values because of the limited accuracy of the fabrication process. We have employed the in-plane band structure of the planar photonic crystal (calculated using a three-dimensional plane wave expansion method) and the envelope transfer function [18] to calculate the output beam intensity at different wavelengths (similar #111848 - $15.00 USD
(C) 2009 OSA
Received 26 May 2009; revised 14 Jul 2009; accepted 29 Jul 2009; published 10 Sep 2009
14 September 2009 / Vol. 17, No. 19 / OPTICS EXPRESS 17065
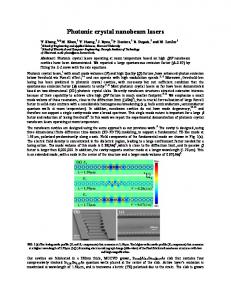
to what we did to obtain the results shown in Fig. 2). By integrating the beam power over ~3 µm intervals (i.e., the acceptance range of each output waveguide) at the output plane of the photonic crystal region, the channel responses (at output waveguides) is found. Figure 5 shows the calculated channel responses calculated with the same waveguide positions and spacing as the fabricated structure. By comparing Fig. 5 with Fig. 4(a), we can observe that the theoretical estimates and experimental results of the spatial extent of the beam and the level of side-lobes are in good agreement. Thus, we expect this theoretical model to accurately represent the performance of such spectrometers in future designs and perform as a reliable tool for estimating the spectral resolution and the isolation level.
Fig. 4. (a) Measured normalized transmission responses in adjacent channels are shown for seven output waveguides, showing a 3-dB wavelength resolution less than 1.2 nm. (b) The experimentally measured angle of refraction (solid curve) is shown and compared with theoretical prediction (dotted line). Theoretical results are corrected by a wavelength shift of 1.1% that accounts for the deviations of the thickness of the SiN slab and the size of holes from the designed values.
Fig. 5. Simulated channel responses of optical beams at different wavelengths (calculated at 50 pm wavelength steps) in a planar photonic crystal spectrometer are shown. All the parameters of the simulated structure are similar to the fabricated structure in Fig. 2. Similar to Fig. 4(b), the theoretical results are corrected by a wavelength shift of 1.1% to account for the deviations of the fabricated structure from the designed values. The simulated channel response for each output waveguide in these results is in good agreement with the experimental measurements in Fig. 4(a).
#111848 - $15.00 USD
(C) 2009 OSA
Received 26 May 2009; revised 14 Jul 2009; accepted 29 Jul 2009; published 10 Sep 2009
14 September 2009 / Vol. 17, No. 19 / OPTICS EXPRESS 17066
4. Discussion There are three major criteria for evaluating the performance of spectrometer devices and configurations: compactness, spectral resolution, and insertion loss. These parameters determine how well the spectrometer can perform in different applications, e.g., as a spectral analysis unit in a sensing platform or as a wavelength demultiplexer in an optical information processing system. The use of strong dispersion in photonic crystals provides the potential to implement a high resolution device in a small footprint. From Fig. 4(b), an angular dispersion factor (i.e., change in angle as a function of wavelength) of 2.3°/nm is observed, which is much larger than 0.17°/nm achievable in a conventional grating spectrometer realized in the same platform. This large angular dispersion factor further confirms the size advantage of the superprism-based photonic crystal spectrometers over alternative implementations. The angular dispersion in this device is almost twice as high as previous demonstration of the superprism effect in silicon nitride [21]. Furthermore, combining the superprism effect with the diffraction compensation scheme significantly improves the spatial separation (in a similar size) compared to the brute-force angular separation scheme (with diverging optical beams) in previous works [21]. Note that the structures shown in this work, which are optimized for compactness and high spectral resolution, are not necessarily the optimal designs in terms of insertion loss. We have observed less than 8 dB insertion loss (defined as total output power divided by total input power) in the device shown in Fig. 4. This insertion loss value is estimated by comparing the output power from all the output channels of the spectrometer with the power in a ridge waveguide fabricated on the same substrate and is accurate within ±1 dB (due to the limitations of our characterization setup). A considerable portion of the loss (> 4 dB) in the demonstrated photonic crystal spectrometer is caused by the choice of excitation of the structure using a terminated waveguide in the far-field. This loss can be significantly reduced by using a mirror with proper curvature as the preconditioning region at the input of the structure [22]. Further reduction of loss can be achieved by modifying the interface of the structure and by including matching stages [23, 24] to reduce the scattering and reflection losses when coupling the light into and out of the photonic crystal region. Furthermore, more elaborate fabrication processes, such as deep anisotropic etching the SiO2 layer underneath the SiN layer or undercutting the structure by wet etching can be used to further reduce the loss in the structure. We expect to considerably reduce this insertion loss by considering all these factors in the design and fabrication of these planar photonic crystal spectrometers. To compare the performance of the demonstrated spectrometer with the alternative implementations, we have fabricated spectrometers based on different operation principles on the same substrate. The structures being compared here are (1) the photonic crystal spectrometer studied earlier in this paper; (2) an arrayed waveguide grating (AWG) made by following the standard design in [25]; (3) the same AWG as in (2) after a resist reflow process [26] to reduce the sidewall roughness and reduce the waveguide propagation loss; and (4) a folded grating spectrometer operating in the first-order reflection grating mode [27]. All these devices are designed to have small footprints, and are fabricated in our group with the same fabrication recipe. The SEM images of these fabricated structures are shown in Fig. 6. To characterize the performance of each device, we have used the same measurement setup explained in Section 3. The resolution of each spectrometer is measured by scanning the wavelength of the input laser and measuring the power at each output waveguide. The insertion loss is also measured by comparing the total output power of the device with that of a straight waveguide fabricated on the same substrate. The performance of the devices, shown in Table 1, are compared using two main metrics: (1) compactness factor, Cλ = [lp(∆λ)3dB]−1, where lp is the length scale of the device and (∆λ)3dB is the spectrometer full-width half maximum wavelength resolution, and (2) insertion loss of the spectrometer. The compactness factor provides a measure that for a given wavelength resolution how compact each device is, and the insertion loss is the drop in the signal level while passing through the spectrometer. Note that in some practical situations, e.g., in a sensing platform [6], higher signal-to-noise
#111848 - $15.00 USD
(C) 2009 OSA
Received 26 May 2009; revised 14 Jul 2009; accepted 29 Jul 2009; published 10 Sep 2009
14 September 2009 / Vol. 17, No. 19 / OPTICS EXPRESS 17067
ratio at the output can be traded in favor of an effectively higher detectable wavelength resolution. Therefore, we can use the power-normalized compactness factor, Cλ /IL (listed in the last column of Table 1), as the main spectrometer comparison criteria. It can be observed that among these compact implementations, the photonic crystal spectrometer shows favorable performance even without employing further loss-reduction solutions. Note that this comparison between different device implementations cannot be viewed as an absolute measure for performance of such structures. All the different spectrometers demonstrated here have been designed with compactness as one of the major factors, and can be further optimized for better resolution and lower insertion loss. Nevertheless, the preliminary comparison of the performance of these structures under similar fabrication quality as presented in Table 1 provides a point of reference for future optimization of these devices. In our view, the compactness and insertion loss of the spectrometers as mentioned in Table 1, should be directly included in the performance measure of the device for future integrated spectrometer optimizations. Note that the operation range in the devices used in this paper is located at the crossing of the zeroth order and the first-order bands of the photonic crystal [28]. The modes in this operation region are hybrid modes mainly consisting of the zeroth order and first-order Bloch components. The transition of the dominant component from the zeroth order component to the first-order component is the main factor in the rapid change in the direction of propagation of the hybrid mode (and therefore, a strong superprism effect). In low-contrast SiN photonic crystal structures, compared to high contrast platforms such as silicon-oninsulator (SOI), the coupling between the zeroth order and the first-order components is weaker. This weaker coupling manifests itself in smaller available bandwidth and more higher-order diffractive distortion (and thus, lower cross-talk isolation) in spectrometer devices made in the low-contrast SiN photonic crystals. The higher-order diffraction effects distort the optical beam shape at the output of the device and causes relatively large channelto-channel cross-talk in these spectrometers. In principle, a multistage photonic crystal structure can be used to provide more degrees of freedom to control the beam shape and reduce the cross-talk. Currently, the applicability of this multistage scheme is, however, limited by the required fabrication accuracy in different regions of such multistage structure. The limited available operation bandwidth (around 10 nm) of the demonstrated SiN photonic crystal spectrometer (for example, compared to AWGs in which the operation bandwidth is easily scalable) is one of the shortcomings of the proposed scheme. However, the useful bandwidth of the photonic crystal spectrometer can be extended by using a cascaded scheme with a coarse wavelength demultiplexer in the first stage followed by compact high-resolution photonic crystal spectrometers to cover different bands. Table 1. The performances of SiN spectrometers based on different operation principles are compared.
Compactness factor,Cλ (nm.mm)−1 Photonic crystal 7.0 AWG-reflow 2.8 AWG 2.8 Grating-based 1.1
#111848 - $15.00 USD
(C) 2009 OSA
Insertion loss, IL (dB) 8.0 6.5 11 8.0
Cλ /IL (nm.mm)−1 1.1 0.63 0.22 0.17
Received 26 May 2009; revised 14 Jul 2009; accepted 29 Jul 2009; published 10 Sep 2009
14 September 2009 / Vol. 17, No. 19 / OPTICS EXPRESS 17068
Fig. 6. SEM images of alternative on-chip spectrometers implemented in SiN for comparison of spectroscopy performance are shown. (a) An AWG spectrometer with a size-scale of l = 300 µm and wavelength resolution of 1.2 nm. (b) A folded grating spectrometer with a size-scale of l = 600 µm and wavelength resolution of 1.5 nm. The inset magnifies a portion of the grating reflector that consists of a periodic pattern of air holes next to a wide trench [27].
5. Conclusions In summary, we have shown the potentials of planar photonic crystal devices as on-chip spectrometers in SiN. The demonstrated structures offer exceptional compactness and high spectral resolution performance as integrated components. A 3-dB spectral resolution of 1.2 nm and less than 8 dB insertion loss are experimentally observed in the 70 µm by 130 µm photonic crystal structure investigated in this work. It is shown that the demonstrated superprism-based photonic crystal spectrometers even without further optimization are advantageous over other compact implementations of spectrometers in SiN. Future steps to reduce the insertion loss in these devices are expected to further improve their performance. Acknowledgments This work was supported by the Air Force Presidential Early Career Award for Scientists and Engineers (PECASE), and by the National Science Foundation Faculty Early Career Development Award (NSF CAREER).
#111848 - $15.00 USD
(C) 2009 OSA
Received 26 May 2009; revised 14 Jul 2009; accepted 29 Jul 2009; published 10 Sep 2009
14 September 2009 / Vol. 17, No. 19 / OPTICS EXPRESS 17069