tions where pico- and nanophytoplankton dominated. At these stations approximately 75% of the primary production was processed by the microbial loop,.
MARINE ECOLOGY PROGRESS SERIES Mar Ecol Prog Ser
Vol. 125: 239-257,1995 P
I
Published September 14 -
P
P
Plankton community structure and carbon cycling on the western coast of Greenland during and after the sedimentation of a diatom bloom Torkel Gissel Nielsenl,*,Benni Hansen2 'National Environmental Research Institute, Department of Marine Ecology and Microbiology, Frederiksborgvej 399, PO Box 358. DK-4000 Roskilde, Denmark 2 ~ o s k i l d University, e Institute I, Life Sciences and Chemistry, PO Box 260, DK-4000 Roskilde. Denmark
ABSTRACT: Pelagic food w e b structure and carbon dynamics were studied in Disko Bay, western Greenland, following the breakup of the sea ~ c in e June-July 1992. Disko Bay was influenced by meltwater, and calm sunny weather heated the surface water from 0 to 6°C. lnitially a dlatom bloom was present throughout the p h o t ~ czone. Due to nutrlent depletion, and deepening of the surface layer, the bloom left the photic zone. Active bacter~oplanktonwas observed from the first s a m p l ~ n gBactenal production i.ncreased from a few percent to one-third of the primary production after the sedimentation of the bloom. The grazing impact by the copepod community was assessed by 2 independent methods. The gut fluorescence method and the egg production method resulted in copepod grazing estimates of about 80 and 4 5 % of the primary production d - l , respectively. Carbon budget considerations showed that the estimated protozooplankton grazing impact was comparable, or higher, than grazing by the Calanus spp. dominated copepod community. The observed importance of Arctic bacteria and protozooplankton stress that high latitude pelagic food webs potentially have the s a m e trophic complexity as low latitude pelagic ecosystems. KEY WORDS: Arctic pelagic food w e b budgets
Copepods . Protozoa . Bacteria . Grazing impact - Carbon
INTRODUCTION
The importance of bacteria and protozoans in the pelagic ecosystems has been documented during the last decade (reviewed by Fenchel 1988).In Antarctica, bacteria and the microbial food web are now incorporated into the pelagic food web (e.g.Azam et al. 1991). In the Arctic, however, most attention is still given to the large herbivorous copepods, which often form the bulk of the heterotrophic planktonic biomass. The literature contains much information on ecology and population dynamics of Arctic copepods, especially the Calanus spp. (reviewed by Smith & Schnack-Schiel 1990). Relatively little effort has been put into studies of the smaller heterotrophic components, and data sets
O Inter-Research 1995 Resale of full article not permitted
that allow comparison of standing stock and grazing impact of meso- and protozooplankton in the Arctic pelagic ecosystem are still lacking. Pomeroy & Deibel (1986) questioned the importance of bacteria in cold water ecosystems. Data from the spring bloom in Newfoundland (Canada) coastal waters indicated that bacterial activity was inhibited at temperatures below 4°C. They concluded that bacteria was less important in cold than in temperate waters. They suggested that a larger fraction of the primary production would therefore find its way directly to the metazoan consumers and to the benthic communities. However, Thingstad & Martinussen (1991) pointed out that the summer temperature in the Arctic is not very different from temperatures during the spring bloom in temperate waters, where the annual peaks in bacterial production are often observed (Lancelot & Billen 1984, Kuosa & Kivi 1989).
24 0
Mar Ecol Prog Ser
Studies of bacterial production in Arctic pelagic ecosystems have also shown that generation times and activity of the bacterioplankton are comparable to the rates obtained in low latitude ecosystems (e.g. Andersen 1988, Thingstad & Martinussen 1991).Despite this evidence, knowledge about the fate of bacterial production and the dynamics of the succeeding protozoan links in the food chain is limited. Information on abundance, biomass and species composition of Arctic pelagic protists is available for heterotrophic nanoflagellates (Thomsen 1982, Andersen 1988), ciliates (Paranjape 1987, Putt 1990) and heterotrophic dinoflagellates (Lessard 1991). These investigations illustrate that a diverse microbial community is present in the Arctic as in Antarctica (e.g.Garrison et al. 1993) and that microbial abundances are comparable with those in temperate ecosystems (Taniguchi 1984, reviewed by Pierce & Turner 1992).To our knowledge, the only simultaneous measurements of all microbial loop components in the Arctic were carried out by Andersen (1988)during a case study in the North BeringKhukchi sea. He concluded that the microbial loop played a n important role in the carbon flow at stations where pico- and nanophytoplankton dominated. At these stations approximately 75% of the primary production was processed by the microbial loop, whereas only about 5 % was processed by the microbial loop at diatom-dominated stations. Unfortunately, the study lacks information on the grazing potential and the mesozooplankton biomass, which previously was considered the most important pathway. The annual phytoplankton succession in Arctic pelagic ecosystems without persistent fast ice is similar to succession in temperate ecosystems (Smith & Sakshaug 1990): after the spring bloom has depleted the surface water of nutrients, the primary production is dependent on nutrients remineralized in the surface water until the breakdown of stratification during the fall. An important difference between the 2 ecosystems is the large population of overwintering copepods, with a significant potential for grazing on the spring bloom (e.g. Tande 1991). Here we present measurements of the standing stocks and the carbon flow within both the classical and the rnicrobial food web along the west coast of Greenland. Our aim is to evaluate the role of the microbial food web in the carbon cycling of an Arctic ecosystem.
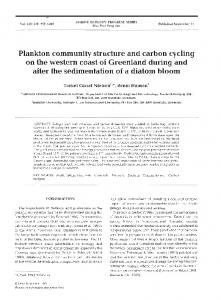
MATERIALS AND METHODS Study site. This investigation was conducted from 22 June to 6 July 1.992, approximately 1 nautical mile off Godhavn harbour (69" 15' N, 53" 33' W) at 200 m depth in Disko Bay at the west coast of Greenland
(Fig. 1). During the investigation the station was visited on 10 occasions by the RV 'Porsild' (Arctic Station, University of Copenhagen). Sampling. Sampling was conducted around local noon. Vertical profiles of salinity, temperature and fluorescence were obtained from the surface to 30 m. Temperature and salinity were recorded using a temperature and salinity (LF 191, Mobro Instr.) probe, and chlorophyll a (chl a) fluorescence was measured with a Hardt fluorometer. Light attenuation was estimated from Secci disk depth. From the vertical distribution of temperature, salinity and fluorescence, 5 to 6 depths in the upper 30 m were selected for chemical and biological measurements. Nutrients. Duplicate samples for the determination of nutrient concentration (NOp-,NO3-, P o d 3 - ,SiOd3-) were fixed by 2 drops of chloroform and deep frozen. After arrival at the laboratory, the nutrient concentration was measured on an automatic nutrient analyser (Dansk Havteknik) following Grasshoff (1976). Chlorophyll a. Samples of 1 to 2 1 for chl a measurements were placed in the dark and within 3 h after collection filtered onto GF/F filters, extracted in 96% ethanol (Jespersen & Christoffersen 1987) and measured spectrophotometr~cally (Strickland & Parsons 1968).The in situ fluorometer measurements were calibrated against the spectrophotometrically determined chlorophyll content in the water samples, and a linear regression was conducted (r2= 0.7, n = 56). The chl a fraction > 11 pm was measured as the concentration of chl a in the water after gentle filtration through 11 pm Nitex screen. The phytoplankton carbon content was estimated from volume measurements using an inverted microscope and a conversion factor of 0.12 pg C pm-3 (Edler 1979). In addition to the absorption measurements required for the determination of chl a, absorption was also measured at 480 nm. Changes in the ratio of absorption of 480:665 nm indicate the nutritional status of the phytoplankton cells, where values above 2 indicate that the phytoplankton is nutrient limited (Heath et al. 1990). Primary production. Primary production was measured in situ with the 14Cmethod. Water samples from the various depths were incubated for 2 h around noon in 2 light and 1 dark Jena bottles (100 ml), and 4 pCi HI4CO3- (International Agency for I4C Determination) was added to each bottle. After the incubation the bottles were kept dark, and filtration began within 1 h. The entire contents of each bottle were pressurefiltered ( < l 0 0mm Hg) through 25 mm GF/F filters. The filters were placed in scintillation vials, inorganic 14C was removed by adding 200 p1 of l N HCI, and the samples were kept frozen until counting. Excess inorganic I4C was removed by applying a flow of air into the vials shortly before scintillation fluid was added.
Nielsen & Hansen: Arctic plankton community structul-e
24 1
Fig. 1. Map showing approximate position of the station investigated
Filtercount (Packard Instr.) was added to the filters, and incorporated 14Cwas measured by liquid scintillation counting (LKB Vallac 1219 Rackbeta) with the external standard method. The total CO2was assumed to be 2.1 pM (Richardson 1991). Daily primary production was calculated by multiplying with a light factor: total daily insolation divided by insolation during the incubation period (e.g. Vadstein et al. 1989, Harrison et al. 1991). Light measurements were performed every 30 min with a Solar Radiation Sensor 2770 (300 to 2500 nm) (Aanderaa Instr., Bergen, Norway) situated at the Arctic Station, Godhavn. Carbon fixation is presented after subtracting the dark fixation values, and without subtracting any respiration. The daily primary production per m2 was calculated by trapezoidal integration over the depth strata down to 32 m (Nielsen & Bresta 1984). Bacteria. Bacteria were counted using the acridine orange technique (Hobbie et al. 1977). At least 400 cells were enumerated on each filter using an Olympus BH-2 epifluoresence n~icroscope.The volume was estimated from length and width measurements of 50 cells per filter and converted to carbon using a conversion factor of 0.35 pg C pm-3 (Bjornsen 1986).
Bacterial production was measured by incorporation of 3H-thymidine (Fuhrman & Azam 1980). Immediately after sampling, triplicate samples (10 ml) were incubated with 5 nM methylL3H-thymidine (20 pCi nmol-l, New England Nuclear) for 1 h at in sltu temperature. Blanks were prepared by addition of formalin prior to addition of isotope. The incubations were stopped by the addition of buffered formalin (1% final concentration). Samples were then filtered onto 0.2 pm cellulose nitrate filters, washed 10 times with 5 % ice-cold TCA and counted by liquid scintillation counting. The incorporated 3 ~ - t h y m i d i nwas e converted to cell production using a factor of 1.1 X 10¹⁸cells mol-' thymidine incorporated (Riemann et al. 1987). To test whether the incubation time was appropriate, we incubated triplicate sanlples from the same station for 1 and 2 h; the incorporation in each sample was the same. Nanoflagellates. The abundance of autotrophic and heterotrophic nanoflagellates was determined by epifluorescense microscopy on filters stained by proflavine (Haas 1982). Samples were fixed by 1 % glutaraldehyde. The diameters of 100 cells per filter were measured, and biomass was calculated assuming spherical shape and a conversion factor of 0.12 pg C
Mar Ecol Prog Ser 125:239-257, 1995
pm-3 (Edler 1979). Clearance rates were estimated as 105 body volume h-', converted to in situ temperature by a Q,,, of 2.5. Growth rates were estimated by assuming 40% efficiency (Fenchel 1986). Ciliates and heterotrophic dinoflagellates >20 pm. The samples (200 ml) were fixed in l % acid Lugol's solution and counted after 24 h sedimentation using inverted microscopy. Identification of ciliates to species or morphotypes was based on Leegaard (1915), Kahl (1932) and Lynn et al. (1988).The dinoflagellates were identified according to Dodge (1985). Dinoflagellates l 1 pm in the surface water
clear skies rapidly heated the surface water and facilitated the development of a strong thermocline (Fig. 2A,
R).
Depending on the character of the ice and snow cover, the spring bloom in Disko Bay off Godhavn is initiated in April-May a n d sediments out of the photic zone after about 2 wk (Andersen 1981b). On the first sampling date the thermocline was weak, but the nutrient concentration was low. High chl a and primary production (Fig. 3A, B) was recorded throughout the photic zone. This indicates that the bloom was initiated under the ice as observed by Petersen (1964) and Andersen (1983.a) in years with late ice breakup. The productive period off Godhavn normally lasts from the beginning of April to November (Petersen 1964, Andersen 1981a). The spring bloom develops between mid-April and mid-June and lasts for 2 wk. Associated with temporal mixing of the surface water a n d intrusion of nutrients to the surface water, several minor blooms can develop later in the year. However, the stable weather conditions a n d t.he strong stratification during our investigation effectively sealed the nutnents in the deep water.
Nielsen & Hansen: Arctic plankton community structure
During the first part of the bloom the daily primary production was 690 450 mg C m-' d - ' , within the range of the 3 previous investigations in the area: 200 to 350 mg C m-2 d - ' (Steemann Nielsen 1958), 300 to 600 mg C m - l d - ' (Petersen 1964) and 500 to 1500 mg C m - 2 d - I (Andersen 1981a). Thereafter the prlmary pro-
25 1
depleted. Silicon is to a great extent exported from the photic zone as dlatom frustules in copepod faecal pellets. Because regeneration of silicon is much slower than nitrogen in the surface the diatom bloom left the photic zone when the silicon source became depleted.
'
duction declined to 300 * 30 mg C m - 2d - as the bloom became nutrient depleted and left the photic zone. The size distribution of the primary producers in Disko Bay was investigated by Andersen (1981b) throughout the productive season: during the spring bloom, phytoplankters >56 pm dominated the biomass and contributed more than 90% of the primary production. The nutrient depleted period after the bloom was characterized by dominance of smaller cells ( 11 pm. However, during the microscopic examination ciliates were often observed with small diatoms (15 to 20 pm) in their food vacuoles.
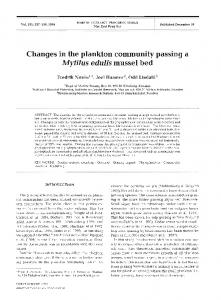
m Copepods
Phytoplankton s l, l ,hv m ,, ,
Phytoplankton
Cillates
I
Phytoplankton
Het nanoflagellates
11.0
Het d~nofl.
13.1
Phytoplankton < llpm
Flg 11 Carbon flow budgets ( A ) before and (B) after sedlmentatlon of a dlatom bloom In Dlsko Bay The f ~ g u r eIS based on the data shown In Tables 3 & 6 Numbers in boxes show average biomass ( m g C m-3) a n d numbers on the arrows enterlng a n d leaving the boxes represent lngestlon a n d production respectively ( m g C m-3 d.')
Nlelsen & Hansen: Arctic plankton community structure
Recent lnvestigations have stressed the potential importance of the heterotrophic dinoflagellates in the plankton dynamics of temperate (Smetacek 1981, Hansen 1991, Verity et al. 1993), subtropical (Lessard 1991), and Antarctic waters (Bjsrnsen & Kuparinen 1991). So far, heterotrophic dinoflagellates have received little attention in the Arctic. However, in Dlsko Bay the heterotrophic dinoflagellates accounted for about 50%)of the protozooplankton biomass, with nanodinoflagellates comprising about half of the total dinoflagellate biomass (Table 3). High abundance of large dinoflagellates is often associated with blooms of diatoms (Smetacek 1981, Hansen 1991). The now widely accepted hypothesis of the microbial loop is based on the existence of a fixed size ratio between planktonic predators and their prey of 10:l (Azam et al. 1983). However, recent investigation has questioned this assumption, because important groups such as the heterotrophic dinoflagellates can graze on very large prey items (Hansen et al. 1994b). The larger heterotrophic dinoflagellates (>20 pm) were dominated by the naked Gyrodinium spirale (ESD 35 to 40 pm), with a prey size spectrum ranging from about 5 pm ESD to particles up to 5 times its own cell volume (Hansen 1992). This wide prey size spectrum enables the dinoflagellates to exploit all the size classes of the phytoplankton present during this study. Before and after the bloom left the photic zone 87 to 180'14, of the primary production was ingested by protozooplankton per day (Fig. 11).These grazing estimates are comparable to the few existing studies of the significance of Arctic microzooplankton. In a study of the quantitative importance of the microbial loop in the North Bering Sea, Andersen (1988) found that the ciliates grazed between 1 and 77% of the daily primary production. The highest grazing pressure was found at stations dominated by pico-nanoplankton and the lowest at diatom-dominated stations. During that study the impact of the heterotrophic dinoflagellates was not considered. Paranjape (1987) studied the grazing impact of the microzooplankton by the dilution method in Baffin Bay, in a situation where the phytoplankton was dominated by small diatoms as during the present study, and found daily grazing rates of 37 to 114% of the primary production. For temperate waters most of the estimates of microzooplankton grazing impact during the summer range from 40 to > l o o % of the daily primary production (Pierce & Turner 1992, Nielsen et al. 1993, Nielsen & Kiarboe 1994). Thus the potential importance of protozooplankton in the Arctic pelagic food web is not different from that in low latitude ecosystems. Planktonic ciliates potentially compete with the heterotrophic dinoflagellates for the primary producers as prey. However, the maximum prey size that naked and
loricate oligotrichs can ingest is limited to about 45 O/o of their oral diameter (Heinbokel 1978, Jonsson 1986). This suggests that the dominating Strombidium spp. and Lohrnaniella spp. with an oral diameter of 40 to 50 pm only exploited the nanoflagellates and the smaller diatoms c 2 0 pm. The implication of this is that the cillates primarily compete with the nanodinoflagellates (