watershed model. W. T. DICKINSON, R. P. RUDRA, D. N. SHARMA & S. M. AHMED. Professor, Associate Professor, Postdoctoral Fellow, and Graduate Student,.
Erosion and Sediment Transport Monitoring Programmes in River Basins (Proceedings of the Oslo Symposium, August 1992). IAHS Publ. no. 210, 1992.
_ 343
Planning sediment monitoring programs using a watershed model W. T. DICKINSON, R. P. RUDRA, D. N. SHARMA & S. M. AHMED Professor, Associate Professor, Postdoctoral Fellow, and Graduate Student, School of Engineering, University of Guelph, Ontario NIG 2W1 Canada ABSTRACT In recent years there has been much concern about elevated levels of stream sediment concentrations and loads, and associated pollutants, emanating from nonpoint agricultural sources in the Great Lakes Basin of North America. This concern has led to the implementation of soil erosion and sediment control programs to reduce loadings of sediment and phosphorus reaching outlet streams and lakes. Sediment monitoring programs have been put in place to ascertain sources of the sediment and to evaluate the effectiveness of the control programs; but questions have arisen, such as: Where should monitoring be conducted for the purposes of determining sediment sources and for evaluating remedial measures and strategies? GAMES, The Guelph model for evaluating the effects of Agricultural Management systems on Erosion and Sedimentation, has been applied to a small rolling upland agricultural watershed in southern Ontario. Output from this model application provides mappings of the expected spatial distributions of the sources of erosion and sediment yields, and anticipated reductions in basin sediment loads resulting from the implementation of remedial soil and crop management measures. It is revealed that a monitoring program planned with regard to such model results is desirable if not required to ascertain sediment sources and the effectiveness of control programs.
INTRODUCTION The International Reference Group on Great Lakes Pollution from Land Use Activities (PLUARG) concluded that the Great Lakes are being polluted by sediments from land drainage sources (Berg & Johnson, 1978). There has continued to be much concern about agricultural nonpoint source pollution, and there have been attempts to implement remedial programs (Wall et al, 1989). This concern and such programs have led to renewed interest in the development of new or enhanced stream monitoring networks to: (i) ascertain the sources, concentration and loads of sediment, and (ii) evaluate the effectiveness of management practices put into place to control downstream sediment loads. The establishment of such monitoring networks, however, are problematical: they are extremely expensive to implement and manage; and there have been some real questions whether the data collected are sufficiently accurate and precise to provide useful conclusions regarding the likely effectiveness of control measures (Dickinson & Green, 1988). Watershed nonpoint source pollution models have been used to identify sources of agricultural pollution (Dickinson et al, 1989; Snell, 1984), and to evaluate the expected impact of remedial measures (Beasley et al., 1980; Cook et al, 1985; Knisel et al., 1980) and strategies for implementing such measures (Dickinson et al., 1990). It is the position of this paper that output from such NPS models can also be used very effectively for the design of efficient monitoring networks. Such an approach is illustrated by an application of the GAMES model to a small agricultural watershed in southern Ontario.
344
W. T. Dickinson et al.
THE NPS MODEL GAMES, the Guelph model for evaluating effects of Agricultural Management systems on Erosion and Sedimentation, was used in this study (Rudra et al., 1986). In GAMES, the watershed is discretized into land cells of various shapes and sizes, each cell having homogeneous characteristics of soil type, slope class, crop/land use and hydrology. Stream cells are also identified as conduits for transport of sediment. The model has been oriented to a watershed spatial scale and a seasonal time frame. GAMES has two basic components: (i) a soil loss component, and (ii) a sediment delivery component The sediment yield measured at the watershed outlet is calculated with the equation
SY, =i E F - J =i EfV^R-J where DR = As
=
(i)
seasonal microscopic sediment delivery ratio between the land cell and a stream, potential soil loss from the ith land cell:
and As = 2.242RS-KS-(LS)S-CS-PS where R
(2)
=
the seasonal rainfall runoff factor, expressed as the rainfall erosion index for the region under consideration [(hundreds of foot/ton/inch)/(acre/hour)], K,. = the seasonal soil credibility factor, expressed as the soil loss per unit erosion index unit for a specified soil, as measured on a unit plot (22 m long with a 9% slope gradient), [(ton/acre/)/hundred of acre/foot/ton/inch)], LSS = the seasonal topographic factor, expressed in terms of L, a slope length factor, and S, a slope gradient factor, (ratio of soil loss from the field slope length and field slope gradient to that from a 22 m and 9% slope under identical situation), Cs = the seasonal cover and management factor, expressed as the ratio of soil loss from an area with specified soil cover and management to that from an identical area in tilled continuous fallow, Ps = the support practice factor, expressed as the ratio of soil loss with a support practice (e.g. contouring) to that with straight-row farming up and down the slope, and 2.242 = a conversion factor from ton/acre to t/ha. The seasonal sediment delivery ratio varies inversely with the travel time of overland flow from the land cell to the stream (Clark, 1981; Dickinson et al., 1986). DR depends upon the surface roughness and the slope gradient along the length of the flow path, and upon the probability to generate runoff on the land cell. The sediment delivery ratio can be written as DRS = a( tj P
(3)
where oc,P = parameters of the expression, ^ = the travel time representative of the land cell's delivery to the stream cell, and (4)
where ns = S = Hcs = L =
the seasonal Manning's roughness coefficient for land cell i (s/m1/3), the slope of the flow path across the ith land cell, the seasonal hydraulic coefficient of the ith land cell, and the length of the flow path across the ith cell.
Planning sediment monitoring programs using a watershed model TABLE 1 Summary of GAMES input data for the Stratford Avon watershed. Soil Type
Brookston Silt Loam Harrison Silt Loam Perth Silt Loam Huron Clay Loam Parkhill Loam Waterloo Sandy Loam
Ks
OM (%)
Land Use
Cs
0.48 0.48 0.48 0.21 0.33 0.48
4.50 4.50 4.50 4.00 3.20 3.20
Grain Corn Silage Corn Small grains Hay/pasture Woodlot Recreational Gravel pits
0.503 0.503 0.335 0.020 0.010 0.200 0.000
Manning's n 0.07 0.07 0.04 0.20 0.65 0.10 0.20
STUDY AREA AND DATA BASE To illustrate the utility of a modelling approach to the design of a sediment monitoring network, GAMES was applied to an upland rolling area, the Stratford Avon Demonstration Watershed. This watershed was extensively studied during the PLUARG program (Wall et al.. 1978; Wall et al., 1979). The Stratford Avon Watershed encompasses 537 hectares of rolling upland loamy soils, predominantly under corn cultivation (Rousseau et al. 1988; Dickinson et al. 1990). Fall ploughing has been practised in the watershed, with few if any conservation practices in place until quite recently. Since about 80% of the sediment loads in this basin have been observed to occur during the late winter and early spring period (February - May), GAMES was applied only for conditions characteristic of that period. A summary description of the watershed, including relevant input data, is given in Table 1. Input data for the application of GAMES were developed using the following procedure: (a) Land use, soils and land slope information was independendy ascertained from available maps, areal photographs, and field surveys. Watershed maps for each of these variables were prepared at a base scale of 1:5000. (b) A composite mapping of land use, soils and land slope was developed for each basin, to divide each watershed area into irregular, field-scale cells, each of which was characterized by a single land use, a single soil type, and a single class of slope. The Stanford Avon Watershed was discretized into 402 land cells and 63 stream cells: (c) Values for the various factors in GAMES, given in Table 1, were assigned to each land cell. The data set to run the soil loss and sediment delivery components of GAMES was available for the watershed.
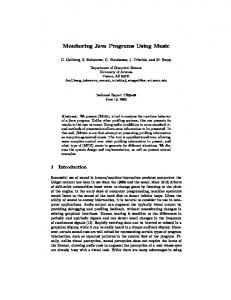
MODEL OUTPUT AND RESULTS Sample output maps from the application of GAMES are presented in Figures 1 and 2, with a summary of some results given in Table 2. Figure 1 reveals the spatial pattern of potential soil loss for the spring period. The estimated average spring watershed gross erosion rate of 4.8 t/ha is not very large for an upland basin. However, the individual field erosion estimates are quite spatially variable, ranging from essentially zero to 25 t/ha. It is also evident from Figure 1 that a major portion of the eroded soil moves within a small percentage of the basin, in localized areas. Eighty three percent of the
345
346
W. T. Dickinson et al.
FIG. 1 Mapping of expected spring soil erosion rates.
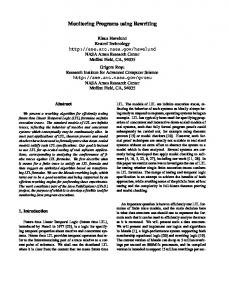
spring sheet and rill erosion volume is estimated to occur in 32% of the watershed area, 58% occurring in 15% of the area. The spatial distribution of sediment yield is presented in Figure 2 for the watershed. Similar to the erosion picture presented above, but more pronounced, a great majority of the spring sediment loads leaving the watershed is estimated to emanate from a small percentage of the watershed area: 79% of the sediment load is generated in 17% of the basin, and 66% in 11% of the area. Figure 2 clearly reveals that the watershed is characterized by very distinct sediment sources. In light of the variability in erosion and sediment yield rates possible in a rolling agricultural watershed, and the localization of soil erosion and sediment yield "hot spots", it is not surprising to discover that the expected impact of remedial soil and crop management measures is very much a function of where such measures are implemented on such a watershed. A summary of some model results in this regard is presented in Figures 3 to 6.
Planning sediment monitoring programs using a watershed model
347
STRATFORD AVON Sed i ment RaIi ng < 0.25 t/ha 0.25 - 0.50 l/ha 50 - 1.00 l/ha - 2.00 t/ha
FIG. 2 Mapping of expected spring sediment yield HT rates.
> 2.00 t/ha
TABLE 2 Summary of results from GAMES for the Stratford Avon Watershed. Yield
Erosion Rating (t/ha)
(ha)
(%)
< 1.25 1.25 - 2.50 2.50 - 5.00 5.00 - 10.0 > 10.0
242.98 51.83 70.61 92.58 79.00
45.25 9.65 13.15 17.24 14.71
89.54 97.62 244.57 660.66 1483.28
3.47 3.79 9.49 25.65 57.58
Sediment rating S i o « « M
5
e« TR1C200
TR1C100
TR1C075
TR2C200
TR1C050
TR2C100
TR2C075
TR2C050
Treatments
Treatments
FIG. 5 Effect of remedial treatment applied to targetted portion of subwatershed C.
60
50
40
30
20
10
TR1200
TR1100
TR1075
Treatments
TR1050
TR2200
TR2100
TR2075
TR2050
Treatments
FIG. 6 Effect of remedial treatment applied to targetted portion of entire watershed.
350
W. T. Dickinson et al.
the sediment load leaving the basin involves focusing on subwatershed C, and by using spring ploughing with residue. Using this treatment (TR2) on fields in subwatershed C exhibiting sediment yields greater than 2.0 t/a results in the treatment of 3 percent of the basin area, and a reduction in basin sediment load of 18 percent. For TR2 on fields with yields greater than 0.50 t/ha, the area treated becomes 6 percent and the percentage load reduction 25 percent. Even the application of cross-slope tillage (TR1) in fields in subwatershed C with yields greater than 0.50 t/ha (i.e. 6 percent of the total basin) might be expected to reduce the basin spring sediment load by 16 percent. Treating the highest sediment yielding fields in subwatersheds A and B can also be expected to offer reductions in the basin load, but these impacts are noticeably smaller than for treatments in subwatershed C. For example, spring ploughing introduced to fields in subwatersheds A, B, and C which are estimated to yield greater than 0.75 tonnes of sediment per hectare is likely to reduce the total watershed sediment load by 15, 11, and 22 percent, respectively. All modeling results noted above have considerable significance when viewed from a monitoring perspective. As noted in the introduction, data collection is being undertaken, or being considered, in a number of agricultural areas to ascertain the sources of contaminants such as sediment and/or to determine best management practices and strategies to reduce such pollution. In situations where nonpoint pollution sources are localized, and associated contaminant yields are very variable, as in rolling upland watersheds such as the Stratford Avon Watershed, it is clear that the most efficient monitoring strategy to either ascertain sources or evaluate remedial
.
:
t
u
V
%
Ê
\
\ s \
JL-J " " 7
)
STRATFORD AVON A,B,,C
FIG. 7 Identification of subwatersheds A, B, and C.
Stream Sub-watersheds
Planning sediment monitoring programs using a watershed model strategies would involve the collection ot data for critical subcatchments, as suggested by the model output. For example, monitoring at the outlet of subwatershed C (in Figure 7) would be invaluable for this purpose; and would provide much more information on source confirmation and the value of remedial treatments in such a key source area than monitoring only at the outlet of the total basin. CONCLUDING COMMENTS From the example application of GAMES presented in this paper it has become clear that an efficient monitoring strategy for nonpoint source pollution is linked to the spatial variability of contaminant yields and the associated locations of key source areas. Such variability and localization are related to physiographic, land use and contaminant use factors. Therefore, output in this regard generated by an NPS model such as GAMES provides an invaluable framework for the establishment of a monitoring networks which provides useful information for relatively low cost. REFERENCES Beasley, D.B., Huggins, L.F., & Monke, E.J. (1980) ANSWERS: A model for watershed planning. Transactions of ASAE, 23:938-944. Berg, N.A. & Johnson, M.G. (1978) Environmental management strategy for the Great Lakes system. Final report to the DC from PLUARG, International Joint Commission, Windsor, Ontario. Clark, D.J. (1981) An expression for determining sediment delivery ratio. M.Sc. Thesis, University of Guelph, Guelph, Ontario. Cook, D.J., Dickinson, W.T. & Rudra, R.P. (1985) A microcomputer model for the evaluation of conservation systems. ASAE Paper No. 85-2044, American Society of Agricultural Engineers, St. Joseph, Michigan. Dickinson, W.T. & Green, D. (1988) Characteristics of sediment loads in Ontario streams. Canadian Journal of Civil Engineering, 15:1067-1079. Dickinson, W.T., Rudra, R.P. & Clark, D.J. (1986) A delivery ratio approach for seasonal transport of sediment. IAHS Publication No. 159, Drainage Basin Sediment Delivery, 237251. Dickinson, W.T., Rudra, R.P. & Wall, G.J. (1990) Targeting remedial measures to control nonpoint source pollution. Water Resources Bulletin, 26(3):499-507. Dickinson, W.T., Rudra, R.P. & Wall, G.J. (1989) Simulation of remedial measures and remedial strategies for soil conservation. ASAE Paper No. 89-2045, American Society of Agricultural Engineers, St. Joseph, Michigan. Environmental Systems Research Institute (ESRI), Inc. (1989) ARC/INFO (Geographical Information System), Redlands, California Knisel, W.G., Jr., CREAMS: a field scale model for chemicals, runoff, and erosion from agricultural management systems, USDA-SEA, Conservation Research Report No. 26, 486-492. Menzel, R.G. (1980) Enrichment ratios for water quality modelling, in CREAMS: a field scale model for chemicals, runoff and erosion from agricultural management systems. Chapter 12, Volume 3, USDA-SEA, Conservation Research Report. Miller, M.H. & Spires A. (1978) Contribution of phosphorus to the Great Lakes from agricultural land in the Canadian Great Lakes basin. PLUARG report, Task group C (Canadian section), Activity-1, Agricultural watershed studies - Phosphorus integration report, International Joint Commission, Windsor, Ontario.
351
352
W. T. Dickinson et al.
Ontario Ministry of Agriculture and Food (OMAF), (1975) Ontario soils - Physical, chemical and biological properties and soil management practices. Publication 492, Agdex 500, OMAF, Toronto, Ontario. Rousseau, A. (1985) Development of a phosphorus transport model for small agricultural watersheds. M.Sc. Thesis, University of Guelph, Guelph, Ontario. Rousseau, A., Dickinson, W.T., Rudra, R.P. & Wall, G.J. (1988) A phosphorus transport model for small agricultural watersheds. Canadian Agricultural Engineering, 30:213-220. Rudra, R.P., Dickinson, W.T., Clark, DJ. & Wall, G.J. (1986) GAMES - A screening model of soil erosion and fluvial sedimentation in agricultural watersheds. Canadian Water Resources Journal, 11(4):58-71. Sharpley, A.N. (1980) The enrichment of soil phosphorus in runoff sediments. Journal of Environmental Quality, 9:521-526. Snell, E.A. (1984) A manual for regional targeting of agricultural soil erosion and sediment loading to streams. Working Paper No. 36, Land Directorate, Environmental Conservation Service, Environment Canada, Ottawa, Ontario. Spires, A. & Miller, M.H. (1978) Contribution of phosphorus from agricultural land to streams by surface runoff. PLUARG report, Task group C (Canadian section), Activity-1, Agricultural watershed studies - Report #18, International Joint Commission, Windsor, Ontario. van Vliet, L.P.J., Wall, G.J. & Dickinson, W.T. (1978) Erosion losses and sediment delivery ratios for agricultural watersheds. DC Technical Report re: Great Lakes pollution from land use activities, International Joint Commission, Windsor, Ontario. Wall, G.J., Dickinson, W.T. & van Vliet, L.P.J. (1979) Agricultural sources of fluvial suspended sediments. Progress in Water Technology, 11(6):481-499. Wall, G.J., Logan, T.J. & Ballantine, J.L. (1989) Pollution control in the Great Lakes Basin: An international effort, Journal of Soil and Water Conservation, 44:12-15. Wall, G.J., van Vliet, L.P.J. & Dickinson, W.T. (1978), Contribution of sediments to the Great Lakes from agricultural activities in Ontario. IJC Technical Report re: PLUARG, International Joint Commission, Windsor, Ontario. Wischmeier, W.H. & Smith, D.D. (1978) Predicting rainfall erosion losses - A guide to conservation planning. Agricultural Handbook No. 537, USDA, Washington, D.C.