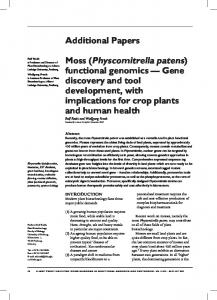
Fluorescence microscope image of Physcomitrella moss cells showing two stomata (fluorescing in green) and the chlorophyll of the chloroplasts (fluorescing in ...
3 Plant Proteomics Eric Sarnighausen and Ralf Reski
Summary An understanding of gene function requires a complementation of gene and gene expression analysis by the systematic analysis of proteins. Progress in plant proteomics has been lagging behind animal and microbial proteomics due to the lack of plant genome data and the problems involved in successful protein extraction from plant material. With the sequencing of more and more plant genomes, this slow progress will soon be overcome. The moss Physcomitrella patens is a model organism in the field of plant functional genomics. P. patens is the first seedless plant for which the complete genome was sequenced. Genome annotation is currently in progress. While identification of proteins requires knowledge of all coding genes of the organism under study, gene annotation and functional characterization benefit greatly from the findings of proteome analysis. The proteome of P. patens is accessible and approaches are under way to increase the spectrum of proteomic methods applied to this plant. Here we provide a protocol for the extraction of proteins from P. patens and describe the basic and still most important method of proteome analysis, twodimensional polyacrylamide electrophoresis of proteins. As this technique (not entirely unjustifiably) has the reputation of being unpredictably complicated, we provide a detailed protocol intended to reduce the reluctance that many scientists may have in using this technique.
Key Words: Plant proteomics; Physcomitrella patens; protein extraction; two-dimensional electrophoresis; isoelectric focusing; SDS–PAGE.
1. Introduction Progress in the field of plant proteomics has always lagged behind research in the animal or microbial field (1). There are numerous reasons for this. Compared with multicellular organisms, proteomes of unicellular prokaryotes From: Methods in Molecular Biology, vol. 484: Functional Proteomics: Methods and Protocols Edited by: J. D. Thompson et al., DOI: 10.1007/978-1-59745-398-1, © Humana Press, Totowa, NJ
29
30
Sarnighausen and Reski
and eukaryotes are of reduced complexity and therefore more easily accessible; at the same time these were the first organisms for which the genome sequences were available. Furthermore, there is hardly any material that is more reluctant to proteome analysis than plant tissue. The presence of a rigid cell wall, which is often enforced through deposition of strengthening substances, like lignin (wood), suberin (cork), or inorganic salts (calcification), can render tissue disruption problematic. Compared to animal tissue, protein content in most parts of the plant is rather low. On the other hand, plants contain a multitude of substances that interfere strongly with a successful protein extraction process; foremost among these are phenolic compounds, organic acids, and proteases— compounds that tend to modify, inactivate, precipitate, aggregate, or degrade proteins in crude extracts. Consequently, special techniques are required to disrupt the cell walls and to protect proteins from damaging components released on breakage. A direct single-step extraction of proteins, which is a general procedure when working with bacteria (2), yeast, or animal tissue (3), is therefore hardly ever the best choice for workers in the plant field (4). The ultimate goal is to separate the total proteome from substances that interfere with proteome analysis while at the same time avoiding quantitative or qualitative modification of the proteome during this process. As protein extraction procedures can hardly be automated, plant proteomics requires extensive processing at a step that is considered most critical for the generation of reproducible results. Protein purification procedures, required for the analysis of the plant proteome, will inevitably be selective for certain proteins and will at the same time discriminate others (5). Among the most commonly used plant protein extraction procedures are acetone/trichloroacetic acid (TCA) precipitation (6), phenolic extraction (7), and extraction of soluble proteins in combination with acetone or TCA precipitation (8). While all these procedures can render high quality separations of proteins on two-dimensional gels, protein spot patterns obtained from the same tissues display considerable variations if extraction methods are varied (9,10). Another problem researchers in plant proteomics have to face is the unequal distribution of the concentration of distinct protein species among the plant proteome. Proteins related to the photosynthetic apparatus can represent far more than 50% of the total protein mass in plants and will always dominate in the separation patterns while low abundant proteins are likely to escape detection (5). The moss Physcomitrella patens (Fig. 1A) has emerged as a model organism in the field of functional genome analysis. P. patens is unique among land plants as its nuclear genes can be directly targeted due to highly efficient homologous recombination (11). In reverse genetics approaches, a gene of interest is disrupted and the resulting phenotypical aberrations subsequently allow conclusions to be drawn on the function of the gene (12). Due to its
Plant Proteomics
31
Fig. 1. Proteome analysis of Physcomitrella patens. (A) The moss P. patens is a model organism in plant functional genomics. (Courtesy of Dr. Julia Schulte.) (B) Proteins of P. patens were extracted with acetone/TCA and were subsequently separated via isoelectric focusing in the first dimension and via SDS–PAGE in the second dimension. (Courtesy of Anika Erxleben.)
outstanding features as a model organism (13), P. patens has been chosen as the first seedless plant to have its full genome sequenced (http://www.jgi.doe. gov/sequencing/why/CSP2005/physcomitrella.html). Knowledge of all coding genes now adds additional weight to proteome analysis as a tool of functional genomics in P. patens. Complementation of phenotypical analysis by differential or functional proteomics studies allows for the elucidation of regulatory networks and a precise classification of gene functions in the context of complex living systems. From the repertoire of proteomic techniques used in our laboratory, this chapter will focus on those methods of classical proteome analysis that will most likely describe the most accessible approach for researchers interested in the field. Plant protein extraction by acetone/TCA precipitation is straightforward, fast, and simple and yields samples of high purity. However, it should be mentioned that sometimes (depending on the source tissue) the price that needs to be paid for this degree of purity is reduced extractability, not only of impurities but also of proteins (14). We describe a two-dimensional (IEF/SDS–PAGE) electrophoresis system routinely used in our laboratory. The high separation power of this system lies in the combination of two independent protein separation techniques. Isoelectric focusing (IEF) as the first dimension separates the proteins according to their intrinsic charge (their isoelectric points).
32
Sarnighausen and Reski
In the second dimension proteins are subsequently separated on the basis of their molecular masses using sodium dodecyl sulfate polyacrylamide gel electrophoresis (SDS–PAGE) (Fig. 1B). While at first glance it might appear unprogressive to not use ready-cast immobilized pH gradient gels for isoelectric focusing (15), our experience shows that a larger number of protein spots can be resolved two-dimensionally if self-cast gels containing carrier ampholytes are used in the first dimension. Visualization of proteins is accomplished via colloidal Coomassie staining. This is a very reliable method of protein staining that combines a good sensitivity and an acceptable dynamic range of staining intensities with the advantage that it is compatible with further identification of proteins via mass spectrometry.
2. Materials 2.1. Growth of Plant Material 1. P. patens protonema is grown in Knop medium: 250 mg/L KH2 PO4 , 250 mg/L KCl, 250 mg/L MgSO4 × 7 H2 O, 1000 mg/L Ca(NO3 )2 × 4 H2 O, 12.5 mg/L FeSO4 × 7 H2 O, adjust pH to 5.8 with KOH. Knop medium is autoclaved twice at an interval of 2 days.
2.2. Protein Extraction 1. Acetone/TCA solution: 10% (w/v) TCA, 0.2% (w/v) dithiothreitol (DTT), in acetone. Store at –20∘ C. 2. IEF lysis buffer: 8 M urea, 4% (w/v) 3-[(3-cholamidopropyl)dimethylammonio]l-propane-sulfonate (CHAPS), 100 mM DTT, 40 mM Tris-base, 0.16% (w/v) Biolyte Ampholytes, pH 5–8 (Bio-Rad, Richmond, CA), 0.04% (w/v) Biolyte Ampholytes pH 3–10 (Bio-Rad). Urea should be of highest purity (e.g., Roche, EP-MB Grade). Water should be of high-performance liquid chromatography (HPLC) quality. IEF lysis buffer is stored in 1-mL aliquots at –20∘ C.
2.3. Protein Assay 1. 0.4% (w/v) bovine serum albumin (BSA) stock solution in IEF lysis buffer, stored in small aliquots at –20∘ C. 2. 0.1 N hydrochloric acid, stored at room temperature. 3. Bradford reagent (stock solution): 0.05% (w/v) Coomassie brilliant blue G 250, 25% (v/v) methanol, 72.25% orthophosphoric acid. Stored at 4∘ C. 100 mg Coomassie brilliant blue is dissolved in 50 mL methanol. 100 mL of 85% orthophosphoric acid is added and finally the volume is adjusted to 200 mL with water. Bradford stock solution is stable at 4∘ C.
Plant Proteomics
33
2.4. Isoelectric Focusing 1. All solutions are made with HPLC grade water (bidistilled). 2. Urea should be of highest purity (Roche, EP-MB Grade). 3. Biolytes 3/10 and 5/8 Ampholytes (Bio-Rad) are stored as aliquots of 500 mL at 4∘ C protected from light. 4. 10% (w/v) CHAPS in water is stored in 1-mL aliquots at –20∘ C. 5. Acrylamide stock solution for IEF (30% T, 5.3% C): 28.4% (w/v) acrylamide (Bio-Rad), 1.6% (w/v) piperazine diacrylamide (Bio-Rad) (see Note 1). The solution is deionized via Serdolit MB-1 mixed bed ion exchanger resin (Serva, Heidelberg) (see Note 2). Acrylamide stock solution is stirred with 1% (w/v) Serdolit at room temperature protected from the light for at least 10 min. Serdolit is removed by paper filtration and finally the acrylamide stock solution is passed through a 0.22-mm membrane filter. Acrylamide stock solution is stored in 0.7-mL aliquots at –20∘ C. Acrylamide monomers are potent neurotoxins and should be handled with appropriate safety measures. The easiest way to detoxify acrylamide is polymerization to polyacrylamide (see below). 6. 10% (w/v) ammonium persulfate, prepared freshly. 7. Gel overlay solution: 6.5 M urea, stored in 500-mL aliquots at –20∘ C. 8. Lysis buffer: see 2.2.2. 9. Sample overlay solution: 7 M urea, 0.8% (w/v) Biolytes 5/8 Ampholytes, 0.2% (w/v) Biolytes 3/10 Ampholytes (Biolytes come as a 40% [w/v] stock solution), stored in 200-mL aliquots at –20∘ C. 10. Cathode electrolyte solution: 0.02 M NaOH (degassed, prepared freshly). 11. Anode electrolyte solution: 0.01 M H3 PO4 (prepared freshly). 12. Bromophenol blue solution in water (at the point of saturation), 1 mL stored at 4∘ C.
2.5. Sodium Dodecyl Sulfate Polyacrylamide Gel Electrophoresis (SDS–PAGE) 1. IEF gel equilibration buffer: 6 M urea, 30% (w/v) glycerol, 50 mM Tris–HCl, pH 8.3 (see Note 3), 4% (w/v) SDS (from a 20% stock solution, Bio-Rad). In addition (a) for the first step (reduction) 2% (v/v) tributylphosphine (see Note 4) and (b) for the second step (alkylation) 2.5% iodoacetamide. 2. Acrylamide stock solution for SDS–PAGE (30% T, 2.7% C) 29.2% (w/v) acrylamide (Bio-Rad), 0.8% (w/v) piperazine diacrylamide (Bio-Rad). The solution is filtered through a 0.45-mm membrane filter and stored at 4∘ C protected from light. 3. 1.5 M Tris–HCl, pH 8.8; the solution is filtered through a 0.45-mm membrane filter and stored in 50-mL aliquots at –20∘ C (long time storage) or 4∘ C (short time storage).
34
Sarnighausen and Reski
4. 0.5 M Tris–HCl, pH 6.8; the solution is filtered through a 0.45-mm membrane filter and stored in 50-mL aliquots at –20∘ C (long time storage) or 4∘ C (short time storage). 5. 10% (w/v) ammonium persulfate, prepared freshly. 6. SDS–PAGE running buffer (cathode buffer): 25 mM Tris base, 192 mM glycine, 0.02% (w/v) sodium thiosulfate (anhydrous), 0.4% (w/v) SDS (see Note 5) (from a 20% stock solution, Bio-Rad); do NOT adjust the pH (see Note 6). 7. SDS–PAGE anode buffer: 25 mM Tris–HCl, pH 8.3 (see Note 7).
2.6. Colloidal Coomassie Staining 1. Solution A: 1.7% (w/v) orthophosphoric acid, 10% (w/v) ammonium sulfate. 2. Solution B: 5% (w/v) Coomassie brilliant blue G250 in water (colloid); stir or shake vigorously prior to use (see Note 8). 3. Solution C: 49 vol solution A, 1 vol solution B. 4. Solution D: 4 vol solution C, 1 vol methanol; methanol must be added slowly (see Note 9); prepare freshly prior to use.
3. Methods 3.1. Growth of Plant Material 1. P. patens protonema is cultivated in 500- mL Erlenmeyer flasks in 180 mL of Knop medium at 25∘ C and a light intensity of 55 mmol/m2 under long day conditions (16 h light, 8 h darkness) with shaking at 121 rpm. The filamentous protonema is transferred to fresh medium and disintegrated weekly with an Ultra Turrax T 25 (IKA Labortechnik, Staufen, Germany). Inoculation density is 150 mg dry weight per liter. The material is harvested by paper filtration using a Buchner funnel with suction and immediately frozen in liquid nitrogen. Moss material is stored at –80∘ C until use.
3.2. Protein Extraction 1. Frozen moss protonema is disrupted in a ball mill (see Note 10) equipped with Stainless-steel grinding jars and grinding balls for 90 s at 1800 rpm. To prevent the material from thawing during this process, balls and jars are precooled in liquid nitrogen. 2. Using a spatula precooled in liquid nitrogen, 300 mg of ground moss material is transferred to a precooled 2-mL reaction tube. 3. 1.5 mL of ice-cold acetone/TCA is added immediately to the plant material. The mixture is vortexed briefly and allowed to stand at –20∘ C for 1 h (see Note 11). 4. Samples are centrifuged at 19,000 × g for 15 min at –5∘ C and the supernatant is discarded. 5. The pellet is washed three times with 1.5 mL of ice-cold acetone containing 0.2% (w/v) DTT. The samples are allowed to stand for 1 h at –20∘ C between the washes
Plant Proteomics
6.
7.
8. 9.
35
and the tubes are centrifuged at 19,000 × g for 15 min at –5∘ C prior to the removal of the acetone. The final pellet should be deprived of chlorophyll. The pellet is dried in a speed vac. To this end the lids of the reaction tubes are perforated with a needle in order to allow the evaporation of the acetone. The pellet should not be dried with the reaction tubes opened, as there is a high risk of loosing the sample during venting of the rotor chamber. The proteins are extracted from the dried material in 600 mL of lysis buffer; the slurry is transferred to a 1.5-mL reaction tube and protein extraction is performed by vortexing the sample at room temperature for 30 min (see Note 12). Cell debris is removed by centrifuging the sample twice at 19,000 × g for 15 min at room temperature (see Notes 13 and 14). Protein samples are stored at –80∘ C. Repeated thawing and freezing is not recommended!
3.3. Protein Assay We use a modification of the Bradford protein assay optimized for protein samples in urea buffer (16). 1. 4 mL 0.1 N HCl is added to 4 mL of protein extract. The acidified extract is diluted with 80 mL of water. 2. 6 mL of 0.1 N HCl is added to 6 ml of BSA stock solution (4 mg/mL). The acidified solution is diluted with 120 mL of water. 3. A 1:1:20 mixture of lysis buffer, 0.1 N HCl, and water is used to further dilute the sample and the BSA solution. Dilutions of the BSA solution are required to build a calibration curve. Dilutions of the moss protein sample are prepared to ensure absorption values that are within the range of the calibration curve. 4. Bradford reagent stock solution is diluted 5-fold with water and filtered through paper. 5. 300 mL of Bradford reagent is added to 20 mL protein solution in the wells of a 96-well microtiter plate. 6. Absorbance at 595 nm is determined within 30 min in a microtiter plate reader. 7. Protein concentrations of the moss protein samples are calculated from the calibration curve.
3.4. Isoelectric Focusing Initially, we used commercially available IPG (immobilized pH gradient) strips for isoelectric focusing (17). While the use of these precast gels considerably simplifies the procedure of isoelectric focusing and is known to yield gels of high reproducibility even in the hands of rather inexperienced labworkers (3), the problems associated with this method are well known. Separation of large, basic, acidic, or hydrophobic proteins, in particular, is problematic when IPG strips are used. We are able to resolve a larger number of proteins using carrier ampholyte tube gels as described by O’Farrell (18).
36
Sarnighausen and Reski
1. The IEF gel solution is prepared in a 100-mL side arm flask: 2.25 g urea, 665 mL IEF acrylamide stock solution, 1 mL 10% (w/v) CHAPS, 500 ml Biolytes 5/8 Ampholytes, 125 mL Biolytes 3/10 Ampholytes, 1.17 mL of water. 2. As oxygen interferes with the acrylamide polymerization, the IEF gel solution is degassed for 15 min (see Note 15). The side arm flask is connected to a membrane vacuum pump. A Wolffs bottle should be inserted between the side arm flask and the pump in order to avoid contamination of the latter with acrylamide solution. The pump should be used in a fume hood. The urea should not be dissolved in the gel solution immediately, as the crystals will act as nucleation centers for gas bubbles. Eventually, the solution should be mixed while still under vacuum by gentle movements of the side arm flasks. The urea should be dissolved without warming of the solution as increased temperature will promote acrylamide polymerization. The walls of the side arm flasks should not be wetted by the solution as this might induce the precipitation of urea. 3. Clean glass tubes 20 cm in length with an inner diameter of 2.3 mm are labeled to a height of 16.5 cm. The bottom of the tube is sealed tightly with Parafilm. Avoid covering large parts of the tubes’ surface with Parafilm as the gel solution must be visible through the glass during the casting process. 4. Glass tubes are mounted in an upright position in a casting stand. 5. Polymerization of the IEF acrylamide solution is initiated by the addition of 4 mL TEMED and 8 mL 10% (w/v) ammonium persulfate solution. Note that the polymerization process will start immediately. The gel solution is mixed gently and is then aspirated into a (self made) 10-L syringe equipped with a thin Teflon tubing of 22 cm. Aspiration of air must be avoided. 6. The glass tubes are filled to the label. The Teflon tubing must be inserted to the bottom of the glass tube prior to the injection of the gel solution or air bubbles will form. Keep the tip of the tubing approximately 0.5 cm below the meniscus while filling the tubes (see Note 16). 7. Each gel is immediately carefully overlaid with 130 mL of overlay solution. The tubes are filled to the rim with water. 8. After 2 h, overlay solution is replaced by 100 mL of IEF lysis buffer. The lysis buffer is overlaid with water to completely fill the tubes. Polymerization is complete after an additional 2 h. 9. Cathode electrolyte (500 mL if a Bio-Rad Protean xi II cell is used) is degassed under vacuum with stirring for 1 h (see Note 17). 10. The parafilm is removed from the glass tubes. The gels need to be secured from sliding out of the tubes during electrofocusing by sealing the tubes at the bottom with dialyses membranes wetted in anode electrolyte. The membrane pieces are fixed with O-rings that are cut from rubber tubing. No air bubbles should be trapped between the gel and the membrane. This is achieved by wetting the bottom of the IEF gels with anode electrolyte prior to the application of the membrane (see Note 18). 11. The lower buffer chamber is filled with anode electrolyte (1.5 L if a Bio-Rad Protean xi II cell is used). The glass tubes are installed in the electrophoresis chamber.
Plant Proteomics
37
12. The protein concentration of the sample is adjusted to 500 mg/100 mL with IEF lysis buffer. 13. The overlaying IEF buffer is removed and replaced by the protein sample in 100 mL of IEF buffer (see Note 19). The samples are overlaid with 20 mL of sample overlay solution. Finally the glass tubes are filled to the rim with cathode electrolyte. The upper electrophoresis chamber is filled with cathode electrolyte. The tubes must be completely covered by the cathode electrolyte. 14. Isoelectric focusing is run at 10∘ C for 30 min at 200 V, for 18 h at 500 V, for 1 h at 800 V, and finally for 1 h at 1000 V. 15. After the disassembly of the electrophoresis chamber, liquid is removed from the IEF gels and the surface of the gels is rinsed with water once. Subsequently, the glass tubes are filled with water and the gels are released into a disposable Petri dish by air pressure applied via a (self made) 10-mL syringe equipped with a silicone tubing that fits tightly over the glass tubes. Extreme care must be taken not to damage the gels during this process (this requires some practice). The force required to press the gels from the glass tubes decreases rapidly as the gel is released. The pressure applied to the glass tube must be adjusted accordingly or the gel will be destroyed when being ejected from the tube. 16. The basic (former upper) end of the gel is labeled with one droplet of saturated bromophenol blue solution. 17. The gels can be stored indefinitely at –80∘C.
3.5. Sodium Dodecyl Sulfate Polyacrylamide Gel Electrophoresis (SDS–PAGE) 1. Glass plates and spacers must be cleaned thoroughly with ethanol and water prior to the assembly of the gel sandwich. Glass plates must be dried with lint-free cloth only. We use the Bio-Rad Protean xi II chamber to cast two gels of 1 mm × 185 mm × 185 mm simultaneously. 2. To cast gels with a linear acrylamide gradient, two gel solutions containing different amounts of acrylamide need to be prepared (see Note 20). For the lower acrylamide solution (high amount of acrylamide) mix in a 500-mL side arm flask 25 mL of SDS–PAGE acrylamide stock solution, 11.25 mL 1.5 M Tris-HCl, pH 8.8, 225 ml 20% (w/v) SDS, 4.5 g glycerol and adjust to 45 mL with water. For the upper acrylamide solution (low amount of acrylamide) prepare in a 500-mL side arm flask 10.5 mL of SDS–PAGE acrylamide stock solution, 11.25 mL Tris– HCl, pH 8.8, 225 ml 20% (w/v) SDS, and adjust to 45 mL with water. 3. Both solutions are degassed via a membrane pump for 15 min. A Wolffs bottle should again be used to prevent the acrylamide solution from contaminating the pump. 4. The gradient mixer is placed on a magnetic stirrer and a stir bar is placed in the mixing chamber (front beaker). 5. The lower (high density) acrylamide solution is poured into the mixing chamber of the gradient mixer.
38
Sarnighausen and Reski
6. 110 mL 10% ammonium persulfate and 30 mL TEMED are added to the upper (low density) acrylamide solution, which is then mixed by gentle shaking and is poured into the reservoir chamber of the gradient mixer. 7. The magnetic stirrer is switched on and 110 mL 10% ammonium persulfate and 30 mL TEMED are added to the lower acrylamide solution. 8. The stopcock is opened and acrylamide solution is released form the gradient mixer (see Note 21). The flow is either driven by a peristaltic pump (which is preferable) or via hydrostatic pressure by placing the gradient mixer on a shelf above the gel sandwich. Two gels are cast simultaneously by inserting a T-piece into the tubing (see Note 22). 9. The valve stem between the two chambers is opened in order to start gradient formation. 10. Both gels should be cast at the same speed. It might be necessary to adjust the simultaneous flow of the acrylamide solution by squeezing one or the other of the tubing to decrease the flow. 11. The running gel is cast to a height 18 mm below the top of the lower glass plate. 12. Each gel is overlaid carefully with water-saturated isobutanol. The gels are allowed to polymerize for 2 h. 13. To prepare the stacking gel solution for two gels, mix 1.3 mL SDS–PAGE acrylamide stock solution, 2.5 mL 0.5 M Tris–HCl, pH 6.8, 50 mL 20% (w/v) SDS, and add water to a volume of 10 mL. 14. The solution is degassed via a membrane pump for 15 min. 15. The isobutanol and a layer of unpolymerized acrylamide solution are removed from the running gels and disposed of. The surface of the gels is rinsed with water and dried carefully with filter paper. 16. 50 mL 10% (w/v) ammonium persulfate and 10 mL TEMED are added to the stacking gel solution. The running gels are overlaid with the stacking gel solution to a height 6 mm below the top of the lower plate. 17. The stacking gel solution is carefully overlaid with water-saturated isobutanol. The gels are allowed to polymerize for 2 h. 18. The IEF gels are equilibrated with gentle shaking in equilibration buffer supplemented with 2% (v/v) tributylphosphine for 20 min and subsequently in equilibration buffer supplemented with 2.5% (w/v) iodoacetamide for 20 min (see Note 23). 19. Pieces of filter paper approximately 4 mm × 6 mm are wetted with 5 mL protein standards (PageRulerTM Unstained Protein Ladder, Fermentas or Precision Plus ProteinTM Standards, Bio-Rad). The filter papers are allowed to dry. 20. Melt 1% low melting point agarose in stacking gel buffer (5 mL 0.5 M Tris–HCl, pH 6.8, 100 mL 20% [w/v] SDS, add water to a volume of 20 mL). 21. Melt 1% standard agarose in running gel buffer. Add bromophenol blue to give the agarose a deep blue color. 22. The IEF gels are placed on pieces of Parafilm 17 cm × 5 cm that have been folded lengthwise in order to increase stability. IEF gels are straightened and the excess of equilibration buffer is drained off.
Plant Proteomics
39
23. Isobutanol and unpolymerized acrylamide solution are removed from the stacking gels. The surface of the stacking gel is rinsed with stacking gel buffer (5 mL 0.5 M Tris–HCl, pH 6.8, 100 mL 20% [w/v] SDS, add water to a volume of 20 mL) and carefully dried with filter paper. 24. The gel sandwich is filled with 1% low melting point agarose in stacking gel buffer. Immediately allow the IEF gel to glide from the Parafilm onto the melted agarose. It is a good idea to always use the same orientation of the gel (i.e., basic [=blue] end to the right). Avoid trapping air bubbles under the IEF gel. Allow enough space at one side of the gel to insert the marker paper. 25. Insert the marker filter paper into the melted agarose at one side of the IEF gel. 26. Once the low melting point agarose has solidified, cover the IEF gel with melted agarose in SDS–PAGE running buffer. 27. The lower buffer chamber of the electrophoresis unit is filled with 1.5 L of SDS– PAGE anode buffer. 28. Once the electrophoresis unit is assembled, the upper buffer chamber is filled with 400 mL SDS–PAGE running buffer. 29. SDS–PAGE is performed overnight (16 h) at a constant current of 12 mA/gel with cooling to 15∘ C. Electrophoresis is stopped when the bromophenol blue front is about to migrate out of the gel.
Colloidal Coomassie Staining (see Note 24) 1. The electrophoresis unit is disassembled and the gel sandwiches are opened carefully. The stacking gel and the IEF gel are cut from the running gel. The best way to do this is to use a pizza cutter! 2. The gels are directly transferred from one glass plate to a staining dish filled with 250 mL of colloidal Coomassie staining solution D. The gel is incubated in the solution for 24 h. 3. The staining solution is discarded and the gel is washed in water with frequent changes until the background is clear.
Stained gels are ready for manual or automated image analysis and subsequent isolation of protein spots (see Note 25).
4. Notes 1. Piperazine diacrylamide is rather expensive but is nevertheless preferred to N,N’- methylene bisacrylamide as a crosslinker for two-dimensional protein gel electrophoresis, because it confers increased strength to the polyacrylamide gels, leads to increased resolution of proteins, and reduces silver stain background (19). 2. This procedure will remove any traces of acrylic acid from the solution, which would otherwise interfere with the generation of a pH gradient during isoelectric
40
Sarnighausen and Reski
3.
4.
5.
6.
7.
8. 9.
10.
11. 12.
focusing of proteins. While this step is probably dispensable whenever highpurity grade chemicals are used (e.g., Bio-Rad) it is an absolute requirement if acrylamide purity grade is questionable. It should be noted that most protocols for two-dimensional electrophoresis include equilibration of IEF gels at a pH of 6.8 (which corresponds to the pH of the SDS stacking gel) rather than pH 8.3 (which corresponds to the pH of the SDS running buffer). However, reduction and alkylation of –SH groups are rather inefficient at pH 6.8 (the optimum pH is between 8.5 and 8.9) so the use of a more alkaline equilibration buffer is highly recommended (20). Tributylphosphine is used instead of 2-mercaptoethanol or DTT because it has been reported to be more active, increases protein resolution, and results in an increased transfer of proteins to the second dimension. Tributylphosphine is inactivated by oxygen and should be handled and stored accordingly (21). Classical SDS–PAGE running buffer contains only 0.1% SDS. Increasing the concentration to 0.4% efficiently reduces vertical streaking in the second dimension. Separation of proteins in SDS–PAGE gels depends on the presence of different anions in the gel buffer (chloride) and the running buffer (glycinate). Stacking of proteins occurs because the chloride anions (leading ions) will move more easily through the stacking gel than glycinate ions (trailing ions), which results in the formation of a high-voltage gradient where all proteins pile up to form a tight disc between the glycinate and chloride ions (22). The presence of chloride ions in the running buffer would interfere with this process. Glycine and SDS are required to separate the proteins in the acrylamide gel but their presence is not required at the end point of separation (the lower end of the gels). Therefore, SDS can be omitted and glycine is replaced by the much cheaper hydrochloric acid as a counterion to the Tris base. Coomassie brilliant blue will hardly (and is not supposed to!) dissolve in water. The dye will therefore form a colloid and will sediment to the bottom upon storage. It is essential to the staining procedure that the Coomassie brilliant blue remains in a colloidal state but is not dissolved in the staining solution. If methanol is added too quickly, temporarily high concentrations of the solute will dissolve the dye. This will result in high background staining of the gels. Moss protonema cells are extremely resistant to mechanical disruption. Tissue disruption using a mortar and pestle is tedious and rather inefficient as was observed when the cells were analyzed microscopically. Proteonema disruption in a ball mill is fast and results in breakage of all cells in a protonema thread. Samples should not be kept in acetone/TCA solutions for prolonged periods of time as modifications or cleavage of proteins might occur. In contrast to SDS-Laemmli buffer, protein samples in urea buffer must never be heated to temperatures higher than 37∘ C. High temperatures will promote the formation of ammonium cyanate from the urea, which will induce carbamylation of protein amine groups. This covalent modification will affect the charge of the proteins and hence their migration during isoelectric focusing.
Plant Proteomics
41
13. Samples in urea buffer should not be stored or centrifuged at low temperatures or precipitation of urea will occur. 14. The insoluble pellet is discarded. Jacobs et al. (23) describe a procedure for sequential solubilization of plant proteins precipitated with acetone/TCA. They perform a reextraction of the pellet with another IEF lysis buffer containing thiourea. This treatment results in the resolubilization of additional proteins that were not released from the pellet under mild extraction conditions. While this method works for cultured Catharantus roseus cells, it could not be successfully applied to P. patens as the thiourea extracts did not yield 2D gels of satisfactory quality. 15. If degassing of acrylamide solution is omitted, the amount of polymerization initiators ammonium persulfate and TEMED needs to be increased. High amounts of initiators will affect formation of the pH gradient during isoelectric focusing and excess amounts of ammonium persulfate and TEMED may interact with (and modify) proteins. 16. Air bubbles can be removed by reinserting the tubing down to the position of the bubble. This will cause the air bubble to rise. 17. Degassing must be performed in order to remove carbon dioxide from the cathode electrolyte thereby preventing the formation of sodium carbonate, which would decrease the pH of the electrolyte. 18. The easiest way to apply the dialysis membrane to the bottom of the tubes without trapping air bubbles is to turn the tubes upside down. In this case, the water overlaying the IEF lysis buffer must be removed first or the fluids will mix. 19. The sample volume should be kept as small as possible to allow solubilization of the proteins but should always be the same between gels to ensure reproducibility. Separation of proteins will occur over the length of the gel including the IEF buffer. If large volumes of IEF buffer are used to apply the sample, proteins in the basic range will not enter the gel at all and will be lost. It has to be mentioned, though, that isoelectric focusing of basic proteins in the presence of urea is problematic, which is why the sample is applied at the basic end of the gradient where separation is not expected to be excellent. 20. Migration of proteins is approximately inversely proportional to the logarithms of their masses. In nongradient gels, this will lead to a high separation in the low-molecular-weight range, whereas separation of proteins is rather poor in the high-molecular-weigh range. A gradient gel with concentration of polyacrylamide increasing from top to bottom will counter this effect and result in a satisfactory separation of proteins over a wide range of masses. 21. The stopcock should be opened prior to the valve stem or the high-density solution will flow “backward” into the reservoir chamber. 22. Plastic pipette tips (200 mL) should be attached to the end of the tubings. The tips should slowly be moved back and forth over the whole length of the gel sandwich or the gradient will be distorted. 23. Equilibration is necessary to transfer the proteins from one electrophoretic separation technique that requires the proteins to maintain their native charges
42
Sarnighausen and Reski
to another technique that requires them to be covered with the anionic detergent SDS. To ensure complete unfolding of the proteins, disulfide bonds must be split. This is accomplished via the addition of tributylphosphine in the first step of equilibration. Iodoacetamide, which is added to the equilibration buffer in a next step, performs alkylation of free –SH groups, thereby preventing reformation of disulfide bonds. 24. Colloidal Coomassie staining detects protein amounts down to 10 ng in a spot. While the sensitivity of silver staining is higher by a factor of 10, silver staining protocols are usually laborious. The dynamic range of silver staining methods is rather narrow, which limits protein quantitation and most silver staining methods are not compatible with mass spectrometric identification of proteins. The exact mechanism of silver staining is still unknown. It is, however, very obvious that efficiency of staining differs between protein spots with quite a large number of proteins not being stained by silver at all. Lower protein loads, however, usually result in better resolution during isoelectric focusing, so silver stained gels usually appear to be of a higher quality than gels stained with Coomassie brilliant blue. Recently two protocols describing highly sensitive silver staining methods that are compatible with mass spectrometry analysis have been published (24,25). 25. As the name implies, “differential proteomics” aims at finding qualitative and quantitative differences between proteomes. In the case of two-dimensional protein electrophoresis, patterns of protein spots need to be compared. It is evident that similarities in protein patterns must outweigh the differences in order to make comparisons possible. Visual analysis and comparison of gel patterns (each consisting of around 1000 protein spots) is rather cumbersome and the development of 2D gel analysis software has made this job easier. However, spot detection is still a critical point in software-aided gel image analysis and requires manual intervention, which is time consuming and inevitably introduces subjectivity. Protein spots of interest are excised from the gel (either manually or by a robot, which is much more convenient). Proteins are destained and specifically cleaved (usually by in gel trypsin digestion) prior to identification by mass spectrometry (see Chapter 1). Via peptide mass fingerprinting and de novo peptide sequencing by tandem mass spectrometry we were able to identify 306 proteins from P. patens after two-dimensional electrophoresis and colloidal Coomassie staining (17). Cho and colleagues predicted the identities of 90 protein spots on 2D gels from protonema and gametophores and observed differences in the proteome patterns in these two tissues of P. patens (26).
References 1. Rossignol, M., Peltier, J. B., Mock, H. P., Matros, A., Maldonado, A. M., and Jorrin, J. V. (2006) Plant proteome analysis: A 2004–2006 update. Proteomics 6, 5529–5548. 2. Pasquali, C., Frutiger, S., Wilkins, M. R., Hughes, G. J., Appel, R. D., Bairoch, A., Schaller, D., Sanchez, J. C., and Hochstrasser, D. F. (1996) Two-dimensional gel
Plant Proteomics
3.
4.
5.
6.
7. 8.
9. 10.
11. 12.
13. 14. 15.
16.
17. 18.
43
electrophoresis of Escherichia coli homogenates: the Escherichia coli SWISS2DPAGE database. Electrophoresis 17, 547–555. Gorg, A., Obermaier, C., Boguth, G., Harder, A., Scheibe, B., Wildgruber, R., and Weiss, W. (2000) The current state of two-dimensional electrophoresis with immobilized pH gradients. Electrophoresis 21, 1037–1053. Cho, K., Torres, N. L., Subramanyam, S., Deepak, S. A., Sardesai, N., Han, O., Williams, C. E., Ishii, H., Iwahashi, H., and Rakwal, R. (2006) Protein extraction/solubilization protocol for monocot and dicot plant gel-based proteomics. J. Plant Biol. 49, 413–420. Rose, J. K. C., Bashir, S., Giovannoni, J. J., Jahn, M. M., and Saravanan, R. S. (2004) Tackling the plant proteome: practical approaches, hurdles and experimental tools. Plant J. 39, 715–733. Damerval, C., Devienne, D., Zivy, M., and Thiellement, H. (1986) Technical improvements in two-dimensional electrophoresis increase the level of genetic variation detected in wheat seedling proteins. Electrophoresis 7, 52–54. Hurkman, W. J. and Tanaka, C. K. (1986) Solubilization of plant membrane proteins for analysis by two-dimensional gel electrophoresis. Plant Physiol. 81, 802–806. Sarhan, F. and Perras, M. (1987) Accumulation of a high molecular weight protein during cold hardening of wheat (Triticum aestivum L). Plant Cell Physiol. 28, 1173–1179. Granier, F. (1988) Extraction of plant proteins for two-dimensional electrophoresis. Electrophoresis 9, 712–718. Saravanan, R. S. and Rose, J. K. C. (2004) A critical evaluation of sample extraction techniques for enhanced proteomic analysis of recalcitrant plant tissues. Proteomics 4, 2522–2532. Schaefer, D. G. and Zryd, J. P. (1997) Efficient gene targeting in the moss Physcomitrella patens. Plant J. 11, 1195–1206. Frank, W., Holtorf, H., and Reski, R. (2005) Functional genomics in Physcomitrella. In Plant Functional Genomics (Leister, D., ed.). The Harworth Press, Binghamton, NY, pp. 203–234. Reski, R. and Cove, D. J. (2004) Quick guide: Physcomitrella patens. Curr. Biol. 14, R261–R262. Chen, S. X. and Harmon, A. C. (2006) Advances in plant proteomics. Proteomics 6, 5504–5516. Bjellqvist, B., Ek, K., Righetti, P. G., Gianazza, E., Gorg, A., Westermeier, R., and Postel, W. (1982) Isoelectric focusing in immobilized pH gradients—principle, methodology and some applications. J. Biochem. Biophys. Methods 6, 317–339. Ramagli, L. S. and Rodriguez, L. V. (1985) Quantitation of microgram amounts of protein in two-dimensional polyacrylamide gel electrophoresis sample buffer. Electrophoresis 6, 559–563. Sarnighausen, E., Wurtz, V., Heintz, D., Van Dorsselaer, A., and Reski, R. (2004) Mapping of the Physcomitrella patens proteome. Phytochemistry 65, 1589–1607. O’Farrell, P. H. (1975) High resolution two-dimensional electrophoresis of proteins. J. Biol. Chem. 250, 4007–4021.
44
Sarnighausen and Reski
19. Hochstrasser, D. F., Patchornik, A., and Merril, C. R. (1988) Development of polyacrylamide gels that improve the separation of proteins and their detection by silver staining. Anal. Biochem. 173, 412–423. 20. Herbert, B., Galvani, M., Hamdan, M., Olivieri, E., MacCarthy, J., Pedersen, S., and Righetti, P. G. (2001) Reduction and alkylation of proteins in preparation of twodimensional map analysis: why, when, and how? Electrophoresis 22, 2046–2057. 21. Herbert, B. R., Molloy, M. P., Gooley, A. A., Walsh, B. J., Bryson, W. G., and Williams, K. L. (1998) Improved protein solubility in two-dimensional electrophoresis using tributyl phosphine as reducing agent. Electrophoresis 19, 845–851. 22. Gallagher, S. R. (1995) One-dimensional SDS gel electrophoresis of proteins. In Current Protocols in Protein Science (Coligan, J. E., et al., eds.). John Wiley & Sons, Inc., New York, pp. 10.1.1–10.1.34. 23. Jacobs, D. I., van Rijssen, M. S., van der Heijden, R., and Verpoorte, R. (2001) Sequential solubilization of proteins precipitated with trichloroacetic acid in acetone from cultured Catharanthus roseus cells yields 52% more spots after twodimensional electrophoresis. Proteomics 1, 1345–1350. 24. Jin, L. T., Hwang, S. Y., Yoo, G. S., and Choi, J. K. (2006) A mass spectrometry compatible silver staining method for protein incorporating a new silver sensitizer in sodium dodecyl sulfate-polyacrylamide electrophoresis gels. Proteomics 6, 2334–2337. 25. Chevallet, M., Diemer, H., Luche, S., Van Dorsselaer, A., Rabilloud, T., and Leize-Wagner, E. (2006) Improved mass spectrometry compatibility is afforded by ammoniacal silver staining. Proteomics 6, 2350–2354. 26. Cho, S. H., Hoang, Q. T., Kim, Y. T., Shin, H. Y., Ok, S. H., Bae, J. M., and Shin, J. S. (2006) Proteome analysis of gametophores identified a metallothionein involved in various abiotic stress responses in Physcomitrella patens. Plant Cell Rep. 25, 475–488.