Eastman, T. E., L. A. Frank, W. K. Peterson, and W. Lennartsson, The plasma sheet boundary layer, J. Geophys. Res., 89, 1553, 1984. Fairfield, D. H., A statistical ...
JOURNAL OF GEOPHYSICAL RESEARCH, VOL. 99, NO. AI2, PAGES 23,591-23,601, DECEMBER 1, 1994
Plasma flow and magnetic field characteristicsnear the midtail
neutral
sheet
R. Nakamura,1 D. N. Baker,2,3 D. H. Fairfield,2 D. G. Mitchell,4 R. L. McPherron,5 and E. W. Hones Jr.• Abstract.UsingIMP 6, 7, and8 magnetic fieldandplasma data,wehavedetermined statistical occurrence properties ofbulkflowandmagnetic fieldorientation nearthemidtailneutral sheet. Characteristics of bulkplasma flowandmagnetic fieldsignificantly change according to theradial distance downthetail. High-speed flowevents(V > 300kin/s)areessentially restricted to the regiontailwardofX = -25RE andarepredominantly sunward ortailward.Thelow-speed flows werenearlyequallylikelytobeinanydirection, withtheoccun•nce rateofduskward andsunward flowbeinglargerthanthatof tailward anddawnward flow. Duskward flowoccurrence ishighest in theregionEarthward ofX = -25RE,whilesunward flowoccurrence ishighest in theregion tailwardof X = -25 RE. The significance of thedawn-to-dusk flowin thenear-Earth region obtained in ourstudysupports theideathatthereexistsa veryeffectivemechanism to accelerate ionsin thedawn-to-duskdirectionandhencetherelief of pressure buildupin thenear-Earthregion.
Duringhigh-speed flowevents therelationship between BZ polarity andplasma flowdirection is largelyconsistent withthatexpected fromthemagnetic reconnection processes associated with substorms. Therearealsosignificant numbers of negative BZ events thatarenotassociated with tailward flow. Mechanism other than substormneutral line shouldtherefore also taken into
accountto explaingeneralBZ polarityin themidtailregion.
associatedwith a NENL causesthe onset disturbancein the near-Earthas well as in the midtail region[e.g., McPherron et
1. Introduction
Understandingthe relationship between plasma flow and the magnetic field near the center of the plasma sheet is essential to the study of the magnetosphericsubstormonset
al., 1973;Baker and McPherron,1990]. Accordingto the latter model,a distinctiverelationshipbetweenmagneticfield orientationand plasma flow is predicteddependingon mechanism. It is still not clear when and where the substorm locationwith respectto the neutralline. NegativeBZ with disturbanceonset takesplace in the magnetosphere. Although tailwardflow is expectedtailwardof the reconnection site, observations in the near-Earth region (X =-5 ~-15 RE) indicate that substormexpansiontakes place associatedwith dipolarizationand currentwedgeformation,there are certain ambiguitiesin interpretingobservations in the midtail region (X = -15 ~ -40 RE). There are basicallytwo typesc:7models: each considersa different region to be the initial locationof the substorm disturbance. One of the models, the current
whilepositive BZwithsunward flowis expected Earthward of the reconnection site [e.g., Hones, 1979]. Characteristics of
the BZ polarity and flow directionare thereforekey in examiningwhetherand wheresucha reconnection region really forms. Average BZ near the equatorialplane has beenobservedto
decreasewith increasingdistancefrom the Earth [Fairfield, 1986; Rostoker and Skone, 1993]. At greater geocentric distancethe field producedby the cross-tailcurrentbecomes a rarefaction 'wave producesthe disturbance in the midtail increasingly important relative to the dipole field. The region [e.g., Lui, 1991]. The other model, the near-Earth frequencyof occurrenceof BZ < 0 was observedto increase neutral line (NENL) model, suggests that an instability with increasingdistancefrom the Earth near the neutral sheet (X = -15 ~ -30 RE) [Nishida, 1984], which was consideredto be one of the principal pieces of supportingevidencefor the ISolar-Terrestrial Environment Laboratory, NagoyaUniversity, reconnection process in the midtail region. In the region Toyokawa, Aichi,Japan; alsoat NASAGoddard SpaceFlightCenter, disruptionmodel, suggeststhat a microscaleinstabilitynear the Earth causesthe currentto disrupt;tailwardpropagationof
Greenbelt,Maryland.
2NASAGoddard SpaceFlightCenter,Greenbelt, Maryland. 3NowatLASP,University ofColorado, Boulder.
4Applied Physics Laboratory, Johns Hopkins University, Laurel, Maryland.
5Institute of Geophysics andPlanetary Physics, University of California,Los Angeles.
6LosAlamosNationalLaboratory, LosAlamos,NewMexico. Copyright1994by theAmericanGeophysical Union. Papernumber94JA02082. 0148-0227/94/94/JA-02082505.00
within 3 RE of the neutral sheet, however, the frequency of occurrenceof BZ < 0 was foundto be twice as greatfor -20 RE < X < -10 RE as for -30 RE < X < -20 RE [Fairfield, 1986]. Numerous studies have investigated plasma flows in the Earth's midtail region. On the basis of case studies [e.g., Hones, 1977] as well as statistical studies [Hones and Schindler, 1979; Bieber et al., 1982] usingIMP 6, 8 data, predominantlytailward flow was reportedin the geocentricregion between 15 RE and 40 RE during substorms.These studies suggestedthe formation of a neutral line Earthward of the sateBite.However, statisticalstudiesusing data from the same satellites [Lui et al., 1977, 1978] obtained predominantly 23,591
23,592
NAKAMURA
ET AL.: PLASMA FLOW AND MAGNETIC FIELD CHARACTERISTICS
sunwardflow. While systematicrelationshipsbetweenplasma
20
flow directions and BZ directions consistent with reconnection
type flows were emphasizedin some studies[Caan eta!., 1979; Hayakawa et al., 1982], Lui et al. [1978] obtained no associationbetweenBZ polarity and flow direction. In the region Earthward of X •-19 RE AMPTE/IRM observedpredominantlysunwardflow associated with positive BZ [Baumjohannet al., 1989; Ange!opouloseta!., 1992], which suggeststhat the reconnectionregion most likely is tailward of X • -19 RE. The relationshipbetweenflow speed and magnetic field elevation angle was also consistentwith this hypothesis[Nakamura et al., 1991]. Some case studies reportednegative BZ and associatedparticle signaturesthat suggestedformation of near-Earthreconnectionregion at X > -15 RE based on ISEE 1, 2 observation[Lin et al., 1991] and near X •-8 RE based on AMPTE/CCE observation[Takahashi et al., 1987]. If reconnectionprocesses,in fact, take place at a particular region in the near-Earth tail, we can then expect to observe systematicchangesin the BZ and flow characteristics down the
tail. In this studywe extenda previousstatisticalstudy[Caan et al., 1979] by investigatingthe radial dependenceof both the field and the plasmaflow propertiesusingIMP 6, 7, and 8 spacecraft. These data have a good coveragein the midtail region as far as ~38 RE. Since the flow characteristicsalso change significantly along the Z axis [Baumjohann et al., 1989], we have concentratedour analysis on neutral sheet crossing events.
10
-10
0
-10
-20
-30
-40
XGSM [RE]
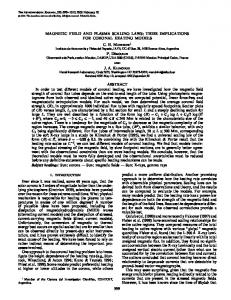
Figure 1. The distribution of the IMP 6, 7, and 8 neutral sheetcrossingsin the XGsM-ZN plane. ZN is the distancefrom the estimate
neutral
sheet.
and 8 data set. Figure 1 showsthe distributionof the neutral sheetcrossingsin the X(GSM)-ZN plane (ZN is definedas the distancefrom the estimatedneutral sheet[Fairfield, 1980]). It can be seen that, in fact, most of the neutral sheetcrossings 2. Data occurred near the estimated neutral sheet. (95% of the neutral This paperusesthe magneticfield datasetfrom IMP 6 taken sheet crossings occurred within 3 RE distance from the between September 1971 and November 1973, from IMP 7 estimated neutral sheet position). Because of the orbital taken between October 1972 and March 1973, and from IMP 8 characteristicsof the satellites,the neutral sheetcrossingdata taken between November 1973 and November 1974. These are quite concentratedin the region betweenX = -35 RE andX magneticfield data setshave beenusedin an earlierstudy = -30 RE (-55% of the crossings).Still, -20% of the data is [Fairfieldet al., 1986]. The dataconsistof 2.5-rainaverage from the regionEarthwardof X = -25 RE. magneticfield parametersand the auroralelectrojetindex Figure 2 showsIMP 8 magneticfield togetherwith plasma duringmagnetotailsatellitecoverageintervalslongerthan 10 flow vectorsfor a 1.5-hourperiodon April 30, 1974. Auroral min, which are recordedon magnetictapes.IMP 7 was in a electrojetindicesfor the day are alsoshownin thefigure. This roughlycircularorbit of r = 35 RE. IMP 8 wasin an elliptical observationwas made during the recoveryand intensification
orbit with perigeeand apogeeof 24 RE and40 RE, respec- of successivesubstormdisturbance.The 15-s averageddata tively. IMP 6, on the other hand, was in a highly eccentric (solid line) and 2.5-min averageddata (crosses)of sunward, orbit with an apogeeof 33.1 RE and a perigeeabout350 km duskward and northward componentsand magnitudeof abovethe Earth.IMP 6 and 8 plasmaflow datawere available for this study. The data were obtained from Los Alamos ScientificLaboratoryplasmaanalyzerson IMP 6 and IMP 8
[Honeset et al., 1976],whichhadfan-shaped acceptance solid anglescenteredon the rotationalequatorof the satellite.The satellitespinaxeswereperpendicular to the eclipticplane.Ion flux wasmeasuredat 16 energylevelsfrom 140eV to 28.8 keV by IMP 6 andat 16 levelsfrom 84 eV to 15.25keV by IMP 8. We used data lists of plasma flow parametersrecordedon microfilms.The lists of flow parametersconsistof average flow magnitude,direction,and data scatter,that were calculated every-110 s for IMP 6 and--27 s for IMP 8 undertheassumption that all the measuredfluxesaredueto protons. To study the characteristics near the neutral sheet, we
magnetic field, BX, By, BZ, and B, are plotted in the middle panels along with the averages of the azimuthal and northsouth angles,•Pand 0, in solar magnetospheric coordinates (GSM). For our statisticalanalysiswe focuson the observed singleplasmaflow vectornearestto the neutralsheetcrossing time. The crossingtime is definedas the averagetime of the two consecutiveobservationswith different signs in BX, which is equivalentto a transitionfrom 270ø > q•> 90øto 90ø > •P> -90ø or vice versa. Suchcrossings are obtainedfor the entire 2.5-min data set. During the time interval shownin Figure2, 5 neutralsheetcrossings (as indicatedby the dotted lines) were identified.This methodwill pick-upneutralsheet crossings with comparable time-scale to that of the flow measurement. It cannot identify rapid double-crossings events, in which the satellite enters and exits the opposite hemisphere, such as the ones at 1638 and at 1643 UT.
selecteddata right at the actual neutral sheet crossingas ,•,'a,,,',••,y a reversalin BX. We useddataonlyin themidnight sector,whichwe assumed to be -7 RE < Y(GSM) < 9 RE taking Associated with the AL disturbanceafter 1625 UT, fast tailward into accountthe aberrationof the magnetotail.Some 718 flows (> 1000 km/s) were observedduring neutral sheet neutral sheetcrossingswere obtainedfrom the total IMP 6, 7, crossingsat 1632, 1635, and 1644 UT with negativeBZ. The
NAKAMURA ET AL.: PLASMA FLOW AND MAGNETIC FIELD CHARACTERISTICS 0•)
4/ 30'74
(shown as crosses). becomesnearly zero, becausethe actual neutral sheetis locatedbetweenthe pair of the observation points. The latter averagethereforerepresentsthe interpolatedmagnitudeat the neutralsheet. The vertical barsindi-
AU o
AL -•oo
catethescatter (or/•n)oftheaverage BZandB component. In
-1000
12:••..•.•..•0 L..•.8:oo 21:0024:00 4 / 30 '74
10
BX
/
,
,
,
coincide in the region -10 RE > X > -35 RE, which indicates ] (hi) that averageBZ is even closerto the averagemagnitudeof the field expectedin the neutralsheet. In the region-10 RE > X >
,
0 lO
BZ 0
BlO 5 ....
', '
L ....
I ....
I''t''l
....
'
''
', '
: =
I .....
iI ....
I'i'''i
'
(D 0o
....
-15 RE and -35 RE > X > -40 RE, on the other hand, is
much larger than with large scatter. The numberof data
-10
o
the region -15 RE > X > -35 RE, is close to (less than a factor of 2). BZ is therefore the main field component at the observation points before and after the neutral sheet crossings in this X region. The crosses(B at the neutral sheet) and the black diamonds (Bz at the neutral sheet) almost
0 -10
23,593
I ....
'
pointsis quite small in bothregions. In the region-35 RE > X > -40 RE, the average magnitudeobtained from both methods is relatively large comparedto . The large difference between the averagemagnitudesand in the region -35 RE > X > -40 RE is due to significant contribution from , which has a comparable value to . By can be also seenduring someof the neutral sheet crossingsshownin Figure 2. One of the possiblecausesof By perturbationcould be due to field alignedcurrent. For a typical neutral sheet, however, perturbationsin By from both hemi-
.
15:30
16:00
16:30
17:00
sun(k• 500 .........
istics,(•,BX•2 + 2 + 2)1/2•- •Bz•, in the-10 RE> X > -35 RE region (Figure 3a) in additionto the effect due to • 0. If By perturbationswere related to the field-alignedcur-
V -5oo ,
UT XGSM YGSM ZN
15:30 -32.1 9.0 -0.9
spheresare expected to cancel each other at the neutral sheet. Such effect may have alsocontributedto the averagecharacter-
i
i
,
,
,
i
,
,
i
....
i
....
16:00 -32.1 8.6 -0.6
i,
16:30 -32.1 8.2 -0.3
17:00 -32.0 7.7 0.0
20
IMP 6, 7, 8
..... ,
Figure 2. IMP 6 magneticfield, plasma flow vector, and geomagneticindicesAE duringa substorminterval.
15
x (2+2+2) 1/2 ß
angle betweenthe measuredcomponentand the magneticfield was more than 60ø during these three crossings. The flow vectorsthereforemainly show perpendicularflow to the field. For the statistical study we used only those vectors when relative variation in the flow speed was less than 1 and the error of the flow in azimuthal angle was less than 45ø. This criteria excluded35% of the flow eventswith averagespeed between
(a)
0 -10
I
I
I
I
-20
-25
-30
-40
XGSM [R•
50 and 100 km/s and 95% of the flow events with
average speed less than 50 km/s. In total, flow data were available for 402 IMP 6, 8 neutral sheetcrossings.
100
occurrence rate of B z < 0
80
3. Average Characteristics of Bz BZ is a fundamental parameter characterizing the neutral sheet. Figure 3a shows the average BZ and B at the neutral sheetcrossingsas a functionof X(GSM) when BZ was posifive. The figure was constructed by binningthe data set in 5 RE intervalsof X(GSM). These averageswere calculated,for all events,usingthe pair of datapointswhosechangesdefined the neutral sheet crossings. We calculatedthe averageB in two different ways as given in the figure. (shownas open squares)is straightforwardaveragesof magnitudeobtainedat the observationpointsjust before and after the neutral sheet
60
•
40 20
0
(b)
-10
-15
-20
-25
XGSM [R•J
-30
-35
-40
ß
crossings. ( X > -20
RE region (4.3 nT) and the -25 RE > X > -30 RE region (2.1 nT). At X < -25 RE the field stayedbetween2.1 nT and 2.6 nT. In the -10RE>X>-15 RE region BZ is 3.0 nT, which is smaller than that in the -15 RE > X > -20 RE region. We
o,
o.
• 1000
ß ß
ß .o, ß.
:
ß -'
the near-Earth neutral sheet such as predicted by steady
Convectionmodels [Hau and Wolf, 1987], becauseof the relatively small and large scatterof data in this region. The B Z average values are somewhat smaller than those obtained at the neutral sheet crossingsfrom all Y(GSM) regionsin a previousstudy [Rostokerand Skone,1993] using IMP 8 and ISEE 1,2. Specifically, the maximum difference between the two studiesis a few nanoteslasin the region of X
0 -10
-15
ß
.
ß
.... ß _ '..
ß
•. •--..
500
cannot conclude that this decrease indicates a minimum BZ at
o
'
.:,,::?.-.•: • :•.•::,4 o.•. .x..•.:.:.','."
. '.'..': ,.,-'k•,V,.;•'.
.;
-20
(a)
-25
-30
-35
-4O
XGSM [RE] (%) 25
i i i i i i I !i i i i i i i i i ii
> -25 RE. Since BZ is smaller in the center of the tail than on
the flanks [Fairfield, 1986], this differencecouldbe relatedto the different data set and the samplingcriteria used. Figure 3b shows the occurrencerate of the negativeBZ events that were normalized to all neutral sheet crossing eventsin the sameX region. In the regionbetweenX = -15 RE and X = -35 RE the occurrencerate of negativeBZ is higherin the region where the averageBZ is smaller. That is, the occurrence rate enhancesas BZ decreaseswith increasingdistance from the Earth in the -15 RE > X > -30 RE region. The occur-
renceratesslightlydecreasein the -30 RE > X > -35 RE region where the BZ slightly increases. In the -35 RE > X > -40 RE region, the occurrencerate of negativeBZ is quite high compared to the otherregion. The relationshipbetweenradial distanceand occurrencefrequencyof negativeBZ is thereforenot a monotonic increase with increasing distance down tail, exceptfor the -15 RE > X > -30 RE region. We cannotnecessarily interpret all negativeBZ eventsincludedin Figure 3b due to a reconnection regionEarthwardof the satellite. As discussedbefore,the averagemagnitudein the-35 RE > X > -40 RE region (Figure 3a) showedstrangebehaviorfor a typical
0
0
(b)
30
60
90
120
150
180 ø
VZB
Figure 4. (a) Scatterplot Of the flow velocityversusX and (b) occurrence of the anglebetweenthe ambientmagneticfield and the measuredflow component.
300 kin/s). We further divided the data set into 16 different
quadrantswith 22.5ø longitude-bins in the GSE coordinates. Figure 5 shows the occurrence of different velocity directionsof the neutralsheetcrossingsfor X >-25 RE cases (Figure5a), X < -25 RE, IV.l.I< 300 km/s (Figure5b), andX < neutral sheet. -25 RE, Ig.l.I > 300 km/s (Figure5a). Neutral sheetcrossings at X > -25 RE are 95% low-speed flows (Ig.l.I < 300 km/s). Figure 5a representsthereforecharacteristicsof low-speed 4. Average Characteristicsof Flow flow cases. The high-speedflows in the region X -25
dawn
X < -25Re
60 events
dawn
23,595
219 events
[vl< 300km/s
40
40 sun
I (%)
(%)
(a)
dus
(b)
dusk
-25REcases, (b)X < -25 RE,Igll < 300km/s,and(c)X < -25RE,Igll > 300km/s.
(c)
dusk
duskwardand dawnwardflow components increaselessthana 5. Relationship Between Bz Polarity and Flow factor of 1.5. As a result, the average flow vector changes Direction from duskward to sunward-duskwardwith increasingdistance
If reconnection takes place, a systematic relationship Figure 7 shows the perpendicularelectric field obtained between BZ polarity and flow direction is expectedto be from IV x BI accordingto the radial distancefrom the Earth. observednear the neutral sheet:sunwardflow with positiveBZ The black diamondsindicatethe averageIV x BI over all data, and tailward flow with negative BZ. The latter (former) while the opensquaresindicatethe averagefor eventswith AE relationship indicates that reconnectiontakes place at the lessthan 100 nT, representingquiet periods. The electricfield Earthward (tailward) side of the observation point. We increases with increasing distance from the Earth if the examined occurrence of such Bz-flow relationships. BZ averageis calculatedfor all the data. On the other hand,it polarity during sunwardflow and tailwardflow episodesis staysbetween0.2 and 0.5 mV/m if the averageis calculated shownin Figure 8 for all cases(Figure 8a), Ig.l.I > 300 km/s usingthe caseswith AE lessthan 100 nT. The latterprofile cases(Figure8b), and Ig.l.I< 300 km/scases(Figure8c). The suggests that duringgeomagnetically quietperiodsthe radial occurrence rate of B Z positive is higher than that of BZ dependenceof the magneticfield and averageflow can be negative, except for high-speedtailward flow cases. In explainedby a largescaleconvection.Assumingthe widthof general,the rate significantlychangesaccordingto the flow the tail to be .--40RE, such an electric field correspondsto a directionand speed. The occurrencerate of positiveBZ is polar cap potentialdropof < 100 kV. The polarcappotential about94% for the high-speedsunwardflow case,higherthan dropobtainedfrom low-altitudeobservations is of the order30 for the other two sunward flow cases. The occurrence rate of - 140 kV [Reiffet al., 1981]. In spiteof the weak geomagnetic negative BZ for the high-speedtailward flow caseis about activity, our observations indicatea large value comparedto 63%, which is higher than for the other two tailward flow the low altitude observations. Such a discrepancycould be cases. These results suggestthat the high-speedflows are partlydueto the fact thatwe couldnotobtainmostof theflow more consistentwith the magneticfield polarity expectedfor processthan the low-speedflows. vectorsless than 100 km/s. The obtainedaverageprofile for the magneticreconnection We further examinedthe dependenceof the BZ and highAE < 100 nT could be the casewhenglobalconvectionis well on geomagnetic activityconditions developedin spite of weak geomagnetic activity at AE sta- speedflow characteristics tions. by referringto the geomagnetic indices,AE, AU, andAL. For
from the Earth.
23,596
NAKAMURA
ET AL.: PLASMA
FLOW AND MAGNETIC I
I
....
I
FIELD
....
CHARACTERISTICS
I
I
100 [km/s]
vx
300 km/s) near the neutralsheet
arerestricted totheregion tailward of X = -25REandaremore
consistent with the reconnection-type flows than are lowspeedflows. the ratio was 0.3 - 0.4 for studies where data were selected Although the high-speed flow was predominantlymore from near the centerof the plasmasheet(estimatedfrom Caan sunward than tailward for the whole interval, making it et al. [1979]) or within 3 RE from the neutral sheet (estimated from Hayakawa et al. [1982]). During the substormexpansion tempting to assume that the reconnection site is tailward of or growth phase,the ratio was -3 in our study,while the ratio the satellite, the predominanttailward flows with negativeBZ near the neutral sheet associatedwith substormonsetsupporta was -2 when all data obtained within Z = 2.5 RE were used relatively near-Earth reconnectionrather than a rarefaction (estimated from Hones and Schindler [1979]). Both studies suggestthat the occurrenceof tailward flow observations wave propagatingtailward. A localizedonsetregionfollowed by radial expansion would explain the predominant exceeds that of sunward flow observations. On the other hand, observation of the sunward flow. Detailed analysis of the the ratio was 0.3 - 0.6 if a data set was used which included substorm phase as well as satellite location relative to the those at a larger distance from the neutral sheet (estimated onset region is crucial in determiningthe most likely location from Lui et al. [1977, 1978]) obtained during thinning of the initial reconnection site associated with substorm intervals, which correspondto phase I in this study. This onset. Significant numbers of negative BZ events were tendency suggeststhat significant sunwardflow is expected observed that are not associated with tailward flow. General BZ near the boundaryof the plasma sheetwhile tailward flow is polarity in the midtail region may therefore also be controlled confinedto the neutralsheet. Hayakawaet al. [1982], in fact, otherthana substormneutralline. obtained results showing that the fast tailward flow was by somemechanisms
for all the high-speedflow caseswas -0.5 in this study,while
restricted to Z less than 3 RE. It should also be noted, that the
fast tailward flows are mostly associatedwith substorms. Simulation results by Martin [1986] showed that ion accelerationnear a magneticneutralline could take place more effectivelyfor a thinnerplasmasheet. Thusrelativelyhigher speedtailward flows would tend to concentrate in the region near the neutral sheet. The flows in regionsaway from the neutral sheet, on the other hand, are rather more likely to be related to high-speedflow at the plasmasheetboundarylayer [Eastman and Frank, 1984]. This study made it possibleto concentrate on an investigation of the existence of the reconnection-typeflows by excludingthe negativeBZ due to strongand slightlytilted tail fields andplasmasheetboundary layer flows, which might otherwisecontaminatethe result. The ion flow data were obtained based on an assumption that ions are all protons. The actual velocity becomesone fourth of the obtainedvelocity if the ions were, for example, all O+ ions. Lennartsson et al. [1981] measured relative
Acknowledgments. The authorsgratefully acknowledgehelpful discussions with numerous colleagues at NASA / GoddardSpaceFlight Center. This work wasstimulatedby discussions with A. Nishida. We are gratefulto the magneticfield and plasmaprincipalinvestigators, N. F. Nessand S. J. Bame,andto R. P. Leppingand F. W. Ottensfor their help in recoveringthe data set. Magnetogramrecordswere provided by WDC-C2 for Aurora (NationalInstituteof Polar Research).This work
was done while
R. N. held a National
Research Council
-
NASA/GSFC Research Associateship. The work at UCLA was supported by NASA grantNAGW-2054. The Editor thanksR. Lundinand L. R. Lyonsfor their assistance in evaluatingthispaper.
References Ang½lopoulos, V., •. Baumjohann, C. F. Kennel,F. V. Coroniti,M. G. IGv½lson,R. P½llat,R. J. Walker,H. Liihr, and(3. Paschmann, Bursty bulk flows in the inner centralplasmasheet,Z Geophys.Res.,97,
quantitiesof H+, He++, He+, and O+ in the near-equatorial 4027, 1992. magnetosphere at r < 15 RE duringmagneticstorms.It was Ashour-Abda!!a,M., L. M. Ze!½nyi,J. M. Bosqucd,The formationof the found that O+ was typically about30 - 40 %, which is less wall region:Consequences in the nearearth magnetotail,Geophys. Res. Lett., 17, 1739, 1992. thanthe H+ density. The largestfractionsof O+ (