Image quality measuring techniques are an essential part of the Polaroid Image Quality Methodology. For spatial image quality evaluation, a flatbed scanner- ...
IS&T's 2003 PICS Conference
Polaroid Scanner-Based Image Quality Measuring System Dirk W. Hertel and Jason G. Brogan Polaroid Corporation, Waltham, Massachusetts Abstract
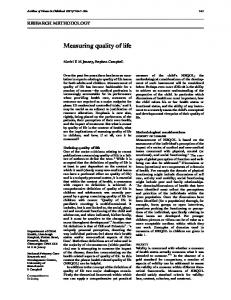
printhead (resolution, thermal efficiency) and thermal history, but can also be seriously impacted by errors in color registration. A measuring methodology should support all levels of image quality evaluation by providing diagnostic tools as well as physical and visual image quality metrics. 5, 6 • Diagnostic tools examine media and printer components in order to identify and control critical image quality parameters. Examples are uniformity (media coatings, thermal printheads, media transport), and registration. • The physical image quality functions Noise Power Spectrum (NPS) and Modulation Transfer Function (MTF) describe the overall noise and sharpness performance of the imaging system. • The visual micro-image quality or 'appearance' metrics graininess and sharpness correlate with the psychovisual (subjective) response to noise and image spread.
Image quality measuring techniques are an essential part of the Polaroid Image Quality Methodology. For spatial image quality evaluation, a flatbed scanner-based measuring system has been developed. It comprises image quality metrics as well as diagnostic tools for print uniformity and registration. Visual models are used to calculate graininess and sharpness from the measured physical image quality functions. The results are the basis for estimating system image quality. Special attention has been given to the software architecture to create a de-centralized, efficient, low-cost measuring system that can easily be deployed on-site. Modular architecture facilitates the addition of new metrics and diagnostic tools. Fully automated to eliminate user error, the software also addresses workflow efficiency with features such as a user-friendly interface, batch processing of scans, and auto-archiving of processed image files. Detailed reports in Excel spreadsheets allow seamless integration into the evaluation process and database. The system has become instrumental in the research and development of both silver halide and digital imaging systems, and is the workhorse for product evaluation, benchmarking, and competitive product analysis. It has been successfully deployed within Polaroid and at its program partners to monitor quality at media coating and hardware assembly facilities.
Visual IQ
Graininess
Visual
Graininess Sensitivity G(D)
models
Sharpness
Contrast Sensitivity E(f)
Introduction
Physical IQ
NPS(f, D)
MTF(f)
Image quality comprises the reproduction of tone and color on one hand and the reproduction of fine details on the other hand. Detail reproduction is determined by the ability of the imaging system to produce spatially variant density distributions.1,2 Since the combined effect of noise and image spread degrades the spatial image quality, its measurement is an essential tool when developing digital photo print systems, and it will be the focus of this paper. Print noise receives contributions from media and hardware non-uniformity. Non-uniform hardware components create highly visible oriented noise such as streaks from non-uniform printheads3 or periodic banding from varying print line placement. 4 Image spread limits sharpness and resolution, and in a thermal color print system it is not only determined by the
Image Diagnostics
Image Noise
Image Spread
Figure 1. Metrics for evaluating image quality
Spatial image quality requires measuring the spatial distribution of micro-density. The success of CCD image scanners in measuring granularity and sharpness on films7 suggested the suitability of high-end flatbed scanners for evaluating print quality. Flatbed scanners offer a low-cost, fast, and user-friendly alternative to automated microdensitometers or CCD camera-based scanners.8 Special attention was placed on software development to fully utilize the image quality potential of flatbed scanners.
140
IS&T's 2003 PICS Conference
Software and Workflow
Diagnostic and Image Quality Metrics
Software development was focused on an efficient workflow, with easy deployment of existing metrics and fast development of new ones: • Workflow: Automatic, efficient, user-friendly operation, including data reporting and archiving. • Deployment: De-centralized system, based on inexpensive hardware (flatbed scanner), plus a standalone image quality and diagnostic software package. • Development: Modular software architecture based on an image evaluation toolbox to allow fast development and deployment of new tools on demand.
The metrics for diagnostics, physical and visual image quality shown in fig. 1 are now described in more detail. Diagnostic Metrics Metrics on a diagnostic level address media- and machine-specific problems of image uniformity and spread.9 Diagnostic micro-uniformity metrics simulate slit scans to measure one-dimensional spatial profiles in the direction of interest,10 for instance along a thermal printhead whose non-uniformity is suspected to create streaks. Flat fields are commonly used as uniformity test targets, but continuous wedges reveal more information when the effect of non-uniformity is density-dependent. Measurements of line placement error are based on slit scanning in the direction of print transport.4 Spatial frequency analysis addresses periodic artifacts from hardware components to study the effect of coating cylinders on media uniformity, or of receiver transport mechanisms on print uniformity. Examples for diagnostic uniformity metrics are: • Donor micro-uniformity, based on NPS measured in transmission, • Oriented noise, based on comparing orthogonal NPS components in directions of interest (coating, printhead, transport) at spatial frequencies of interest, • Thermal printhead uniformity, based on density error as a function of print density, • Print line placement uniformity (errors of line placement and print velocity), based on phase analysis of print line positions.
The image evaluation tools on the diagnostic, physical, and visual image quality levels were integrated into a modular software package with the following main components: • Scanning: Utilizing the TWAIN capabilities of the stand-alone scanner driver to create measurementspecific scan programs that define the scanner settings (resolution, gamma, etc.), and select multiple features from standardized test targets (edges for sharpness, flat fields for granularity, lines for registration, etc.). A scan-and-repeat process creates batches of image files from series of prints. • Image quality and diagnostics: A maximum degree of automation minimizes user input and error. The user selects the type of measurement (granularity, sharpness, registration, etc.), a batch of image files, and the files and folder for reporting and archiving. • Result reporting: The results are stored in measurement- and target-specific Excel spreadsheets, which also perform after-measurement data analysis, graphic display and reports printing.
Diagnostic metrics for image spread address color registration and edge sharpness. Color registration data can be derived either directly from edge MTF analysis11, or from line targets that are often preferred because they allow visual inspection. A line registration tool was developed that scans arrays of multiple print lines at selected areas of interest (for instance left, center, right) and measures the relative distances of cyan, magenta, and yellow line centroids for every single line. The matrices of line registration as a function of line position, with up to 75 line positions per print, can be analyzed to extract data about media tracking (slip and skew) and printhead adjustment (skew in a multi-head printer). Spatial profiles and edge MTF measure the effect of thermal history. Diagnostic metrics are generally not visually scaled, but their impact on visual image quality can be studied indi-rectly by correlating them with the results of image quality measurements. Since media and hardware nonuniformity will increase granularity, correlation between uniformity data and granularity in carefully controlled experiments can be used to specify acceptable uniformity limits. Any loss in cyan-magenta registration will lower MTF and sharpness. For a specific imaging system, the correlation of color registration with MTF and sharpness
The scheme in fig. 2 outlines the modules and process steps of the image evaluation software. Image pre-processing • • • •
Detect image mode (grayscale, color) Detect borders and skew, then rotate and crop Detect target orientation, then rotate Separate features in complex print targets
• • •
Color: Scanner RGB → Reflectance, Density Spatial filtering (low-pass, high-pass, eye) Sampling, sectioning and slit scanning
• •
Diagnostic metrics Physical and visual image quality
• •
Statistic, histogram, error analysis Data reduction Figure 2. Image Evaluation Toolbox.
Image processing
Image diagnostics and quality
Data analysis
141
IS&T's 2003 PICS Conference
allows image quality degradation from registration loss to be predicted.
Visual (Subjective) Image Quality Metrics describing the psychovisual response to spatial micro-image quality are Graininess and Sharpness. Graininess is the psychovisual response to the stimuli created by the image fluctuations, sharpness the response to image modulation. In both cases, the human visual response is approximated by the functions of photopic spectral luminous efficiency V(λ), the human contrast sensitivity E(f), and graininess sensitivity GS(D). To simulate a spectral response close to the human observer, the reflectance signals from the color channels RGB are combined to luminance values using visual weighting coefficients, and then turned into photopic visual density DVIS
Physical (Objective) Image Quality The basic functions of physical (objective) image quality2 are • Characteristic curve D(log E), • Noise Power Spectrum (NPS) of granularity, • Modulation Transfer Function (MTF). The NPS N(f, D) is measured as a function of spatial frequency f and density D on either an array of flat fields of varying print density (step wedge), or a continuous density wedge.12 In case of the continuous wedge, spatial filtering separates the granularity signal from the density wedge. For the calculation of NPS from short data sequences the scanned image is first segmented, then a one-dimensional slit scan applied to each segment m. The segment size is given by the slit dimensions (width ∆x and length h), and the length L of the data sequence used for fast Fourier Transform (FFT). The NPS is the average of m periodograms measured at a given density D,
h∆x M −1 L −1 N ( fk ) = ∆Dl e −2πikl / L ∑ ∑ ML m=0 l =0
DVIS = − log(0.29 RR + 0.6 RG + 0.11RB ) .
Graininess analysis comprises integration over spatial frequency and density. First the eye-weighted integral of N(f,D) over spatial frequency calculates granularity for each density,14 E( f ) N ( f , D )df ∫ , f σ 2 ( D) ≈ 2 E ( f ) ∫ f df 2
2
(1)
The main advantage of the continuous wedge method is that it delivers not only granularity versus density, but also the characteristic curve of density as a function of input RGB or energy. The MTF M(f) is measured as a function of spatial frequency on test structures that contain an array of sharp edges printed at a range of densities. The edge contrasts are kept low to limit the effects of scanner flare, and to prevent non-linear steps in the printing process from making the MTF density-dependent. For the calculation of MTF, the scanned edge images are subdivided into scan bands, then simulated slit scans applied to each band to create edge profiles. Important parameters to be considered are the tilt angle of the edge, the slit dimensions (width ∆x and length h, with maximum h set by the tilt angle), and the length N of the data sequence used for fast Fourier Transform (FFT). The Line Spread Functions (LSF) are calculated as the first derivative of the edge profiles. The LSF of all scan bands are averaged after first detecting then aligning the centers of each band. Unwanted signals from print grain and halftone patterns make the detection of low-contrast edges challenging. Adaptive spatial filters remove those signals without degrading the edge sharpness.13 As an added bonus, the relative positions of cyan, magenta, and yellow edges in tri-chrome prints are a precise measure of color registration. Finally, the MTF is calculated from the LSF L(x) via FFT,
M (f )=
.
(4a)
Graininess is estimated from the mid-tone gray granularity σ2(0.75), but a correction has to be made when comparing different density distributions of granularity σ2(D). The appropriate correction factor φ for the granularity is derived from weighting the granularity at densities other than 0.75 by the graininess sensitivity function GS(D),15, 16
σ e2 = σ 2 (0.75) ⋅ φ (GS (D ), σ 2 (D )) φ (GS (D ), σ 2 (D )) =
∫ GS (D )⋅ σ (D )dD 2 n
n
∫ GS (D )⋅ σ (D ) | n
2 n
film
,
(4b)
dD
where ()n denotes normalization of a function to its value at D=0.75, and 'film' the σ2(D)-characteristic of the ideal film model,12 For sharpness analysis, the eye weighted integration over spatial frequency delivers Granger’s Subjective Quality Factor (SQF),17 using an approximation of the human eye function E(f),
SQF =
∫
E( f ) M ( f )df f E( f ) ∫ f df
.
(5)
The density-dependence of MTF, and of the perception of image modulation are not yet considered in the image quality model; instead the SQF of a low contrast gray edge with a mean density of about 0.75 was assumed to be a
∞
− 2πifx ∫ L(x )e dx
(3)
(2)
−∞
142
IS&T's 2003 PICS Conference
could theoretically be removed using a correction function. Unfortunately, in most cases systematic errors of density, or scanner pitch not only depend on the x-y-coordinates, but also may vary in time and between scanner units. Using a scanner-specific, 2-dimensional correction function in absolute scanner coordinates is neither practical nor stable in the long-time.
good representation of image sharpness. Further studies are required to incorporate density-dependent sharpness evaluation.
Flatbed Scanner Evaluation
Spectral Power [µm²]
In the following the requirements that flatbed scanners have to meet in order to perform measurements on the levels of diagnostics, physical, and visual image quality are explored. Basic Requirements The selection of a suitable scanner is somewhat difficult because manufacturer specifications are limited to basic properties such as optical and grayscale resolution. Optical resolution, limited by the scanner optics in the fastscan, and by optics plus scan mechanism in the slow scan directions, should be at least 1200dpi. Grayscale resolution should be no less 12bits per color channel; higher resolution will be beneficial to the signal-to-noise ratio. High-performance scanners designed for pre-press specifications, such as the UMAX PowerLook III, usually meet basic requirements.8
1.E+00
Scanner Error Filter Cut-off
1.E-02
1.E-04
1.E-06 0
1
2
3
4
5
Spatial Frequency [cy/mm] Figure 3. Power spectrum of scanner pitch error in the fast scan direction, flatbed scanner UMAX PowerLook III.
Metric-Specific Requirements On the different levels of measurements, as a general rule the scanner should not only meet but also exceed the specific requirements of a particular metric. A tried strategy is to use the scanner metrics on high-precision calibration targets to characterize the scanner directly: • On the diagnostic level, this approach will deliver scanner uniformity and registration. • On the level of physical image quality, density response, NPS and MTF of the scanner will be measured. • Finally, on the level of visual image quality, the NPS and MTF performance of the scanner has to be checked within the integration limits of spatial frequency and density determined by the functions E(f) and GS(D) respectively.
Spatial frequency analysis of the UMAX PowerLook III scanners revealed that the errors of scanner pitch (fig. 3) and density (fig. 4a) have the highest power at spatial frequencies below 0.2cy/mm. Spatial filtering can eliminate those errors, so providing an alternative approach to scanner calibration. Registration was measured to be better than 10µm in both scan directions, which is sufficiently good to measure registration of a 400dpi printer system. Physical Image Quality Functions To evaluate the physical image quality performance of a scanner, image quality functions are measured on 'ideal' or calibrated test targets. Measurements on high-precision step wedges address how linearly the scanner responds to density readings, and how repeatable the readings are over time. Measuring NPS on 'grainless' flat fields or continuous wedges, and MTF on 'ideal' sharp edges will deliver the characteristic NPS and MTF of the instrument. Since neither NPS nor MTF are dependent on the scanner coordinates, they can be used as correction M0(f) and N0(f) to make the measured physical image quality functions Mm(f) and Nm(f) instrument-independent7:
Diagnostic The requirements on the diagnostic level are centered on spatial uniformity and color registration: • Density profile measurements require uniform scanner response in both slow and fast scan directions. • Print line placement measurements require a uniform scanner pitch, with low optical distortion in the fast scan direction, and low motion error in the slow scan direction. • Color registration measurements require registration of scanner channels in both slow- and fast-scan directions.
M (f )=
High-precision calibration targets can be used to characterize scanner performance, for instance large-area flat fields for density uniformity, or precision line targets for motion uniformity. If the scanner error is systematic, it
N(f )=
143
Mm(f ) M0(f ) Nm ( f ) M 02 ( f )
(6)
(7a)
IS&T's 2003 PICS Conference
N ( f ) = N m ( f ) − N 0 ( f ).
lowest frequency to 0.18cy/mm. For higher frequencies the NPS stays below 10-6Dµm², and the S/N is better than 60dB to frequencies up to 4cy/mm, sufficiently high to precisely measure density variation σ(D) down to 0.001.
(7b)
The combined effect of M0(f), N0(f), and slope γ(D) of the scanner can be expressed as the signal-to-noise ratio2 S/N=q2, with
1 + m0 M 0 ( f ) γ (D )lg 1 − m0 M 0 ( f ) q( f , D ) = 2 f N0 ( f , D)
Visual Image Quality The weighting functions used to calculate visual from physical image quality also define the performance requirements of the scanner in the spectral, spatial, and density domains. The V(λ) function weighs the RGB scanner channels when calculating photopic visual densities using eq. (3). The contrast and graininess sensitivity functions define ranges of spatial frequency and density with the highest weight for image quality, with 95% of the weight within the spatial frequency region of 0.1 to 6.6cy/mm (fig. 5), and at densities below 1.6 (fig. 6). Comparing the spatial frequency dependence of contrast sensitivity with S/N ratio (fig. 5) shows that for spatial frequencies below 6.6cy/mm the S/N ratio of the scanner is still better than 40dB. Figure 6 shows that visual density readings are linear up to 2.0, sufficient for measuring visually weighted graininess. At higher densities, there is an increasing error from scanner flare.
(8)
5.E-06
0.8
4.E-06
0.6
3.E-06
MTF NPS
0.4
2.E-06
Density, Graininess Sensitivity
1.0
N(f,D=0.75)
M(f)
The MTF, NPS (Fig. 4), and S/N ratio (in dB, fig 5) of the PowerLook III scanner at 1200dpi and 42bits/channel were measured for a midtone density D0 = 0.75, assuming γ(D0) = 1, and a low input modulation m0 = 0.1.
1.E-06
0.2
0.E+00
0.0 0.1
1.0
10.0
spatial frequency [cy/mm] Figure 4. Measured MTF and NPS,
1
80
0.8
60
0.6 S/N of scanner Contrast Sensitivity
40 20
0.4 0.2
0 1.0
Scanner Density Response
1
Graininess Sensitivity
0 1 2 Density [IN]
3
Figure 6. Density response of flatbed scanner PowerLook III versus Graininess Sensitivity
The visual weighting functions qualify the significant spectral, spatial frequency, and density ranges for scanner performance. Visual weighting also makes the metrics robust and instrument-independent.
0 0.1
2
0
Contrast Sensitivity
20 log(S/N) [dB]
100
3
10.0
spatial frequency [cy/mm]
Results Figure 5. Signal-to-noise ratio of flatbed scanner PowerLook III, and human Contrast Sensitivity Function.
An example for the successful application of diagnostic tools was the minimizing of print line placement error in a high-speed thermal tandem printer.4 Monitoring line registration through large series of prints revealed that the active donor tension control has not only improved the accuracy of line placement but also controls color registration (fig. 7).
The high noise power at frequencies below 0.3cy/mm is due to large-area non-uniformity of the scanner response, but it is less problematic for periodogram NPS estimation (eq. 2) where the length L of the data segment sets the
144
IS&T's 2003 PICS Conference
Summary
Examples for image science applications of the physical and visual image quality metrics were: • Verification of the model-based thermal history control in improving sharpness, and equalizing MTF of leading, trailing, and lateral edges in a high-speed thermal printer,18
The Polaroid scanner-based image quality measuring system utilizes the imaging performance of flatbed scanners, and combines diagnostic tools with physical and visual image quality metrics. Applications are basic research studies, optimizing and calibrating digital photo printer hardware, process control, reliability testing, benchmarking, and competitive analysis. Deployed in research, development, and manufacturing, it has been instrumental in developing the new Polaroid instant thermal print technologies.
Correlating measured SQF and color registration for a specific print system in order to predict sharpness loss from registration error (fig. 8), • Studying the effect of halftone screens on the granularity versus density performance, and graininess of a direct thermal printer. 12
References
c-m registration error [µm]
1. 100
2. 0
with tension control without
-100
3. 4.
-200 -300
5.
-400 0
500
1000
1500
6.
2000
# of prints
7. Figure 7. Cyan-magenta registration error as a function of print number, without and with donor tension control. 8.
S harpnes s
1
9.
0.8
10.
0.6 11.
0.4 0.2
12.
0 0
50
100
150
200
250 13.
R egis tration error [µm] Figure 8. Sharpness loss from registration error.
14. 15. 16.
17.
145
H. Frieser, Photographic Information Recording, Focal Press, London/NewYork, 1975, pg. 375. E. Görgens, Methods for the Objective Evaluation of Image Quality, J. Inf. Rec. Mater. 15, 305 (1987). D. E. Coons, Kodak Professional ML-500 Digital Photo Print System, Proc. NIP18, pg. 184. (2002). S. S. Saquib, D. Hertel, J. W. Slack, B. Busch, R. G. Egan, Scanner-based Measurement of Print Line Placement, Proc. NIP18, pg. 195. (2002). R. E. Jacobson, An Evaluation of Image Quality Metrics, J. Phot. Sci. 43, 42 (1995). D. R. Rasmussen, P.A. Crean, F. Nakaya, M. Sato, E. N. Dalal, Image Quality Metrics: Applications and Requirements, Proc. PICS, pg. 174. (1998). D. Hertel, K. Töpfer, H. Böttcher, Image Quality Investigations by Means of Photodetector Arrays, J. Imaging Sci. and Technol. 38, 44 (1994). R. Rasmussen, B. Mishra, M. Mongeon, Using Drum and Flatbed Scanners for Color Image Quality Measurements, Proc. PICS, pg. 108. (2000). R. Dumas, S. Reele, Y. Kipman, Image Quality Testing on the Production Line, Proc. PICS, pg. 114. (2000). J. C. Briggs, Banding Characterization for Inkjet Printing, Proc. PICS, pg. 84. (2000). P. D. Burns, D. Williams, Using Slanted Edge Analysis for Color Registration Measurement, Proc. PICS, pg. 51. (1999). D. Hertel, B. O. Hultgren, Scanner-based Granularity Measurement on a Continuous Density Wedge, Proc. NIP18, pg. 189. (2002). U. Siemen, D. Hertel, Using a Wave Model to Study Light Propagation in Emulsion Layers Containing Realistically Shaped AgX Grains, J. Imaging. Sci. and Technol., 43, 70 (1999). T. N. Cornsweet, Visual Perception, Academic Press (1971). C. J. Bartleson, Optical Radiation Measurements, Vol. 5, Chapter 8, Academic Press, New York, 1984. J. Bowman, J. Bullitt, F.R. Cottrell, B.O. Hultgren, Color Print Image Quality, Proc. IS&T 42nd Annual Conf., pg. 465. (1989). Granger, E. M., Cupery, K. N., An Optical Merit Function (SQF), Which Correlates With Subjective Image Judgements, Phot. Sci. Eng. 16, 3 (1972).
IS&T's 2003 PICS Conference
18. S. S. Saquib, W. T. Vetterling, Model-Based Thermal History Control, Proc. NIP18, pg. 200. (2002).
optimizing image quality in digital print media and hardware.
Biographies
Jason Brogan obtained a Bachelor of Computer Science degree from the University of New Brunswick (U.N.B.) in Fredericton (Canada) in 1999. His internships included a stay at the Center for Nuclear Energy Research in Fredericton, NB. After graduating from U.N.B. he joined the Information Technology team at the Polaroid Corporation (2000). As a member of the Software Engineering team he became the architect of complex software structures and user interfaces that are instrumental for new instant digital products.
Dirk Hertel gained his physics degree (1979), and a Ph.D. (1989) for research work on the measurement and interpretation of microfilm image quality from the Technical University Dresden (Germany). He worked at the TU Dresden as assistant lecturer in imaging science, and researcher specializing in computer modeling and the microdensitometry of photographic image quality. Since joining the Polaroid Corporation in 1998 he has developed scanner-based print evaluation tools and worked on
146