Transportation Research Part F 8 (2005) 1–18 www.elsevier.com/locate/trf
Police officers seat belt use while on duty T. Oron-Gilad
a,b,*
, J.L. Szalma
a,b
, S.C. Stafford a, P.A. Hancock
a,b
a
b
Department of Psychology, University of Central Florida, P.O. Box 161390, Orlando, FL 32816-1390, USA Institute for Simulation and Training, University of Central Florida, P.O. Box 161390, Orlando, FL 32816-1390, USA Received 23 April 2004; received in revised form 6 October 2004; accepted 28 October 2004
Abstract Typical seatbelt designs can interfere with police officersÕ operational work by lengthening their response time in threatening situations. Therefore, in certain operational circumstances there is a direct conflict between operational safety (effective response to threat) and driving safety (seatbelt use). To evaluate this potential conflict, 341 police officers from the southeastern US completed a questionnaire that included work related and non-work related seatbelt usage information. Factor analysis revealed five influential and significant factors; (1) travel context, (2) crime context, (3) confidence in seatbelt design, (4) speed and distance of travel, and (5) seatbelt ergonomics. These results confirm that seatbelts themselves in police cruisers currently represent a real safety concern of police officers in high threat circumstances. Ó 2004 Elsevier Ltd. All rights reserved. Keywords: Seat belt use; Police officers
I always wear my seatbelt when off duty. I have found that while on duty (for me) it prevents me from exiting the car quickly—we don’t know what or when something bad is going to happen— but when it does I won’t be strapped in my car dead. If there was a better mechanism for the seatbelt—I would use them on duty (Anonymous Police Officer). *
Corresponding author. Address: Department of Psychology, University of Central Florida, P.O. Box 161390, Orlando, FL 32816-1390, USA. Tel.: +1 407 823 0923; fax: +1 407 823 0921. E-mail address:
[email protected] (T. Oron-Gilad). 1369-8478/$ - see front matter Ó 2004 Elsevier Ltd. All rights reserved. doi:10.1016/j.trf.2004.10.005
2
T. Oron-Gilad et al. / Transportation Research Part F 8 (2005) 1–18
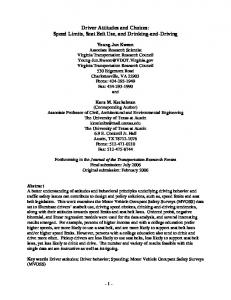
1. Introduction There have, and continue to be significant social efforts to increase seatbelt usage since for most vehicle users, increased compliance means increased safety in travel. However, for police officers working in high crime areas this is not necessarily true and there exists the real potential for a tradeoff between driving (transport) and operational (task) safety. Indeed, patrol duty is one of the most dangerous assignments for police officers (Barker, 1999). ‘‘Patrol officers are the frontline officers—the most likely to be injured or killed, the first on any crime scene and, usually, the first representative of the department encountered by victims, suspects, and witnesses’’ (Barker, 1999, p. 46). Despite the dangers involved, patrol is still viewed by officers as crucial and indeed the core of ÔrealÕ police work (Skolnick, 1966). Patrol officers generally work in three shifts; the day shift, the middle (afternoon/early evening) shift, and the night shift. There are distinctive differences in call types and workloads associated with different shifts (Barker, 1999). Day shift corresponds most with the normal working hours, while mid-shift finds people leaving work with more calls on business robberies, gang activities, drug and drinking problems, and more domestic violence. During the later part of the night shift it is easier to separate Ôgood guys from the badÕ (Barker, 1999, p. 59) since most law-abiding citizens are asleep or at least remain in their homes. During this shift especially, officers tend to inform each other of their location and if possible, join in backup of their fellow officers. According to the New Jersey State Police most of the assaults on officers occur between 6 PM and 4 AM (the middle and night shift), with a peak around midnight. The lowest number of assaults is during the morning hours (4 AM to 2 PM) and it starts to increase after 2 PM as shown in Fig. 1. It is therefore not surprising to expect difference in officersÕ perception of risk and that such perception of threat varies across work shifts.
Fig. 1. Assaults on police officers by hour of day, in state of New Jersey, USA, in the year 2000 (New Jersey State Police Official Website, 2004).
T. Oron-Gilad et al. / Transportation Research Part F 8 (2005) 1–18
3
The patrol officer is often the first responder among the various emergency services which include police, fire, and paramedic units. Indeed, patrol officers spend most of their time responding to calls for assistance. According to a study by Boston Police Department activities, approximately 55% of these calls require immediate or at least medium priority response (Nesbary, 1998). The records of the New Jersey Police show that in the year 2000, 28% of all the police assaults occurred when officers responded to disturbance calls (New Jersey State Police Official Website, accessed 2004). Response time to high priority calls varies among the many law enforcement agencies. The acceptable range within the Southeastern region of the United States is estimated as 2–3 min. This time estimate includes the response of the 911 call taker, communication with dispatch to the police officer and the actual driving time to the scene. The speed and safety of the patrol officer arriving at a call for help depends on the officers skills and the technology on hand. Patrol officersÕ work relies mostly on the ‘‘police squad car’’ which they use to get to a destination quickly and safely. The technology of the police squad car has developed in recent years. Cars are now commonly equipped with laptops which can access data bases of criminal records for identification matching and background checks. Squad cars have become ruggedized to handle the stress of high performance and high demand driving. Special strobe-light bars have been developed which offer a greater degree of visibility for officers operating in an emergency mode. The improvements of the squad car are mainly technology-driven and done mostly by adding systems to a standard vehicle. At the same time, safety devices, such as the seat belt, remained unaltered and their standard features have not been modified in respect of the added equipment or in accordance with other officers needs. For instance, patrol officers are required to enter and exit their vehicle much more often than ordinary travelers. This wears out seatbelt mechanisms that were not built for such an exhaustive usage. In recent years, populations with special seatbelt needs have been identified; among those are the elderly and the very young children. However, patrol officers seem not to be considered as a population with special needs, possibly due to the sensitivity of the issue—no police officers would like to admit openly that they are not using their seatbelt—and also possibly due to the fact that this issue was never brought back to the car manufacturers as a design requirement. Officers on patrol duty are expected to comply with seatbelt laws and serve as an example for the citizenry. Seatbelt usage has been estimated to be 40–50% effective in preventing fatalities (Cummings, Wells, & Rivara, 2003; Partyka, 1988). Possibly, the high exposure of officers to traffic accidents and their effects makes officers more aware of the importance of safety devices such as seatbelts than any other population (see Groeger, 2000; Groeger & Chapman, 1996 on the perception of danger in driving). Yet, there has been very little research regarding police officers driving habits, particularly seatbelt use. In regard to driving ability, Dorn and Brown (2003) have found that police officers do not perceive themselves as better drivers than others (see Groeger & Grande, 1996 on driverÕs self assessment of skill). On the contrary, officers claim that they need more specific driving training (e.g., night driving training). Dorn and BrownÕs findings are very important since they contradict claims that police officers perceive themselves as better drivers or have more confidence in their own driving ability (an observation which has been found among young male drivers in general e.g., Groeger & Brown, 1989). Again, this is possibly due to the officersÕ high exposure to traffic accidents. It is the case that the typical/standard seatbelt design can interfere with police officersÕ operational work, for example, by lengthening response time to a threatening situation. Thus, in certain
4
T. Oron-Gilad et al. / Transportation Research Part F 8 (2005) 1–18
operational circumstances there is a direct conflict between operational safety (effective response to the proximal threat) and driving safety (seatbelt use). In the past two years, shootings and automobile accidents were cited as the leading causes of death among police officers (FBI National Press Office, 2003; National law memorial fund, 2004). According to preliminary numbers recently released jointly by the National Law Enforcement Officers Memorial Fund (NLEOMF) and the Concerns of Police Survivors (COPS) 82 law enforcement officers were killed in the United States in the line of duty during the first six months of 2004. This represents more than a 7% increase from the 76 officers who lost their lives during the same period in 2003. Over the last 10 years, an average of 166 officers have died annually. Of the 82 officers, 33 were shot, 24 died in automobile accidents, nine officers succumbed to job-related illnesses, seven were struck by automobiles while outside of their own vehicles, four died in motorcycle accidents, two officers were killed in an aircraft accident, one officer was beaten to death, one officer drowned, and one officer fell to his death. Within this delicate balance between operational and driving safety there are many specific situations where the use of the seatbelt not only does not enhance the police driverÕs safety but actually creates a higher risk by preventing quick maneuvers and the easy access of the officer to his/her weapon. As a consequence, we need to know much more about these specific situations and tradeoffs in order to seek and apply revised designs that permit optimal safety for officers in respect to both sources of threat. The primary goal of the present study was to examine this conflict by providing information concerning officers responses to these two sources of safety concerns.
2. Method 2.1. Participants The questionnaire was distributed to 600 members of Police Departments in municipalities in the southeastern United States. More than half, 56.8% (341 of 600) returned the questionnaire. These officers volunteered to participate in the study without compensation for their time or effort. 2.2. Questionnaire and Measures A pilot study was conducted prior the present study. In this initial procedure the questionnaire was distributed to 20 police officers who completed the survey and provided feedback as to the appropriateness of the individual questions. In order for officers to freely discuss their ideas and opinions during feedback sessions they were assured of confidentiality and anonymity. The police officers were informed that none of the information collected would be identified with individuals and that the data would not be compiled and tabulated by either squad shift, or by police department. It is important to note that the police officers specifically asked for a Ôfree textÕ section to provide written feedback on the questionnaire so that they could express their own individual ideas. The final questionnaire consisted of 62 items divided into six sections: (1) demographic information (9 items); (2) personal habits regarding seatbelt use at home and at work (28 items) on a
T. Oron-Gilad et al. / Transportation Research Part F 8 (2005) 1–18
5
scale of 1–5 (1-never and 5-always) ; (3) estimations of number of daily events related to seatbelt usage (3 items); (4) opinions regarding seat belt use during a work shift (15 items) on a scale of 1–5 (1-strongly disagree and 5-strongly agree); (5) seatbelt wearing and releasing time related issues (6 items) on a scale of 1–3 (1-satisfactory and 3-needs a lot of improvement); and (6) a free text area for officers to express their own opinion. The questionnaire included a cover letter describing the general purpose of the study and assuring the anonymity of the responses. The cover letter also clearly indicated that the filling of the questionnaire was completely voluntary and that they have to participate in the study if they did not wish to. 2.3. Procedure Questionnaires were administered to officers at the beginning of their shift by their shift commander. Officers were instructed to complete the questionnaire by the end of their shift and to deposit it in specified location (mailbox) to be collected later by the experimenter. Officers did not return the questionnaire to their shift commander. The questionnaire was distributed to police officers with great care as to ensure anonymity and confidentiality. It should be emphasized that the experimenters went to great lengths to provide assurance to the police officers that the data collected would not be individually identified or used in relation to the police officers or the police department in any fashion. To assure confidentiality, we sacrifice analysis by both department, and region. The officers were told that their individual data would be collapsed with other officerÕs data from various police departments. The sensitive nature of the topic had all those who were involved in the experiment constantly working to ensure the confidentiality.
3. Results The effects of work shift, perceived threat, and emergency on seatbelt usage were analyzed. In addition, free response feedback, which was considered very important by the police officers who participated in the first stage of the study was also analyzed. 3.1. Socio-demographic and shift work characteristics Table 1 summarizes the socio-demographics of the 337 police officers who were included in the analysis. Their average age was 37 years (range 21–57 years). Their average years of service were 11 years (range 0–32). Handedness and Body Mass Index (BMI) were also recorded in order to see whether physical dimensions or handedness had an effect on seatbelt usage. Four questionnaires (out of the 341 received) were excluded from the analysis due to a very low rate of questions answered. The departments included in this survey operated in fixed shift assignments which means that officers were assigned to a shift permanently (or until they request a transfer). Three shifts were examined: day (starting from 5 to 9 AM and ending between 3 and 6 PM), mid-shift (starting from 12 to 2 PM and ending between 8 and 11 PM), and night shift (starting from 6 to 10 PM and ending between 6 AM and 9 AM the next morning). The distribution of officers according
6
T. Oron-Gilad et al. / Transportation Research Part F 8 (2005) 1–18
Table 1 Distribution of participants by socio-demographic variables Variables
Mean
Gender Men Women Age Rank Officer Corporal and higher Years of service Body mass index (BMI) Handedness Left handed Right handed Missing data
N 289 (86%) 48 (14%) 37 N 258 (77%) 79 (23%) 11 28.2 N 24 (7%) 311 (93%) 2 (0%)
SD
8
8 4.8
to their assigned shift was: 49.7% assigned to day shift, 20.7% assigned to mid shift and 29.6% to night shift. 3.2. Factor analysis An oblique factor analysis was used in one initial run for 43 items; the personal habits regarding seatbelt use at home and work (28 items), and the opinions regarding seatbelt use during a work shift (15 items). The final factor solution for the analysis met the following criteria: (a) each one was based on factors with eigenvalue > 1.0; (b) individual items correlated with the factor concerned at the 0.60 level or above; and (c) only items with a communality of >.50 were selected. Due to missing cells only 235 (70% of the total) participants were included in the factor analysis. The distribution of these officers according to their assigned shift was: 119 (51%) assigned to day shift, 48 (20%) assigned to mid shift and 67 (29%) to night shift, and 1 missing data (0%). Five factors emerged that influenced the use of seatbelts as shown in Tables 2 and 3: (1) workrelated travel (travel context); (2) seatbelt use at varying threat levels (crime context) (3) confidence in seatbelt at varying threat levels (confidence in seatbelt design); (4) speed and distance Table 2 Factor correlation matrix Factor
Travel context (travel tasks in police work)
Crime context (threat level)
Seat belt context (confidence in seat belt design)
Speed and distance of travel
Ergonomics of the seat belt
1 2 3 4 5
1.00
.51* 1.00
.50* .37* 1.00
.68* .21* .29* 1.00
.08 .02 .26* .09 1.00
*
Correlation significant at p > .01.
T. Oron-Gilad et al. / Transportation Research Part F 8 (2005) 1–18
7
Table 3 Analysis of the 45 items of seatbelt usage following the oblimin rotation (only individual items that correlated with a factor at a level 0.6 or above were included) 1 Q1-SB usage and traffic accident Q2-SB usage in drug problem area Q3-SB usage in high crime area Q4-SB usage in low crime area Q5-SB got caught in equipment in emergency Q6-SB got caught in equipment in non-emergency Q7 - - - - Q8 - - - - Q9 - - - - Q10-SB usage in residential areas Q11-SB usage at 25 mph Q12-SB usage at 35 mph Q13-SB usage at 45 mph Q14-SB usage at 55 mph Q15-SB usage at 65 mph Q16-SB usage in the rain Q17-SB usage while backing up another officer Q18-SB usage in low visibility conditions Q19-Emergency response within 0.5 mile Q20-Emergency response within 1 mile Q21-Emergency response within 2 miles Q22-Emergency response within 4 miles Q23-Non-emergency response within 0.5 mile Q24-Non-emergency response within 1 mile Q25-Non-emergency response within 2 miles Q26-Non-emergency response within 4 miles Q27 - - - - Q28 - - - - Q32 - - - - Q33 - - - - Q34-It takes too long take off SB in a hurry Q35-Pedestrian approaches in low crime area Q36-Pedestrian approaches in high crime area Q37-Confidence in SB in high crime area Q38-Confidence in SB in low crime areas Q39-Confident in overall performance of SB Q40-I often take my SB off in a high crime area Q41 - - - - Q42 - - - - Q43 - - - - Q44 - - - - Q45 - - - - Q46 - - - - - - - Marked questions were not contributing to any factor.
.93 .66 .66 .86
2
3
4
5
.72 .96 .95 .63 .88 .90
.83 .89 .96 .97 .96 .93 .91 .84 .91 .71 .78 .84 .84 .86 .94 .97 .96
.71 .62 .66 .70 .75 .77 .82 .77 .63 .75 .85 .92 .62 .68 .72
.69 .80 .83 .87 .87 .86 .73
8
T. Oron-Gilad et al. / Transportation Research Part F 8 (2005) 1–18
of travel, and (5) experience with the seatbelt getting caught on equipment (seatbelt ergonomics). These accounted for 63.9% of the total variance. Labels for the five factors have been derived through examination of the salient factor loadings. The first factor accounted for 47.6% of the variance and consisted of a broad spectrum of items that are related to the driving in police work in various threat and emergency situations. Hence this factor reflects upon the travel demands and the travel context of police work. Possibly, this substantive amount of explained variance reflects the high usage rate of seat-belts among officers and also a high level of awareness to the importance of seatbelt. Considering the fact that officers are very often the first official emergency responders to arrive to any traffic accident, it is reasonable to assume that they are highly aware of the importance of seatbelts (see also Groeger, 2000). The second factor accounted for 5.2% of the variance and consisted of items related seatbelt use under different levels of threat. The third, fourth and fifth factors accounted for 4.5%, 4.0%, and 2.6% of the variance, respectively. The third factor consisted of items related to confidence in seatbelt at different levels of threat and reflects mainly upon design limitations of current seatbelts. The fourth factor was related to two sets of items, one that dealt with travel speed and the other that dealt with distance from destination of call under varying levels of emergency, this factor reflects upon the nature of patrol work—mainly responding to various calls. The fifth factor reflected upon two specific items related to the frequency of the seatbelt getting caught on the officersÕ equipment in emergency and non-emergency situations. The second, third, and fourth factors were correlated with the first factor as can be seen in Table 2. The reason we chose to leave these factors in the analysis is that each one of them reflects upon a different dimension related to police work and the usage of seatbelt and by maintaining these variables we were able to gain better understanding of these dimensions. Factors 2 and 3 had a negative correlation with Factor 1, indicating that these two factors reflect upon the major threatening situations where officers choose not to wear their seatbelts. Factor 4, on the contrary, is positively correlated with factor 1, again reinforcing the use of seatbelt at any time, especially when traveling a distance, or at high speed regardless of the emergency of the call. Factor 5 is moderately correlated with Factor 3 indicating that they both reflect upon the current seatbelt design. To determine the effect of shift and rank (officer versus corporal and higher) on each factor, a two-way ANOVA was conducted. For Factor 1 the main effect of shift was significant (F(2, 234) = 9.82, p < .0001, f = .04), and the main effect of rank was not (p > .05). For Factors 2 and 3 the main effects of both shift and rank were significant (F(2, 234) = 12.54, p < .0001, f = .07) and (F(1, 234) = 10.03, p < .005, f = .06), (F(2, 234) = 6.28, p < .005, f = .08) and (F(1, 234) = 10.28, p < .005, f = .02), accordingly. For Factor 4 only the main effect of shift was significant (F(2, 234) = 5.07, p < .01, f = .04). A possible explanation for the effect of rank on Factors 2 and 3 is that unlike regular officers, higher-ranking officers are generally not the first to arrive at crime scenes. This reduces their level of perceived risk in high threat environments. Post-hoc comparisons (Tukey-HSD) on shift for Factors 1–3 showed significant differences between the day shift and the other two shifts (p < .01) but no significant differences between the middle and the night shift. For Factor 4, there were only significant differences between the day shift and the night shift (p < .01). The significant difference between the day and the other two shifts is probably due to the difference in threat level and in the perceived risk of being assaulted. There were no significant effects for shift or rank for Factor 5, which is quite expected
T. Oron-Gilad et al. / Transportation Research Part F 8 (2005) 1–18
9
due to the items that this factor reflects upon. The effect of handedness (left handed or right handed) and BMI were also examined on each factor but had no significant effects (p > .05). 3.3. The effect of high versus low threat on seatbelt use Factor 2 reflects the questions that are of particular relevance to the effect of threat level on seatbelt use. Questions 2, 3, and 40 specifically addressed seatbelt usage in high crime areas while Questions 4 and 10 related to seatbelt use in low crime areas. Overall officers reported more usage of seatbelt in low crime areas (Q4 and Q10) than in high crime areas (Q2 and Q3). On a scale of 1– 5 [1-never, 5-always], the average scores were 4.06 (SD = 1.25) and 3.85 (SD = 1.35) versus 3.15 (SD = 1.56) and 3.18 (SD = 1.59), respectively. Scores were above the midpoint of the scale for both high and low threat areas, implying that most of the time the officers were using their seatbelts. To determine the effect of environmental threat and shift on officersÕ estimated frequency of use of their seatbelt, the following analysis was conducted. Threat was defined as high versus low crime areas (Q3 and Q4). Three shifts were examined: day, middle, and night shifts, as well as the officersÕ rank (officer versus corporal and higher). A 2 (threat) by 3 (shift) by 2 (rank) mixed ANOVA with repeated measures on the first factor revealed a significant effect for threat (F(1, 322) = 128.76, p < .001, f = .29), with officers reporting greater confidence in use of their seatbelts in low threat compared with high threat areas. A significant effect was also observed for shift (F(2, 322) = 13.82, p < .001, f = .08). Post-hoc tests using the Tukey HSD procedure indicated that officers reported greater confidence in seat belt use during a day shift than in either the middle or night shifts. The means for the latter two shifts did not differ significantly from one another. A significant effect was also observed for rank (F(1, 322) = 9.30, p < .005, f = .04), where the higher rank officers reported a higher level of compliance with the seatbelt laws. The interaction of Threat by Shift was significant (F(2, 322) = 5.84, p < .005, f = .03). The interaction between all three factors was not statistically significant (p > .05, f = .01). Fig. 2 provides the estimated frequency of seatbelt use for Questions 3 and 4 as a function of shift and rank. Fig. 3 provides the level of agreement with the statement that seatbelt are often taken off in high crime area (an inverted version of Q40). 3.4. Confidence in seatbelt at different threat levels Factor 3 dealt with the confidence in seatbelt performance which may reflect upon seatbelt design. Confidence in seatbelt design was examined by looking at threat level and situation characteristics. To determine the effect of environmental threat and situation characteristics, as well as, shift on officersÕ confidence regarding their ability to effectively perform their operational duties while wearing their seatbelt, the following analysis was conducted. Threat was defined as high versus low crime areas (Q35 and Q38 versus Q36 and Q37). Two situations were defined; a person approaching the police car and general patrol work (Q35 and Q36 versus Q38 and Q37). Three shifts were examined: day, middle, and night shifts. A 2 (threat) by 2 (approaching person or in general) by 3 (shift) mixed ANOVA with repeated measures on the first and the second factor revealed a significant effect for threat (F(1, 327) = 77.43, p < .001, f = .19), with officers reporting higher confidence in seatbelts at lower threat levels. A significant effect was also observed for the
10
T. Oron-Gilad et al. / Transportation Research Part F 8 (2005) 1–18
Fig. 2. Estimated frequency of seatbelt use as a function of shift and rank in high and low crime areas (bars represent confidence intervals for mean at 95%).
Fig. 3. Level of agreement with the statement ‘‘I often leave my seatbelt on in a high crime area’’ for officers and higher ranks (bars represent 2 standard error of mean).
situation (F(1, 327) = 5.17, p < .05, f = .02), where overall, officers had more confidence in the seatbelt during general patrol work than when a pedestrian was approaching their vehicle. A significant effect was also observed for shift (F(2, 327) = 10.02, p < .001, f = .06). Post-hoc tests using the Tukey HSD procedure indicated that officers reported greater use of seatbelt during the day shift than in either the mid or night shifts. The means for the latter two shifts did not differ significantly from one another. The interaction for Threat by Situation by Shift was significant (F(2, 327) = 3.23, p < .05, f = .02). Fig. 4 provides the estimated confidence in seatbelt as a function of threat, situation, and shift. During the day shift there were significant differences in the low crime area between situations (t(196) = 3.02, p < .005, f = .19), and the confidence in the seatbelt
T. Oron-Gilad et al. / Transportation Research Part F 8 (2005) 1–18
11
Fig. 4. Estimated confidence in seatbelt design in high and low crime areas as a function the situation and the shift. * Difference significant at p < .05, all three main effects were significant.
12
T. Oron-Gilad et al. / Transportation Research Part F 8 (2005) 1–18
was lower when a pedestrian approached the vehicle. During mid-shift there were no significant differences between situations. During the night shift we found significant differences between situations for both high and low crime areas accordingly (t(96) = 2.25, p < .05, f = .17 and t(95) = 2.17, p < .05, f = .22), where the estimated confidence in the seatbelt was lower when a pedestrian approached the vehicle. 3.5. The effect of travel speed and duration of drive on seatbelt usage Factor 4 reflects upon two elements related to responding to calls which are travel speed and the distance from call destination. To determine the effect of travel speed and shift on officersÕ confidence regarding their ability to effectively perform their operational duties while wearing their seatbelt, the following analysis was conducted. Five speed categories were defined 25, 35, 45, 55, and 65 mph (Q11–Q15). Three shifts were examined: day, middle, and night shifts, as well as the officersÕ rank (officer versus corporal and above). A 5 (speed) by 3 (shift) by 2 (rank) mixed ANOVA with repeated measures on the first factor revealed a significant effect for travel speed (F(4, 325) = 63.13, p < .001, f = .16), with officers reporting higher use of seatbelt as their travel speed increased. A significant effect was also observed for shift (F(2, 325) = 8.50, p < 001, f = .05). Post-hoc tests using the Tukey-HSD procedure indicated that officers reported greater use of seatbelt during the day shift than in either the mid or night shifts. The means for the latter two shifts did not differ significantly from one another. The interaction between Travel speed by Shift was not statistically significant (p > .05, f = .02). A significant effect was also observed for rank, F(1, 325) = 4.57, p < .05, f = .01, where the higher ranking officers reported on a higher level of compliance with the seatbelt laws. The interaction between all three factors was also not statistically significant (p > .05, f = .00). Fig. 5 provides the estimated frequency of seatbelt use as a function of travel speed, shift and rank. The means of the estimated seatbelt use frequencies for all shifts were above the midpoint of the scale (3), indicating that most of the time officers do wear their seatbelts while traveling even in the lower speed categories. In addition, the effect of adverse weather conditions such as rain (Q16) and low visibility (Q18) were examined and in both cases compliance with seatbelt use was high (Mean = 4.57, SD = 3.36 and Mean = 4.31, SD = 1.11, respectively). There were no significant differences between shifts. 3.6. The effect of travel–distance, emergency and non-emergency situations on seatbelt usage The effect of distance from destination on seatbelt usage was examined by looking at emergency versus non-emergency situations. To determine the effect of distance to the destination, emergency and non-emergency events, and shift on officersÕ confidence in seat belt, the following analysis was conducted. Four distance categories were defined; half mile, one mile, two miles, and four miles away from the destination (Q19–Q26). Three shifts were examined: day, middle, and night shifts. A 4 (distance) by 2 (emergency and non-emergency) by 3 (shift) mixed ANOVA with repeated measures on the first and the second factor revealed a significant effect for distance (F(3, 327) = 122.45, p < .001, f = .27), with officers reporting higher use of seatbelt as their destination was further away. A significant effect was also observed for emergency (F(1, 327) = 9.53, p < .005, f = .03), where overall seatbelt use was lower in an emergency situation compared with a non-emergency one. A significant effect was also observed for shift (F(2, 327) = 12.65, p < .001,
T. Oron-Gilad et al. / Transportation Research Part F 8 (2005) 1–18
Fig. 5. Estimated frequency of seatbelt use as a function of travel speed, shift and rank.
13
14
T. Oron-Gilad et al. / Transportation Research Part F 8 (2005) 1–18
f = .07). Post-hoc tests using the Tukey HSD procedure indicated that officers reported greater use of seatbelt during the day shift than in either the middle or night shifts. The means for the latter two shifts did not differ significantly from one another. The interaction between Distance and Shift was significant (F(6, 327) = 5.90, p < .005, f = .04), and so was the interaction between Distance and Emergency (F(3, 327) = 24.62, p < .001, f = .07). The interaction between all three factors was not statistically significant (p > .05, f = .00). Fig. 6 provides the estimated frequency of seatbelt use as a function of distance from destination, emergency, and shift. Here again we see that the means of the estimated frequencies of seat belt use among officers were high (above mid point) regardless of the level of emergency or the distance from destination. 3.7. Seatbelt caught on equipment Factor 5 reflected upon Q5 and Q6 that specifically addressed the question of whether the seatbelt gets caught on equipment while getting out of the car in emergency and non-emergency situations. While there were significant differences between the two (t(334) = 5.6, p < .001, f = .19) the means for both question 5 (mean = 2.85, SD = 1.04) and question 6 (Mean = 2.65, SD = 1.06) were below the midpoint of the scale indicating that such problems did not occur on a regular basis. In Q29 officers were asked to estimate the number of times that the seatbelt got caught in their equipment during an average shift. Forty two (13%) of the officers reported that this never happened to them. One hundred and thirteen (34%) estimated that that seatbelt gets caught 1–2 times per shift. An additional 104 (31%) estimated that it happens 3–5 times per shift, and the remaining 76 (22%) estimated that it happens 6–9 times per shift. This is a pure ergonomic issue and even though it was not perceived by the officers as the main reason for not using their seatbelts, this factor may have contributed to the lack of confidence in seatbelt design reflected upon in Factor 3 since 87% did actually perceive some active interference on a daily basis. 3.8. The effect of training and awareness on seatbelt use Questions 43–45 addressed the influence of Police Academy training (Q43), field training officers (Q44), and agency policy (Q45) on seatbelt use. A repeated measures ANOVA was significant (F(2, 334) = 125.9, p < .001, f = .27). Indicating that the most influential of the three was the agency policy (mean = 3.47, SD = 1.35), followed by the field training (mean = 2.92, SD = 1.28), and the police academy had the least influence (mean = 2.56, SD = 1.27). These data show that the agency policy regarding seatbelt use is influential on officersÕ behavior regarding to seatbelt usage. 3.9. Seatbelt use while off duty Questions 27–28 addressed use of seatbelt while off duty, officers reported on a high compliance level both in their personal vehicle (mean = 4.47, SD = 1.07) and in their police vehicle (mean = 4.50, SD = .97). This is important since it has been suggested that police officers represent just one of a collective group who are personally averse to seatbelt usage (as a baseline for comparison the US national average seat belt use for the year 2003 was estimated at 79% (NHTSA, 2004)). In contrast, this data indicate a high degree of compliance during off duty hours and thus
T. Oron-Gilad et al. / Transportation Research Part F 8 (2005) 1–18
15
Fig. 6. Estimated frequency of seatbelt use as a function of distance from destination, emergency and shift.
neglect of seatbelt use on duty is not simply a reflection of personal preferences but rather is a rationale response to the specific conditions encountered.
16
T. Oron-Gilad et al. / Transportation Research Part F 8 (2005) 1–18
3.10. Required improvements to the current seatbelt settings The more specific questions (Q47–Q52) dealt with the areas which required improvement in seatbelt design. Here, 51% of the officers thought that the time it takes to put on the seatbelt should be improved (Q47). Further, 67% of the officers thought that the time to take off the seatbelt should be improved (Q48). Of the total sample, 82% of the officers thought that drawing the weapon while using a seatbelt should be improved (Q49) while only 50% of the officers admitted that they still had a problem in drawing their weapon while not using the seatbelt (Q50). Of the officers, 58% had some problems with the pull mechanism of the seatbelt (Q51). And finally, 74% of the officers would like to see a major change in the seatbelt process.
4. Discussion For most drivers and occupants of passenger vehicles, the overwhelming concern is for safe passage of travel between origin and destination (see Gibson & Crooks, 1938). That task having been completed, there is in an overwhelming number of cases, the time to remove seatbelts, collect and gather up belongings and exit the vehicle in a simple, orderly manner. In this fashion, they are very much akin to commercial airline passengers who, although they may be in a hurry, find no fundamental conflict between safety and other concerns. If everyday travelers are like airline passengers, police officers are much like Special Forces. They not only have to get to the destination but they must respond quickly and efficiently during that process of arrival otherwise the purpose of their journey may well not be achieved. At the point of arrival, they continue to face HaddonÕs (1970) kinetic ÔtigerÕ but the source of threat is rapidly evolving from a one-ton vehicle at 60 mph to a one ounce bullet at 1200 mph. The officer cannot afford to ignore either threat at the expense of the other and as the present findings show, they adjust their behavior accordingly. The collective results support a hypothesis that police officers perceive a conflict between operational and driving safety. These effects are especially evident in high threat situations, and during later work shifts (see Figs. 2–4). The latter results are likely due to the fact that officers typically experience higher workload (e.g., more threatening dispatch calls and more events requiring immediate response) during the middle and night shifts than during the day shift. Our findings further indicate that the current seatbelt designs in police cruisers paradoxically represent a safety problem to the officers, in particular in high crime areas. Although they are aware of the importance of seatbelt use on driving safety (Factors 1 and 4, and also Fig. 5 and Fig. 6). There are situations in which the perceived risk from wearing the seatbelt exceeds the one of not wearing it (Factors 2 and 3). In those high threat situations officers are not concerned with putting their seatbelt on. The question that addressed putting the seatbelt on (Q33) had no significant effect on any of the factors that we identified. It is taking the seatbelt off that concerns the officers because the time-to-exit (time to get out of the police squad car) and the time-to-draw (a secured seatbelt can in some cases add another step to drawing a weapon) are perceived as too long with the current vehicle– driver–seatbelt settings. Clearly this indicates that non-usage of seatbelt while on duty is not a problem related to officers ignoring of the importance of seatbelt use in vehicles in general. On the contrary, we found that officers use their seatbelt regularly when off duty or when traveling at high speed (even while on duty). Non-usage of seatbelt is a result of a poor,
T. Oron-Gilad et al. / Transportation Research Part F 8 (2005) 1–18
17
ill fitting design that endangers the officers in threatening situations because it reduces their mobility and increases the risk of them being superceded by criminals and suspects. The results of this study imply that the current protective envelope that officers are provided needs to be redesigned and adjusted to their specific needs. In particular there is a need to reduce the time-to-exit and increase officersÕ maneuverability. For the short and mid-term, we suggest that small changes in the buckling point of the seatbelt be made. Such a change may be able to reduce incidents where equipment gets caught. For the long term a superior internal design of the squad car is required. This design should be use-centered (Flach & Dominguez, 1995) and should include safety solutions that will not interfere with the officersÕ egress from the vehicle. More suitable seatbelt design may also be useful for other operational situations such as military vehicles (Naylor, 2003) or other work domains that include high-threat environments including peace-keeping operators and emergency service activities. There is little doubt that seatbelt use saves lives. The higher the degree of compliance, the greater the social protection that this technology renders. However, the belief that 100% compliance to standard seatbelt use is the fundamental goal is to misunderstand the purpose of transportation for some small but select users of the transport system. Certain specific sections of the traveling population have multi-leveled goals, some of which are in a degree of inherent conflict with safe transit. To police officers, this conflict need not necessarily persist but does at present because of the perpetuation of population-based designs which are somewhat of odds with their particular needs. Through our present confirmation of such inherent conflict we seek avenues of reconciliation through design, engineering, and training approaches which will alleviate such conflict and allow those in law enforcement to go about their necessary duties as safely as possible. Acknowledgments The authors wish to thank the Heads of the Police Departments who let us perform the survey among their officers. The authors would also like to express their gratitude to the 341 police officers who voluntarily completed the survey and expressed their valuable comments for the sole purpose of contributing to a research study. Karen Delos Santos, our student, who helped in data collection, is also acknowledged. The authors would also like to acknowledge Dr. P. Ward for his contribution to this study. This work was facilitated in part by the Department of Defense Multidisciplinary Research Initiative (MURI) program administered by the Army Research Office under grant DAAD19-01-1-0621. P.A. Hancock, Principal Investigator. The views expressed in this work are those of the authors and do not necessarily reflect the policy of any named agency.
References Barker, J. C. (1999). Danger, duty, and disillusion: The worldview of Los Angeles police officers. Prospect Heights, IL: Waveland Press. Cummings, P., Wells, J. D., & Rivara, F. P. (2003). Estimating seat belt effectiveness using matched-pair cohort methods. Accident Analysis and Prevention, 35, 143–149. Dorn, L., & Brown, B. (2003). Making sense of invulnerability at work: A qualitative study of police drivers. Safety Science, 41, 837–859.
18
T. Oron-Gilad et al. / Transportation Research Part F 8 (2005) 1–18
Federal Bureau of Investigation National Press Office (2003). Fact sheet for law enforcement officers killed and assaulted, 2002. Washington, DC: Federal Bureau of Investigation National Press Office. Available from: http://www.fbi.gov/ pressrel/pressrel03/leoka02press.htm. Flach, J. M., & Dominguez, C. O. (1995). Use-centered design: Integrating the user, instrument, and goal. Ergonomics in Design, 3, 19–24. Gibson, J. J., & Crooks, L. E. (1938). A theoretical field-analysis of automobile driving. American Journal of Psychology, 51, 453–471. Groeger, J. A. (2000). Understanding driving: Applying cognitive psychology to a complex everyday task. Hove, UK: Psychology Press. Groeger, J. A., & Brown, I. D. (1989). Assessing oneÕs own and othersÕ driving ability: influences of sex, age, and experience. Accident Analysis and Prevention, 21(2), 155–168. Groeger, J. A., & Chapman, P. R. (1996). Judgment of traffic scenes: The role of danger and difficulty. Applied Cognitive Psychology, 10, 349–364. Groeger, J. A., & Grande, G. E. (1996). Self-preserving judgments of skill. British Journal of Psychology, 87, 61–79. Haddon, W. (1970). On the escape of tigers: An ecologic note. Technology Review, 72, 44–47. National law officers memorial fund (2004). Law enforcement officer fatalities reach 148 for 2003—shootings and automobile accidents cited as leading causes of death. Press release January 5, 2004. Available from: http:// www.nleomf.com/. National Highway Traffic Safety Administration (2004). Safety Belt use in 2004—overall results. Report number DOT HS B09 783. Available from: http://www.nhtsa.dot.gov/people/injury/Traffic-Safety-Facts/Research-Notes/SeatBeltUse-2004/images/RN%20Final.pdf. Naylor, S. D. (2003). Heroes everywhere I went. Army Times, 63(44), 8. New Jersey State Police Official Website (2004). Crime reports and Statistics: 2000 Uniform crime report section X: Law enforcement officers killed and assaulted summary. Available from: http://www.njsp.org/info/ucr2000/ sec10ucr2000.htm. Nesbary, D. K. (1998). Handling emergency calls for service: organizational production of crime statistics. Policing: An International Journal of Police Strategies and Management, 21(4), 576–599. Partyka, S. C. (1988). Lives saved by seat belts from 1983 through 1987. DOT HS 807 324. National Highway Traffic Safety Administration, Washington, DC. Skolnick, J. H. (1966). Justice without trial. New York: John Wiley and Sons.