Public Works Management & Policy http://pwm.sagepub.com/
Public Works Policy Implications of Sustainable Reverse Logistics Operations Chad R. Miller and M. D. Sarder Public Works Management Policy 2012 17: 68 originally published online 6 December 2011 DOI: 10.1177/1087724X11429044 The online version of this article can be found at: http://pwm.sagepub.com/content/17/1/68
Published by: http://www.sagepublications.com
Additional services and information for Public Works Management & Policy can be found at: Email Alerts: http://pwm.sagepub.com/cgi/alerts Subscriptions: http://pwm.sagepub.com/subscriptions Reprints: http://www.sagepub.com/journalsReprints.nav Permissions: http://www.sagepub.com/journalsPermissions.nav Citations: http://pwm.sagepub.com/content/17/1/68.refs.html
>> Version of Record - Feb 14, 2012 OnlineFirst Version of Record - Dec 6, 2011 What is This?
Downloaded from pwm.sagepub.com by guest on October 11, 2013
429044 and SarderPublic Works Management & Policy
PWM17110.1177/1087724X11429044Miller
Public Works Policy Implications of Sustainable Reverse Logistics Operations
Public Works Management & Policy 17(1) 68–82 © The Author(s) 2012 Reprints and permission: sagepub.com/journalsPermissions.nav DOI: 10.1177/1087724X11429044 http://pwm.sagepub.com
Chad R. Miller1 and M. D. Sarder1
Abstract The tremendous growth in returns has enthused private sector interest in reverse logistics (RL) as firms attempt to meet various challenges, but the implications of this trend have garnered limited public sector attention. In today’s highly competitive global economy, the ability to efficiently and effectively handle returns provides a competitive advantage so public works policy that facilitates sustainable RL through lean and green operations can support economic development. This article conducts a review of the RL literature to determine the role played by government. Next, an RL model using data from the electronics industry in the Dallas, Texas, region is utilized to examine how public works management and policy can affect RL operations. Implications for local and state government public works agencies to assist businesses with RL sustainability efforts are developed. Keywords reverse logistics, returns processing, landfills, transportation infrastructure
Introduction Reverse logistics (RL) is an important part of the supply chain process that plans, implements, and controls the efficient, effective flow and storage of returned goods. It deals with the handling of damaged, unsold, or returned goods for the purpose of capturing value efficiently and/or proper disposal to reduce the environmental impact (Ferguson & Browne, 2001). It differs from waste management that focuses on the collection and processing of waste for disposal (de Brito & Dekker, 2003). Having 1
The University of Southern Mississippi, Hattiesburg
Corresponding Author: Chad R. Miller, Assistant Professor, The University of Southern Mississippi, Department of Economic & Workforce Development, 118 College Drive, #5022 Hattiesburg, MS 39406 Email:
[email protected]
69
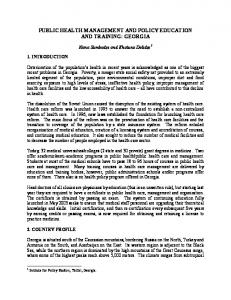
Re-distribute Re-use Re-sell
Direct Recovery Disposal
Disposition Options of Returned Goods
Reprocessing
Miller and Sarder
• • • • •
Repair Refurbish Remanufacture Retrieve Recycle
• Return to subcontractors • Return to vendors • Donate to charity
• • • • •
Sell as new thru same channel Sell thru internet Sell with discounted price Sell thru bidding in auction Sell in the secondary market
• Use within the same unit • Use within the organization • Use as spare parts
• • • •
Traditional landfill Scrap Incinerate Green disposal
Figure 1. Disposition options for returned products Source: Modified from Santhanam, 2006.
efficient and reliable transportation is crucial for effective RL, but this “cradle-tocradle” flow of materials, as opposed to the traditionally monodirectional flow, creates new demands on public infrastructure. The increasing adoption of RL programs has the potential to exasperate some existing public works modes and bottlenecks. In some cases, it will require new infrastructure and policies. This research examines the literature and uses a model to begin to examine how public works efforts can improve private sector RL operations. There are numerous disposition options for the returns (see Figure 1), but to make RL sustainable, a lean and green approach must be institutionalized in processing returns (Fleischmann et al., 1997). Lean aspects account for the reclaiming of assets from returned products while keeping recovery costs to a minimum and within the shortest time frame. Thus, RL may be an area where companies can gain a sizeable advantage over their competitors (Adebanjo & Xiao, 2006). Although green aspects
70
Public Works Management & Policy 17(1)
account only for the environmentally proper disposal of returned goods, the public good arising from a combination of lean and green aspects leads to government involvement with the adoption of lean and green logistics. Supporting RL efforts by businesses can be an important component of community sustainability efforts as it encourages companies to recycle and reduce pollution. For example Exxon Mobil Oil Company has an RL system for used motor oil, which is important for the environment because just 1 gallon of used oil can contaminate 1 million gallons of water. The District of Columbia currently recycles 18.3% of the waste collected through the Department of Public Works’ residential collection program. It costs the district about US$25 to haul and dispose of 1 ton of recyclable materials and US$60 per ton of nonrecyclable trash (District of Columbia, 2011). If companies are responsible for their share of disposal through efficient RL operations, it is estimated that the district could be able to save 10% or more of its disposal costs. Apple has instituted an RL program in cities and college campuses in 95% of the countries where their products are sold, diverting more than 130.2 million pounds of equipment from landfills since 1994. In addition to being good for business, RL has a direct connection to local sustainability efforts. Most of the RL-related policy research focus has been on environmental policy and RL, but there are less studied implications for public infrastructure management and policy. First, RL is expected to increase the movement of freight by 10%, and this will affect already congested transportation networks (Tibben-Lembke & Rogers, 2002). This means that transportation planners need to factor the increased and changed freight flows into their long-range transportation plans. Second, the new spatial requirements of industries embracing RL can affect public infrastructure. For example, hub-andspoke remanufacturing centers create significant truck traffic often involving hazardous materials. Third, existing hazardous waste regulations are not consistent from state to state; therefore, transporting demanufactured materials across state lines is a complex process, and, in turn, there needs to be an evaluation of hazardous waste movement policies. Fourth, there needs to be more coordination with the waste management community and the location of facilities such as landfills. Finally, there are Intelligent Transportation Systems (ITS) implications because technologies such as radio frequency identification (RFID) and automated tracking, and so on will improve RL operations. RL is an aspect of sustainability that needs to be better understood by the public works management and policy community to help businesses be lean and green. This article begins the exploration of the relationship between RL and public works management and policy by examining the public works–related needs of business.
Importance of Sustainable Reverse Logistics According to the Reverse Logistics Executive Council (RLEC, 2011), the average annual cost of handling, transportation, and processing of returned products in the United States is between 0.5% and 1% of the total U.S. GDP (gross domestic product; Santhanum, 2006). This estimate excludes disposition management, administration
Miller and Sarder
71
time, and the cost of converting unproductive returns into productive assets. The overall amount of RL activities in the economy is growing, driven by a number of factors, including online sales (Álvarez-Gil, Berrone, Husillos, & Lado, 2007; Pokharel & Mutha, 2009). The increasing volume of product returns necessitates the lean management of the RL. Typically returns happen because something is wrong somewhere in the long supply chain pipeline. It is also to be noted that returns also happen even if all the businesses processes are perfect. The focus of much recent research is how to tap the former and analyze the reasons for returns from various supply chain actors’ point of view. After zeroing on the return reason for each actor, companies strive to use this feedback information for future purposes so that the number of returns is minimized and profits are improved. Thus, by improving a region’s ability to conduct efficient RCS operations, public works agencies can support economic development.
The Drivers of Reverse Logistics The adoption of RL by organizations is primarily driven by four factors: economics, corporate citizenship, customer service initiative, and legislation (de Brito & Dekker, 2003). Whereas legislation and customer service initiatives represent the conventional operational drivers of RL, corporate citizenship and economic benefits have major bottom-line benefits and can transform returns management into a strategic asset. The following sections describe the details of the four factors driving the adoption of RL by companies.
Economics Profitability is seen as a driving force to RL relating to all the recovery options, where the company receives both direct and indirect economic benefits. It is seen that companies continually strive for achieving cost savings in their business operations. The economic drivers of RL lead to direct gains in input materials, cost reduction, value added recovery, and also in indirect gains by impeding legislation, market protection by companies, green image for companies, and for improvement in customer–supplier relationships. RL is now perceived by organizations as an “investment recovery” as opposed to simply minimizing the cost of waste management (Saccomano, 1997).
Corporate Citizenship Another driver for the RL is good corporate citizenship, which concerns a set of values or principles that impels a company or an organization to become responsibly engaged with RL activities. RL activities can lead to improved corporate image (Carter & Ellram, 1998). Nike, the shoe manufacturer, encourages consumers to bring their used shoes to the store where they had purchased them. The retailers ship the old shoes back to Nike plants where they are shredded and made into basketball courts
72
Public Works Management & Policy 17(1)
and running tracks. Nike also donates the material to the basketball courts and donates funds for building and maintaining these courts, thus enhancing the value of its brand (Rogers & Tibben-Lembke, 1998).
Customer Service Initiatives The voice of the customer is a crucial driver of RL supply chains. Effectively handling returns has led to competitive advantage for companies that proactively incorporate environmental goals into their business practices and strategic plans to gain customer loyalty. Environmental management has gained increasing interest in the field of supply chain management. Murphy, Poist, and Braunschweig (1995) found that 60% in a group of 133 managers surveyed considered the issue of the environment to be a very important factor and 82% of them expected that the importance would increase in the years to come. A “green” image of producing environmentally friendly products has become an important marketing element, which has stimulated numerous companies to explore options for take-back and recovery of their products (Thierry, 1997).
Government Legislation refers to any jurisdiction making it mandatory for the companies to recover its products or accept these back after the end of life of the product. Environmental regulations that drive RL are being enacted around the world. For example in the United States, the Resource Conservation and Recovery Act (RCRA) includes rules intended to encourage recycling and reuse of cathode-ray tubes. Other countries have similar regulations, but the leader in developing regulations that encourage RL is the European Union (EU). Examples of EU regulation include the End of Life Vehicles Directive, the Waste Electrical and Electronic Equipment Directive (WEEE), the Packaging and Packaging Waste Directive, and the Restriction of Hazardous Substances Directive (RoHS). There has been extensive research on the effectiveness of these policies and their impact on business (see Georgiadis & Vlachos, 2003; Gerrard & Kandlikar, 2007; González-Torre, Adenso-Díaz, & Artiba, 2004; Walther & Spengler, 2005), but little research has been conducted on the relationship between RL and public works management and policy. Legislation is just one of five types of government involvement that encourage RL. The RL motivators are as follows: (1) information dissemination and use mechanisms, (2) economic “sticks,” (3) producer responsibility, (4) economic “carrots,” and (5) legislative “sticks” (Wilson, 1996). Information programs include education programs, technical assistance, and coordinated publicity. Examples of this approach in the United States are Manufacturing Extension Partnership (MEP) lean-manufacturing assistance programs. Economic “sticks” include deposit-refund systems and taxes on raw materials, waste disposal, or nonrecyclable goods. The “producer” of goods that create waste can be expected to pay for waste and disposal rather than society. There can be economic “carrots” such as waste prevention programs, research and
Miller and Sarder
73
development, central treatment facilities, or development of the demand for recycled materials. Finally, there can be legislative “sticks” such as restrictions on landfills, licensing, mandatory recycling, or environmental regulations. These incentives for RL are not typically the purview of public works agencies, so the trend has garnered little attention in the public works management and policy literature.
Reverse Logistics Literature Despite the lack of attention in the transportation policy literature, there has been a considerable research conducted on RL in the supply chain and industrial engineering literature. This literature typically involves theory building, cases, or quantitative modeling (de Brito & Dekker 2003). Some implications for public works management and policy can be inferred from this literature, but direct policy and public administration recommendations are limited. The focus of physical distribution and RL research has been on business operations rather than the public policy implications. Theory building in the current RL literature generally examines the factors that lead to adoption and successful implementation of RL systems. Drawing on stakeholder theory formulations, organizational slack, and the manager’s strategic stance concept, Álvarez-Gil et al. (2007) developed a model on the probability of firms implementing RL systems. Dowlatshahi (2000) identified strategic factors (i.e., costs, overall quality, customer service, environmental considerations, and legislation) and operational factors (i.e., cost–benefit analysis, transportation, warehousing, supply management, remanufacturing and recycling, and packaging) that are important for success in RL. A study by Kumar and Putnam (2008) found that identifying markets for recycled and remanufactured products, creating efficient end-of-life reuse/recycling practices, and supply chain coordination were important success factors. Other than enacting legislation that drive RL, the role of government was not considered in these theories of RL success factors. Despite an extensive body of RL case studies covering a range of industries and countries, only indirect insights are provided for public works policy and management from the RL case studies. De Brito, Dekker, and Flapper (2005) conducted a content analysis of more than 60 case studies and determined most deal with structure of networks, the relationships between parties in the networks, planning, inventory management, and the utilization of information technology. Indirectly, public infrastructure is discussed in several case studies. For example, Barros, Dekker, and Scholten (1998) discuss the infrastructure-related problems of transporting heavy sand for recycling. Langer, Forman, Kekre, and Scheller-Wolf (2007) concluded that RFID was a key factor that contributed to the positive results at a return center. How public works could be improved to facilitate RL has not been a focus of the case studies, but inferences such as ITS for more efficient RL operations can be made. Mathematical models are a common approach for RL problem formulation, solutions, and analysis; however, most of the RL models buffer the operations from the external influences over which public works departments have agency (Srivastava,
74
Public Works Management & Policy 17(1)
2007). Nonetheless, there are implications for policy that can be inferred from some of the models. Transportation costs and time, which policy can influence, is a common variable. Tan and Kumar’s (2006) model of disposition activity considers local transportation and long-distance freight costs, which can be improved through improved infrastructure. Barker and Zabinsky (2011) developed an RL model to compare the cost for different sites of disposal. Transportation infrastructure and policy is not implicitly studied in these models, but the impact of policies could be incorporated into some models. Waste disposal is another public works area considered in some RL models. Hu, Sheu, and Huang (2002) found that government regulation of hazardous waste movement was a constraint and concluded that RL costs of hazardous waste treatment systems can be reduced by more than 49% by carefully relaxing the constraints for the minimal collection and treatment requirements. Matthews et. al. (Matthews, McMichael, Hendrickson, & Hart, 1997) developed a model for end-of-life personal computers disposition and considered landfill capacity. Zhang, Huang, and He (2011) developed a solid-waste management model where they analyzed two scenarios with different cost parameters for landfill. Their model reflects the dynamic and uncertain characteristics of waste management systems and could facilitate the generation of desired management plans. Despite a lack of attention to public works policy in the supply chain and industrial engineering literature on RL, there are some implications that can be examined. Transportation time and cost is a major factor in successful implementation of reverse supply chain (RSC) operations. The trucks and other vehicles handling the returns utilize public highways and are subject to tolls and taxes. The conditions of the infrastructure and government charges affect the transportation time and cost calculations. Furthermore, many waste disposal facilities are publically owned, so their locations, rules, and charges are factors over which government has agency. Thus, even though government policy is not a focus of the RL literature, it is a factor that can be examined using methods that build on the existing approaches.
Modeling Public Policy and Management Impact on Reverse Logistics To better understand how public works management and policy can affect the effectiveness of RL operations, a previously tested and calibrated quantitative RL model was employed using the government agency parameters identified in the literature review (see Table 1). Changes in transportation policy and infrastructure can affect RL parameters in both positive and negative ways, so the model was adjusted accordingly. The RL model is designed to quantify the cost of RL and recovery time for companies who are in the RL business. It helps companies to minimize their returnprocessing costs and time to recover values. This model can be used to run different scenarios and identify the change in cost and time. Even though the model is very generic, it can be customized to fit individual companies. It is capable of assessing the
75
Miller and Sarder Table 1. Model Parameters Adjusted for Policy Change
Impact on reverse logistics (RL) businesses
Examples of change in transportation policy and/or infrastructure
RL parameters affected by changes
Add capacity to regional highways and arterials that currently operate at low levels of service, are costly to maintain, and which will contribute to future regional economic growth upon improvement Improve the highway and arterial system with geometric and operational adjustments Focus on transportation investments in cities that are within and along the main corridor Develop a network of transit hubs and dedicated multioccupant travel ways to support faster movement of goods Support federal, state, and local research to better understand the relationships between transportation, logistics, and economic development Work with government and nongovernment organizations to develop and implement free trade zones, centralized return centers, green disposal sites, and so on. Implement coordinated multistate hazardous waste movement policies Increase the public’s demand for greater security at airports, water ports, and so on Support policies that reduce environmental pollution (including greenhouse gas emissions) by encouraging and imposing green disposals and take back responsibilities Consider incentives for companies that reduce environmental impact of disposals, gas emissions, and energy consumption by processing their returns in a lean and green way Impose Hours of Service regulations, such as “Cannot exceed 11 hours of driving without a 10 consecutive hour break” Coordinate with the waste management community to select the appropriate locations and uses of landfill sites In appropriate locations, implement emerging intelligent transportation system (ITS) technology to support appropriate transportation facility
Congestions, capacity, valuerecovery time
Positive
Congestions, capacity
Positive
Congestions, capacity, valuerecovery time
Positive
Efficiency, processing cost
Positive
RL awareness
None
Efficiency, processing cost
Positive
Value-recovery time, processing cost Value-recovery time, processing cost Processing cost
Mixed
Processing cost
Positive
Value-recovery time
Negative
Cost of disposal
Mixed
Coordination, valuerecovery time
Positive
Negative Negative
76
Public Works Management & Policy 17(1)
impact of various transportation parameters such as congestion, capacity, efficiency, location, cost of landfill use, and so on, on the value-recovery time and total RL costs. Public works stakeholders can use the model to run sensitivity analysis to changes in policies and infrastructures. The results of those analyses allow transportation policy makers to understand the impact of their directives on the costs of businesses conducting RSC operations. The Sarder, Miller, and Sulbaran (2010) RL model was developed based on the Reverse Supply Chain (RSC) model (Santhanum, 2006) and using optimization techniques. The RL model is a multiobjectives mathematical model that minimizes total cost of RL operations, and at the same time, it also minimizes total value-recovery time in the return process. The RL model includes both lean (time and value improvement) and green (environmental) component of RL. The lean component is a mathematical formulation that will quantify the improvement of time and value recovery in the RL activities. The green component of the model is a methodological formulation that will devise the strategy of reducing the impact of the disposal process. The green model explores all disposition options and minimizes the amount of disposals. The RL model was applied to two companies in the Dallas area who are in the RL business and handle electronic goods. The model was verified with simulated data and validated with real-time company data. The electronic industry was selected because the industry is one of the leaders in the RL arena. There are three reasons that RL is so important to this industry: (1) the volume of returned products it handles, (2) short product life due to brisk technological obsolescence, and (3) the environmental impact of electronic product waste. According to Santhanam (2006), electronics products experience the highest rate of returns (10%-12%) after the publishing industry (20%30%). Therefore, it makes a useful case study to examine the impact of improved RL public works management and policy.
Modeling Data The model was applied to companies with validated baseline data. Company A is a leading distributor of information technology products with more than 90,000 customers in more than 100 countries. Its core business is global logistics management of electronic products with more than 20 fulfillment centers around the world. It has an established US$1.2 million RL operations with a centralized return-processing center to process its returns and disposals. Company B has been one of the world’s top ten semiconductor suppliers since 1999. It has about 50,000 employees, 16 advanced research and development units, 39 design and application centers, 16 main manufacturing sites, and 78 sales offices in 36 countries. This company has RL operations without a centralized return-processing center, and its total RL costs were found to be US$954,000. The model was customized to fit these companies’ RL operations and then was run for various changes in model parameters to determine the impact on RL cost and RL processing time. For instance, the RL model was run with the change in landfill
77
Miller and Sarder Table 2. RL Cost and Time Comparison with Changes in Policy
Impact on parameters due to change in policy and infrastructure
Change in cost of reverse logistics (in %)
Change in value-recovery time (in %)
Company A
Company B
Company A
Company B
Relocation of landfill site Cost of landfill use raised by 10% Added highway capacity that reduced congestions by 10% Imposed 100% green disposals Imposed service hours regulations that reduced driving time 1 hr/day
−3.5 0.9
2.0 0.5
0 0
0 0
−2.3
−1.0
−4.0
−4.5
15
8
0
0
0
0
−0.35
−0.6
Added centralized returnprocessing center for companies to use
0
11
0
−17
Note: “–” change means cost or time went down and vice versa.
relocation that was close to Company A but distant from Company B. The overall RL cost went down for Company A by 3.5%; on the other hand, the same cost went up for Company B by 2%. The RL model was also run for other scenarios such as 10% increase in landfill cost, reduction in congestions by 10%,1 100% enforcement of green disposals, driving restrictions, and adding of a centralized return center. A synopsis of the analysis is shown in the following Table 2. This analysis shows that the RL model could be useful for local and state officials to work with the business community to meet the needs for better management of returned products. The application of the model shows that public policy can have significant impacts on business costs. Depending on the policy change, the additional costs for the companies could be hundreds of thousands of dollars. It is interesting to note that policy changes do not affect all companies in the jurisdiction evenly and that there are various aspects of the RSC that can be influenced. The model can provide data to facilitate tough public works governance decisions that benefit some at the expense of others.
Discussion and Conclusion The findings from the literature review and the model show that there are a number of ways that the public works community can support sustainability efforts through improvements
78
Public Works Management & Policy 17(1)
in infrastructure and better coordination across governmental agencies. Each of the following implications of RL require further research to better understand best practices.
Increased Movement of Freight Rodrigue, Slack, and Comtois (2009) note that one of the paradoxes of green logistics is that the costs are often externalized and that this is also the case with RL as it requires intensive use of the transportation system. Instead of disposing returns in one place (e.g., a landfill), goods are disaggregated and transported to multiple locations. Recycling and disposal centers will see increased usage of the transportation networks serving these locations. This can create challenges for transportation planners. For example, Hattiesburg, Mississippi, has a metal-recycling facility in the downtown area that creates challenges for the Metropolitan Planning Organization trying to find routes for the trucks hauling scrap that do not conflict with commuters and the efforts for new urbanism in the downtown. Understanding the implications of RL can help transportation planners make better decisions on freight routing.
Spatial Requirements of Industries Embracing Reverse Logistics The model showed that where the various disposition facilities are located has a major impact on RSC efficiencies. Companies have begun to layout their dispersed facilities to match these requirements. One result has been industrial parks specializing in RL-type operations such as remanufacturing. For example, the McAllen Development Corporation (in McAllen, Texas, and Reynosa, Mexico) has positioned itself as a green-remanufacturing center (McAllen Economic Development Corporation, 2011). It has developed its own transportation network to match the distribution needed for such operations as warranty repair. The automotive industry is also embracing RL, so auto supplier parks are requiring the transportation systems to meet the needs of RSC. The desire to maintain and attract economic development will drive transportation planners to supply the infrastructure needed for RL.
Hazardous Waste Regulations Hazardous waste generation is an important factor with RL, and the ability to safely, legally, and cost-effectively transport hazardous waste is a major consideration. Having different jurisdictional rules on the transportation of hazardous waste further complicates issues. Environmental regulators, transportation planners, and RSC officials need to come together to ensure that hazardous waste can be moved safely and effectively across political jurisdictions.
Landfill Locations Despite efforts to extract as much value from returns and recycle as is possible, there will be a certain amount of waste from most systems. For example, the U.S. carpet
Miller and Sarder
79
industry is establishing an RL system to divert 40% of its waste from landfills by 2012, but that still leaves a huge amount of carpet waste going to landfills (Biehl, Prater, & Realff, 2007). Thus, the location of landfills is a factor in the design of RSC systems as highlighted in the model. Linton et al. (Linton, Yeomans, & Yoogalingam, 2002) found that the range and quantity of waste will require an alternative infrastructure as it is displaced from municipal landfills. This means that transportation planners and administrators involved with waste-facility locations need to understand the needs of RL for effective landfill locations.
Intelligent Transportation Systems (ITS) Information systems and information technology plays an important role in the support of the RL process (Dhanda & Hill, 2005). Successful implementation of ITS can improve tracking of returned goods and visibility of returns tracking. It can aid gatekeeping operations, storage, and transportation of returns by providing the locations in real time. It can also help the transportation authority to provide the location of hazardous material en route to a disposal site. The trend of RL is likely to have an incremental impact on the public works infrastructure of certain areas. For example, an area with a high concentration of the electronics industry is likely to experience some transportation complications as RL programs are geared up. RL also has an impact on a firm’s bottom line, so areas where public works administrators and economic developers can come together to improve infrastructure and policy for RSC processes can make their region more attractive to targeted industries. In conclusion, RL is not going to radically change public works management and policy, but it is an aspect of sustainable transportation that deserves more attention. Declaration of Conflicting Interests The author(s) declared no potential conflicts of interest with respect to the research, authorship, and/or publication of this article.
Funding The author(s) received no financial support for the research, authorship, and/or publication of this article.
Note 1. The percentage decrease in congestion resulting from policy changes was based on a Federal Highway Administration freight study (ICF Consulting, 2004).
References Adebanjo, D., & Xiao, P. (2006, 21-23 June). Managing reverse logistics in the Chinese automobile industry. Paper presented at the Management of Innovation and Technology, 2006 IEEE International Conference, Singapore.
80
Public Works Management & Policy 17(1)
Álvarez-Gil, M. J., Berrone, P., Husillos, F. J., & Lado, N. (2007). Reverse logistics, stakeholders’ influence, organizational slack, and managers’ posture. Journal of Business Research, 60(5), 463-473. Barker, T. J., & Zabinsky, Z. B. (2011). A multicriteria decision making model for reverse logistics using analytical hierarchy process. Omega, 39(5), 558-573. Barros, A. I., Dekker, R., & Scholten, V. (1998). A two-level network for recycling sand: A case study. European Journal of Operational Research, 110(2), 199-214. Biehl, M., Prater, E., & Realff, M. J. (2007). Assessing performance and uncertainty in developing carpet reverse logistics systems. Computers & Operations Research, 34(2), 443-463. Carter, C. R., & Ellram, L. M. (1998). Reverse logistics: A review of the literature and framework for future investigation. Journal of Business Logistics, 19(1), 85-102. de Brito, M. P., & Dekker, R. (2003). A framework for reverse logistics. Rotterdam, NL: Erasmus University. de Brito, M. P., Dekker, R., & Flapper, S. D. P. (2005). Reverse logistics: A review of case studies. In B. Fleischmann & A. Klose (Eds.), Distribution logistics: Advanced solutions to practical problems (pp. 243-251). New York, NY/Berlin, Germany: Springer-Verlag. Dhanda, K., & Hill, R. (2005). The role of information technology and systems in reverse logistics: A case study. International Journal of Technology Management, 31(1/2), 140-151. District of Columbia. (2011). Recycling, waste and hazards. Retrieved August 11, 2011, from http://rrc.dc.gov/green/cwp/view,A,1231,Q,460729.asp Ferguson, N., & Browne, J. (2001). Issues in end-of-life product recovery and reverse logistics. Production Planning and Control, 12(5), 534-547. Fleischmann, M., Bloemhof-Ruwaard, J. M., Dekker, R., van der Laan, E., van Nunen, J. A. E. E., & Van Wassenhove, L. N. (1997). Quantitative models for reverse logistics: A review. European Journal of Operational Research, 103(1), 1-17. Georgiadis, P., & Vlachos, D. (2003). Analysis of the dynamic impact of environmental policies on reverse logistics. Operational Research, 3(2), 123-135. Gerrard, J., & Kandlikar, M. (2007). Is European end-of-life vehicle legislation living up to expectations? Journal of Cleaner Production, 15(1), 17-27. González-Torre, P. L., Adenso-Díaz, B., & Artiba, H. (2004). Environmental and reverse logistics policies in European bottling and packaging firms. International Journal of Production Economics, 88(1), 95-104. Hu, T.-L., Sheu, J.-B., & Huang, K.-H. (2002). A reverse logistics cost minimization model for the treatment of hazardous wastes. Transportation Research. Part E: Logistics and Transportation Review, 38(6), 457-473. ICF Consulting. (2004). FHWA freight BCA study: Summary of phase II results. Washington, DC: U.S. Department of Transportation Federal Highway Administration. Kumar, S., & Putnam, V. (2008). Cradle to cradle: Reverse logistics strategies and opportunities across three industry sectors. International Journal of Production Economics, 115(2), 305-315. Langer, N., Forman, C., Kekre, S., & Scheller-Wolf, A. (2007). Assessing the impact of RFID on return center logistics. Interfaces, 37(6), 501-514.
Miller and Sarder
81
Linton, J. D., Yeomans, J. S., & Yoogalingam, R. (2002). Supply planning for industrial ecology and remanufacturing under uncertainty: A numerical study of leaded-waste recovery from television disposal. The Journal of the Operational Research Society, 53(11), 1185-1196. Matthews, S., McMichael, F., Hendrickson, C. T., & Hart, D. (1997). Disposition and end-of-life options for personal computers. Pittsburgh, PA: Carnegie Mellon University. McAllen Economic Development Corporation. (2011). Manufacturing is green. Retrieved March 22, 2011, from http://www.mcallenedc.org/ Murphy, P., Poist, R., & Braunschweig, C. (1995). Role and relevance of logistics to corporate environmentalism: An empirical assessment. International Journal of Physical Distribution & Logistics Management, 25(2), 5-19. Pokharel, S., & Mutha, A. (2009). Perspectives in reverse logistics: A review. Resources, Conservation and Recycling, 53(4), 175-182. Reverse Logistics Executive Council. (2011). Glossary. Retrieved March 22, 2011, from http:// www.rlec.org/glossary.html Rodrigue, J.-P., Slack, B., & Comtois, C. (2009). Transportation, energy and environment. In J.-P. Rodrigue, B. Slack, & C. Comtois (Eds.), The geography of transport systems (2nd ed., pp.261-287). New York, NY: Routledge. Rogers, D., & Tibben-Lembke, R. (1998). Going backwards: Reverse logistics trends and practices. Reno: University of Nevada, Reno Center for Logistics Management. Saccomano, A. (1997, February). Many happy returns. Traffic World, p. 22. Santhanam, R. (2006). Methodology for reverse supply chain design in consumer electronics industry. Unpublished dissertation, University of Texas at Arlington, Arlington. Sarder, M., Miller, C., & Sulbaran, T. (2010, June 5-9). Lean & green approach to value recovery from returned goods. Paper presented at the Proceeding of the Annual Industrial Engineering Research Conference (IERC), Cancun, Mexico. Srivastava, S. K. (2007). Green supply-chain management: A state-of-the-art literature review. International Journal of Management Reviews, 9(1), 53-80. Tan, A., & Kumar, A. (2006). A decision-making model for reverse logistics in the computer industry. International Journal of Logistics Management, 17(3), 331-354. Thierry, M. C. (1997). An analysis of the impact of product recovery management on manufacturing companies. Unpublished dissertation, Erasmus University, Rotterdam, the Netherlands. Tibben-Lembke, R., & Rogers, D. (2002). Differences between forward and reverse logistics in a retail environment. Supply Chain Management: An International Journal, 7(5), 271-282. Walther, G., & Spengler, T. (2005). Impact of WEEE-directive on reverse logistics in Germany. International Journal of Physical Distribution & Logistics Management, 35(5), 337-361. Wilson, D. C. (1996). Stick or carrot? The use of policy measures to move waste management up the hierarchy. Waste Management & Research, 14(4), 385-398. Zhang, Y., Huang, G., & He, L. (2011). An inexact reverse logistics model for municipal solid waste management systems. Journal of Environmental Management, 92(3), 522-530.
82
Public Works Management & Policy 17(1)
Bios Chad R. Miller, PhD, is an assistant professor in the University of Southern Mississippi (USM) Department of Economic and Workforce Development and is an assistant director of the USM Center for Logistics, Trade, and Transportation. M.D. Sarder, PhD, is an assistant professor in the University of Southern Mississippi (USM) Industrial Engineering & Technology program and is an assistant director of the USM Center for Logistics, Trade, and Transportation.