polymers Article
Polyetheretherketone Hybrid Composites with Bioactive Nanohydroxyapatite and Multiwalled Carbon Nanotube Fillers Chen Liu 1 , Kai Wang Chan 1 , Jie Shen 2 , Cheng Zhu Liao 3 , Kelvin Wai Kwok Yeung 2 and Sie Chin Tjong 1, * 1 2 3
*
Department of Physics and Materials Science, City University of Hong Kong, Tat Chee Avenue, Kowloon, Hong Kong, China;
[email protected] (C.L.);
[email protected] (K.W.C.) Department of Orthopedics and Traumatology, Li Ka Shing Faculty of Medicine, The University of Hong Kong, Hong Kong, China;
[email protected] (J.S.);
[email protected] (K.W.K.Y.) Department of Materials Science and Engineering, South University of Science and Technology of China, Shenzhen 518055, China;
[email protected] Correspondence:
[email protected]; Tel.: +86-852-3442-7702
Academic Editor: Patrick van Rijn Received: 25 October 2016; Accepted: 2 December 2016; Published: 8 December 2016
Abstract: Polyetheretherketone (PEEK) hybrid composites reinforced with inorganic nanohydroxyapatite (nHA) and multiwalled carbon nanotube (MWNT) were prepared by melt-compounding and injection molding processes. The additions of nHA and MWNT to PEEK were aimed to increase its elastic modulus, tensile strength, and biocompatibility, rendering the hybrids suitable for load-bearing implant applications. The structural behavior, mechanical property, wettability, osteoblastic cell adhesion, proliferation, differentiation, and mineralization of the PEEK/nHA-MWNT hybrids were studied. X-ray diffraction and SEM observation showed that both nHA and MWNT fillers are incorporated into the polymer matrix of PEEK-based hybrids. Tensile tests indicated that the elastic modulus of PEEK can be increased from 3.87 to 7.13 GPa by adding 15 vol % nHA and 1.88 vol % MWNT fillers. The tensile strength and elongation at break of the PEEK/(15% nHA)-(1.88% MWNT) hybrid were 64.48 MPa and 1.74%, respectively. Thus the tensile properties of this hybrid were superior to those of human cortical bones. Water contact angle measurements revealed that the PEEK/(15% nHA)-(1.88% MWNT) hybrid is hydrophilic due to the presence of nHA. Accordingly, hydrophilic PEEK/(15% nHA)-(1.88% MWNT) hybrid promoted the adhesion, proliferation, differentiation, and mineralization of murine MC3T3-E1 osteoblasts on its surface effectively on the basis of cell culture, fluorescence microscopy, MTT assay, WST-1 assay, alkaline phosphatase activity, and Alizarin red staining tests. Thus the PEEK/(15% nHA)-(1.88% MWNT) hybrid has the potential to be used for fabricating load-bearing bone implants. Keywords: polyetheretherketone; nanohydroxyapatite; multiwalled carbon nanotube; hybrid nanocomposites; hydrophilic surface; osteoblasts; biocompatibility
1. Introduction Nowadays, there is a substantial increase in the demand of bone implants due to an increase in the numbers of patients suffering from traffic injury, aging, and bone disease [1]. The technological development of biomaterials with excellent biocompatibility for bone replacements is considered of critical importance. Metallic implants such as titanium alloy, CoCrMo alloy, and 316L stainless steel have been widely used for fabricating load-bearing hip implants and bone fixation devices due to their superior mechanical strength and ductility. However, metallic implants suffer from corrosion due to the release of metal ions by interacting with body fluid containing 0.9% NaCl. Some ions (e.g., Ni2+ , Polymers 2016, 8, 425; doi:10.3390/polym8120425
www.mdpi.com/journal/polymers
Polymers 2016, 8, 425
2 of 19
Cr3+ and Co2+ ) can induce allergy, inflammation and cytotoxicity [2–4]. In addition, chloride anions can attack passive films formed on metallic surfaces, leading to crevice and pitting corrosion [5,6]. Metallic implants also experience a stress shielding effect due to a mismatch in stiffness between the implants and host bone, resulting in a loss of bone density. In this respect, ceramics and polymers have been investigated as possible bone substitute materials. In particular, hydroxyapatite [Ca10 (PO4 )6 (OH)2 ] is of particular interest due to its resemblance to the mineral component of human bones. However, hydroxyapatite (HA) cannot be used for load-bearing implants due to its brittle nature. Thus inorganic HA in the form of particulates with sizes of several micrometers (mHA) are employed as reinforcing fillers for high-density polyethylene (HDPE) [7]. The inclusion of bioactive mHA fillers (40 vol %) renders HDPE with excellent bioactivity and biocompatibility. Polymers with good processability and light weight exhibit beneficial effects for biomedical applications [8,9]. Degradable polymers with low mechanical strength such as polylactic acid, polyglycolic acid, and their blends are typically used for bone tissue engineering applications [10,11]. By contrast, non-degradable polymer such as polyetheretherketone (PEEK) with high temperature durability, excellent radiation stability and high Young’s modulus has found clinical applications as trauma fixation devices and spinal cages [12,13]. However, PEEK is bio-inert and hydrophobic, and cannot osteo-integrate with adjacent bone tissues upon implantation [14]. The bioactivity of PEEK can be greatly enhanced either by depositing HA coating on its surface [15], or by incorporating inorganic HA whiskers [16] and mHA particulates into its matrix [17]. In the latter case, Abu Bakar et al. added large mHA particulates up to 40 vol % into PEEK through melt compounding and injection-molding. They found that the tensile modulus of PEEK/mHA composites rises with increasing mHA content. However, the tensile strength of the composites decreases markedly as the mHA content increases. This implies that the tensile strength of PEEK/mHA composites is lower than that of pure PEEK. This is due to poor interfacial bonding between the fillers and PEEK. Further, large mHA particulates often serve as stress concentrators, thereby fracturing into small fragments during tensile testing. Recent progress in nanotechnology research has led to the development and synthesis of novel nanomaterials with unique properties. Nanomaterials generally possess higher mechanical strength and biocompatibility compared to their micron-sized counterparts. Nanohydroxyapatite (nHA) can be synthesized by solid state reaction, co-precipitation, hydrothermal method, sol-gel process, etc. [18]. Synthetic nHA enhances protein adsorption, thereby promoting osteoblast adhesion, proliferation, and differentiation [19]. Bone tissue is a biocomposite consisting of a collagen matrix and nHA. Human cortical bone possesses an elastic modulus in the range of 7–30 GPa, tensile strength of 50–150 MPa and fracture elongation of 1%–3% [20]. Therefore, polymer/nHA composites have been investigated for making load-bearing hip prostheses and bone tissue scaffolds [21–26]. The additions of nHA to polypropylene (PP) of low tensile stiffness and strength improve its tensile performance moderately. The elastic modulus of PP/nHA nanocomposites is still much lower than that of cortical bone [21]. In this respect, PEEK with higher tensile stiffness and strength than PP is a potential matrix material of biocomposites for forming load-bearing bone implants. Ma et al. prepared PEEK/nHA nanocomposites through vibrating ball-mill mixing followed by injection molding [27]. They found that that the elastic modulus of PEEK reaches a maximum value of 4.6 GPa by adding 40 wt % (21.5 vol %) nHA. However, the modulus of this nanocomposite is much smaller than the lower limit for the modulus of cortical bone, i.e., 7 GPa. Very recently, we incorporated 4.4–21.5 vol % nHA rods to PEEK for enhancing its mechanical stiffness and biocompatibility [23]. The results showed that the tensile modulus of PEEK-based composites increases with increasing nHA content. It increases from 3.86 GPa (pure PEEK) to a maximum value of 7.85 GPa by adding 21.5 vol % (40 wt %) nHA. The elastic modulus of PEEK/(21.5 vol % nHA) nanocomposite reaches 7.85 GPa, being slightly higher than the lower bound in elastic modulus of cortical bone. However, PEEK/(21.5 vol % nHA) nanocomposite is very brittle having a fracture elongation of only 0.63%. These results reveal that the PEEK/(21.5 vol % nHA) nanocomposite is unsuitable for making load-bearing implants due to its brittleness. To address this issue, carbon
Polymers 2016, 8, 425
3 of 19
nanofibers (CNFs) of 1.6–1.9 vol % are added to the PEEK/nHA composites for enhancing their stiffness. PEEK/(15 vol % nHA)-(1.9 vol % CNF) biocomposite achieves a maximum elastic PolymersSo 2016, 8, 425 3 of 18 modulus of 6.54 GPa, being smaller than that of cortical bone. CNF) biocomposite achieves a maximum elasticextraordinary modulus of 6.54 GPa,tensile being smaller than thatstrength. of As recognized, carbon nanotubes possess high modulus and cortical bone. Multiwalled carbon nanotubes (MWNTs) possess an elastic modulus of 0.9 TPa and tensile strength of As recognized, carbon nanotubes possess extraordinary high tensile modulus and strength. 150 GPa [28]. Thus MWNTs are effective nanofillers for biocomposites as they promote the adhesion Multiwalled carbon nanotubes (MWNTs) possess an elastic modulus of 0.9 TPa and tensile strength of and proliferation of osteoblasts on their surfaces [29,30]. By incorporating into polymers, MWNTs 150 GPa [28]. Thus MWNTs are effective nanofillers for biocomposites as they promote the adhesion enhance mechanical property on and biocompatibility composites. ThusMWNTs hybridizing and the proliferation of osteoblasts their surfaces [29,30]. of Byresulting incorporating into polymers, inorganic nHA with MWNTs can effectively generate PEEK-based nanocomposites with good tensile enhance the mechanical property and biocompatibility of resulting composites. Thus hybridizing stiffness and strength as well as excellent biocompatibility for biomedical load-bearing applications. inorganic nHA with MWNTs can effectively generate PEEK-based nanocomposites with good tensile stiffness and strength as well as excellent biocompatibility for biomedical load-bearing applications.
2. Experimental Section
2. Experimental Section
2.1. Materials 2.1. Materials
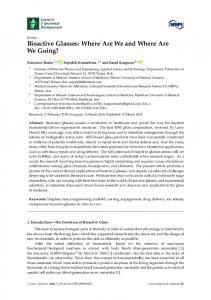
PEEK-Optima (molecular weight 20,800 g/mol) pellets and MWNTs were bought from Invibio (molecular&weight 20,800 g/mol) pelletsInc. and(Los MWNTs wereNM, bought fromrespectively. Invibio CompanyPEEK-Optima and Nanostructured Amorphous Materials Alamos, USA), Company and Nanostructured & Amorphous Materials Inc. (Los Alamos, NM, USA), respectively. Nanohydroxyapatite (nHA) powders were purchased from Nanjing Emperor Nano Materials (Nanjing, Nanohydroxyapatite (nHA) powders were purchased from Nanjing Emperor Nano Materials (Nanjing, China). Transmission electron microscopy (TEM; Philips CM20, Philips, Amsterdam, The Netherlands) China). Transmission electron microscopy (TEM; Philips CM20, Philips, Amsterdam, The micrograph revealed nHA exhibiting a width of 20 nm and a length of 100 nm (Figure 1). PEEK pellets Netherlands) micrograph revealed nHA exhibiting a width of 20 nm and a length of 100 nm (Figure and nHA were driedand in an oven 55 ◦ Cinovernight to melt-compounding. 1). PEEK pellets nHA wereatdried an oven at prior 55 °C overnight prior to melt-compounding.
Figure 1. Transmission electron microscopy (TEM) image of nanohydroxyapatite (nHA).
Figure 1. Transmission electron microscopy (TEM) image of nanohydroxyapatite (nHA).
2.2. Preparation of Nanocomposites
2.2. Preparation of Nanocomposites
PEEK/(15 vol % nHA)-MWNT hybrids with chemical compositions as listed in Table 1 were
fabricated byvol melt-mixing and injection hybrids molding. For comparison, PEEK and binary PEEK/MWNT PEEK/(15 % nHA)-MWNT with chemicalpure compositions as listed in Table 1 nanocomposites were also prepared. The compositions of binary PEEK/MWNT and ternary were fabricated by melt-mixing and injection molding. For comparison, pure PEEK and binary PEEK/(15 vol % nHA)-MWNTwere nanocomposite in thisThe article were expressed in volume percentage. and PEEK/MWNT nanocomposites also prepared. compositions of binary PEEK/MWNT From our previous work [23], elastic modulus and fracture strain of the PEEK/(15 vol nHA) ternary PEEK/(15 vol % nHA)-MWNT nanocomposite in this article were expressed% in volume nanocomposite were 6.2 GPa and 2.71%, respectively. Thus the tensile performance of this composite can percentage. From our previous work [23], elastic modulus and fracture strain of the PEEK/(15 vol % nHA) be further improved by adding MWNTs. Accordingly, the nHA content of hybrid nanocomposites in nanocomposite were 6.2 GPa and 2.71%, respectively. Thus the tensile performance of this composite this study was fixed at 15 vol %. can be further by process, adding MWNTs. Accordingly, the nHA hybrid In theimproved melt-mixing dried PEEK pellets and nHA werecontent initiallyofmixed in nanocomposites an extruder in this study was fixed at 15 vol %. (C.W. Brabender Instruments, South Hackensack, NJ, USA) at a screw rotation speed of 30 rpm for 45 In the melt-mixing process,ofdried PEEK pellets and nHA were initially mixed at in360–380– an extruder min. The mixing temperatures Brabender from hopper to extrusion die were maintained °C, respectively. The extrudates were a pelletizer andspeed loadedofinto (C.W.390–395–380–360 Brabender Instruments, South Hackensack, NJ, granulized USA) at aby screw rotation 30 rpm for temperatures second mixingofunder the same purposedie was to achieve for 45Brabender min. Theagain mixing Brabender fromconditions. hopper toThe extrusion were maintained homogeneous dispersion of ◦nanofillers in the polymer matrix. The extruded productsby were pelletized and at 360–380–390–395–380–360 C, respectively. The extrudates were granulized a pelletizer
Polymers 2016, 8, 425
4 of 19
loaded into Brabender again for second mixing under the same conditions. The purpose was to achieve homogeneous dispersion of nanofillers in the polymer matrix. The extruded products were pelletized again, dried overnight in an oven, and finally fed into an injection molder (Toyo TI-50H, Toyo Machinery & Metal Co., Akashi, Japan) to make dog-bone tensile bars and circular disks. The disks were mainly used for cell culture, cell viability, and alkaline phosphatase activity measurements. Table 1. The compositions of binary PEEK/MWNT and ternary PEEK/(15 vol % nHA)-MWNT nanocomposites.
Sample PEEK PEEK/(0.93% MWNT) PEEK/(1.88% MWNT) PEEK/(15% nHA)-(0.93% MWNT) PEEK/(15% nHA)-(1.88% MWNT)
MWNT
nHA
vol %
wt %
vol %
wt %
0 0.93 1.88 0.93 1.88
0 1.5 3.0 1.5 3.0
0 0 0 15 15
0 0 0 30 30
2.3. Material Characterization X-ray diffraction (XRD) patterns of the composite specimens were obtained using a Bruker D2 Phaser X-ray diffractometer (Karlsruhe, Germany) equipped with Cu-Kα radiation (λ = 0.154 nm) at 30 kV. The patterns were recorded from 10◦ to 60◦ . The morphologies of injection molded composite specimens were examined in a field-emission SEM (Jeol JSM 7100F; Tokyo, Japan). The composites were dipped in liquid nitrogen and then fractured by a hammer. The fractured surfaces were then coated with a thin carbon film. Differential scanning calorimetry (DSC) tests were determined with a TA Instruments model 2910 (TA Instruments, New Castle, DE, USA) under a protective nitrogen atmosphere. The previous thermal history of the specimens was removed by an initial heating cycle of 20 ◦ C/min from ambient to 350 ◦ C, followed by holding for 3 min at this temperature. The specimens were then cooled at a rate of 20 ◦ C/min and the cooling traces were recorded accordingly. 2.4. Tensile Tests Tensile tests were performed at room temperature using an Instron tester (model 5567, Instron Corp., Norwood, MA, USA) at a crosshead speed of 10 mm/min. The elastic modulus of PEEK and its nanocomposites was determined from the linear region of stress-strain curves. Five samples of each composition were tested, and the average values were reported. 2.5. Water Contact Angle Tests Water contact angles of nanocomposite specimens were measured using Rame Hart 500-F1 advanced goniometer equipped with DROP image software (Rame-Hart Instrument Co., Succasunna, NJ, USA). Each test run was performed by producing a water droplet and its subsequent spreading into a spherical cap on the specimen surface. 2.6. Cell Culture Murine MC3T3-E1 pre-osteoblasts were cultured in Dulbecco’s Modified Eagle’s Medium (DMEM, Thermo Scientific, Pittsburgh, PA, USA) supplemented with 10% fetal bovine serum, penicillin, and streptomycin. Injection molded disks were sliced into small round shapes for cell cultivation and proliferation measurements. These samples were ground with SiC papers of different grades, followed by rinsing with 70% ethanol and phosphate buffer saline (PBS) solutions. Rinsed samples were placed in a 96-well plate. Afterwards, a cell suspension was pipetted at 104 cells per well. The 96-well plate was incubated in a humidified atmosphere of 5% CO2 /95% air at 37 ◦ C for desired periods. The culture
Polymers 2016, 8, 425
5 of 19
medium was changed every two days. Following the incubation, the samples were washed with phosphate-buffered saline (PBS) to remove unattached cells, fixed with 10% formaldehyde, dehydrated in a graded series of ethanol. Dehydrated cells were critical point dried and sputter deposited with gold in preparation for SEM examination. Moreover, micrographs of osteoblasts cultured on the samples were taken at day 1 and day 3 using a fluorescence microscope. Cells were washed with PBS and fixed with methanol-free formaldehyde for 30 min at each time point. After that, the samples were washed with PBS and stained with Alexa Fluor 488 (A12379, ThermoFisher Scientific, Carlsbad, CA, USA) at room temperature for 40 min to label F-actin filaments, and stained the nuclei with Hoechst 33342 (Sigma Aldrich, St. Louis, MO, USA) for 5 min. The samples were then washed three times and stored in PBS before imaging. 2.7. Cell Metabolic Activity The cell metabolic activity was determined with 3-(4,5-dimethylthiazol-2-yl)-2,5-diphenyltetrazolium bromide (MTT), and 2-(4-iodophenyl)-3-(4-nitrophenyl)-5-(2,4-disulfophenyl)-2H-tetrazolium (WST-1) assays. Rinsed samples (number of samples, n = 5) were placed in a 96-well plate. A suspension of 104 cells per well was seeded into the 96-well plate. The plate was incubated in a humidified atmosphere of 5% carbon dioxide in air at 37 ◦ C for 3, 7 and 10 days, respectively. The culture medium was refreshed every 3 days. At days 3, 7 or 10, the medium was aspirated, then 10 µL MTT solution (5 mg MTT:1 mL DMEM) was added to each well and incubated for 4 h at 37 ◦ C. Thus MTT reacted with mitochondrial enzyme of viable osteoblasts, producing insoluble formazan crystals. The formazan was dissolved in 10% sodium dodecyl sulfate (SDS)/0.01 M hydrochloric acid. The absorbance of dissolved formazan was measured at a wavelength of 570 nm using a multimode detector (Beckman Coulter DTX 880, Beckman Coulter Inc., Fullerton, CA, USA), with a reference wavelength of 640 nm. Those wells with MTT and DMEM were used as a negative control. For WST-1 assay, the samples (n ≥ 5) were first seeded with osteoblasts at 37 ◦ C for 3, 7 and 10 days, respectively. After cell culturing for every prescribed time period, tetrazolium salt was added to each well followed by incubation for 4 h at 37 ◦ C to produce water soluble formazan. The amount of water-soluble formazan was quantified by the absorbance at 450 nm. The cell metabolic activity of both assays was calculated by comparing the absorbance of osteoblastic cells cultured on the nanocomposite sample to that of the cells seeded on pure PEEK. The results were expressed in terms of mean ± standard deviation (SD). 2.8. Cellular Differentiation The alkaline phosphatase (ALP) activity of osteoblasts on PEEK and its nanocomposites (number of samples, n = 5) was measured with a colorimetric assay kit (No. 2900-500, Stanbio Laboratory, Boerne, TX, USA). The kit used colorless 4-nitrophenyl phosphate as a substrate. The enzyme ALP of the cells hydrolyzed the substrate to color 4-nitrophenol and an inorganic phosphate. In the process, test samples were placed in each well of a 48-well plate. Osteoblasts were seeded on the samples for 3, 7 and 14 days. The culture medium was changed every 3 days. At each time period, the cells were rinsed with PBS, and lysed with 0.1% triton X-100 at 4 ◦ C for 30 min. The cell lysates were then centrifuged at 4 ◦ C followed by pipetting 10 µL supernatant liquid of each sample in a 96-well plate. Finally, p-nitrophenyl phosphate was introduced into the plate. The absorbance of p-nitrophenol formed was measured using a spectrophotometer (Beckman Coulter DTX 880) at 405 nm. The ALP activity was normalized to the total protein level of the samples determined by the Bio-Rad protein Assay (Bio-Rad, Hercules, CA, USA). Calcium mineralization of differentiating osteoblast on PEEK and its nanocomposites was measured with Alizarin red-S (Sigma Aldrich, Darmstadt, Germany) after cultivation with MC3T3-E1 pre-osteoblasts for 28 days. Disk samples of 10 mm diameter (number of samples, n = 5) were placed in a 24-well plate. At the end of the experiment, cell cultures were fixed in 4% paraformaldehyde, washed twice with PBS and then stained with Alizarin red-S. To quantify calcium mineralization,
Polymers 2016, 8, 425
6 of 19
the alizarin red stained cultures were incubated with 10% cetyl-pyridinium chloride for 30 min in each well to release calcium-bound alizarin red into solution. Then extracted supernatant was transferred to a 96-well plate. The optical absorbance of the released alizarin red was measured at 562 nm using a spectrophotometer. Polymers 2016, 8, 425
2.9. Statistical Analysis for Cellular Tests
6 of 18
2.9. Analysis Cellular Tests assays were performed in triplicate for each treatment and the AllStatistical cell viability andfor differentiation
results were expressed mean ± standardassays deviation A two-way ANOVA to determine All cell viabilityasand differentiation were(SD). performed in triplicate for was each used treatment and the results were expressed as mean ± standard deviation (SD). A two-way ANOVA was used the significance level of difference and p < 0.05 was considered to be statistically significant. to determine the significance level of difference and p < 0.05 was considered to be statistically significant.
3. Results and Discussion 3. Results and Discussion
3.1. Structure and Morphology 3.1. Structure and Morphology
Figure 2a shows the XRD patterns of PEEK/(15% nHA)-(0.93% MWNT) and PEEK/(15% FigureMWNT) 2a shows hybrids. the XRD patterns of purposes PEEK/(15%of nHA)-(0.93% MWNT) PEEK/(15% nHA)nHA)-(1.88% For the comparison, XRD and patterns of pure PEEK, (1.88% MWNT) hybrids. For the purposes of comparison, XRD patterns of pure PEEK, PEEK/(0.93% PEEK/(0.93% MWNT) and PEEK/(1.83% MWNT) composites are depicted in Figure 2b. Pure PEEK MWNT) and PEEK/(1.83% MWNT) composites are depicted in Figure 2b. Pure PEEK exhibits exhibits characteristic peaks at around 2θ = 18.8◦ , 20.7◦ , 22.9◦ and 28.9◦ , corresponding to characteristic peaks at around 2θ = 18.8°, 20.7°, 22.9° and 28.9°, corresponding to (110), (111), (200) (110), (111), (200) and (211) crystalline planes, respectively [31]. The patterns of PEEK/MWNT and (211) crystalline planes, respectively [31]. The patterns of PEEK/MWNT nanocomposites show nanocomposites show additional peak at 26.6◦ due to the (002) reflection of nanotubes. For both additional peak at 26.6° due to the (002) reflection of nanotubes. For both PEEK/(15% nHA)-(0.93% PEEK/(15% nHA)-(0.93% and PEEK/(15% nHA)-(1.88% MWNT) hybrids, the peaks arising MWNT) and PEEK/(15%MWNT) nHA)-(1.88% MWNT) hybrids, the peaks arising from the crystalline planes fromofthe crystalline of observed nHA fillers can be clearly observed in addition to the reflections. nHA fillers can planes be clearly in addition to the PEEK reflections. Moreover, thePEEK (002) peak of ◦ Moreover, the (002) peakoverlaps of nHA with located ~26.4 with the (002) peak of MWNTs. nHA located at ~26.4° the at (002) peakoverlaps of MWNTs.
b
Figure 2. X-ray diffraction (XRD) patterns of (a) PEEK/(15% nHA)-(0.93% MWNT) and Figure 2. X-ray diffraction (XRD) patterns of (a) PEEK/(15% nHA)-(0.93% MWNT) and PEEK/(15% nHA)PEEK/(15% nHA)-(1.88% MWNT) hybrids and (b) pure PEEK and PEEK/MWNT nanocomposites. (1.88% MWNT) hybrids and (b) pure PEEK and PEEK/MWNT nanocomposites.
Figure 3a,b are the SEM images of PEEK/MWNT nanocomposites showing the homogeneous dispersion of MWNT fillers in the PEEK matrix. It can be seen that the PEEK matrix is quite rough, indicating the ductile nature of the nanocomposites. Figure 3c shows the SEM image of PEEK/(15% nHA)-(1.88% MWNT) hybrid. Some nHA agglomerates can be readily seen due to higher nHA filler loading in the hybrid.
Polymers 2016, 8, 425
7 of 19
Figure 3a,b are the SEM images of PEEK/MWNT nanocomposites showing the homogeneous dispersion of MWNT fillers in the PEEK matrix. It can be seen that the PEEK matrix is quite rough, indicating the ductile nature of the nanocomposites. Figure 3c shows the SEM image of PEEK/(15% nHA)-(1.88% MWNT) hybrid. Some nHA agglomerates can be readily seen due to higher nHA filler2016, loading Polymers 8, 425 in the hybrid. 7 of 18
Figure 3. Scanning electron microscopy (SEM) images of (a) PEEK/(0.93 vol % MWNT); Figure 3. Scanning electron microscopy (SEM) images of (a) PEEK/(0.93 vol % MWNT); (b) PEEK/ (b) PEEK/(1.88 vol % MWNT) and (c) PEEK/(15% nHA)-(1.88% MWNT) nanocomposites. Black arrows (1.88 vol % MWNT) and (c) PEEK/(15% nHA)-(1.88% MWNT) nanocomposites. Black arrows indicate indicate MWNT fillers. MWNT fillers.
3.2. Crystallization Behavior 3.2. Crystallization Behavior Figure 4 shows typical DSC cooling scans of neat PEEK and its nanocomposites. The crystallization Figure 4 shows typical cooling scans of neat(ΔH PEEK and nanocomposites. The crystallization temperature (Tc) and the DSC crystallization enthalpy c) can beits determined from these curves, and temperature the degree crystallization enthalpy beitsdetermined fromisthese curves, c ) and c ) can tabulated in(TTable 2. The of crystallinity (Χc) (∆H of PEEK and nanocomposites calculated and tabulated in Tableequation: 2. The degree of crystallinity (Xc ) of PEEK and its nanocomposites is calculated from the following from the following equation: ∆ % 100% (1) 1 Φ ∆ where ΔHm is the melting enthalpy of the 100% crystalline PEEK, i.e., 130 J/g [31], and Φ is the weight fraction of the filler of the nanocomposites. The Χc values of the specimens studied are also listed in Table 2. DSC results indicate that the additions of low MWNT levels to PEEK increase its crystallization temperature. The Tc value of pure PEEK is 281.14 °C, and increases to 285.91 and 286.58 °C by adding
Polymers 2016, 8, 425
8 of 19
Xc ( % ) =
∆Hc × 100% (1 − Φ) × ∆Hm
(1)
where ∆Hm is the melting enthalpy of the 100% crystalline PEEK, i.e., 130 J/g [31], and Φ is the weight fraction of the filler of the nanocomposites. The Xc values of the specimens studied are also listed in Table 2.2016, DSC8,results indicate that the additions of low MWNT levels to PEEK increase its crystallization Polymers 425 8 of 18 temperature. The Tc value of pure PEEK is 281.14 ◦ C, and increases to 285.91 and 286.58 ◦ C by 0.93% 1.88% MWNTs, respectively. These demonstrate that MWNTs as effective nucleation addingand 0.93% and 1.88% MWNTs, respectively. These demonstrate thatserve MWNTs serve as effective sites for PEEK on coolingon from melting leading to an increase of the degree nucleation sitescrystallites for PEEK crystallites cooling fromtemperature, melting temperature, leading to an increase of the of crystallinity. By adding 15% nHA the to PEEK/(0.93% MWNT) and PEEK/(1.83% MWNT), the Tc degree of crystallinity. By adding 15%tonHA the PEEK/(0.93% MWNT) and PEEK/(1.83% MWNT), values to decrease. Moreover, Xc valuesXof PEEK/(15% nHA)-(0.93%MWNT) and PEEK/(15% the Tc appear values appear to decrease. Moreover, of PEEK/(15% nHA)-(0.93% MWNT) and c values nHA)-(0.93% MWNT) hybrids also hybrids decreasealso duedecrease to the agglomeration of nHA fillers as shown in PEEK/(15% nHA)-(0.93% MWNT) due to the agglomeration of nHA fillers as Figure 4. shown in Figure 4.
Figure 4. 4. Differential Differential scanning scanning calorimetry calorimetry (DSC) (DSC) cooling cooling curves curves of of PEEK PEEK and and its its nanocomposites. nanocomposites. Figure Table 2. 2. Crystallization Crystallization parameters parameters of of PEEK PEEK and Table and its its nanocomposites. nanocomposites.
Sample Sample PEEK PEEK PEEK/(0.93% MWNT) PEEK/(0.93% MWNT) PEEK/(1.88% MWNT) PEEK/(1.88% MWNT) PEEK/(15% nHA)-(0.93% MWNT) PEEK/(15% nHA)-(0.93% MWNT) PEEK/(15% nHA)-(1.88% MWNT) PEEK/(15% nHA)-(1.88% MWNT)
TTc c(◦(°C) C)
281.14 281.14 285.91 285.91 286.58 286.58 284.90 284.90 284.73 284.73
c (J/g) X (%) FWHM ∆HΔH (◦ C) (°C) c (J/g) c Xc (%)FWHM
59.38 59.38 59.26 59.26 59.85 59.85 36.87 36.87 35.97 35.97
45.6845.68 46.2846.28 47.4647.46 41.4041.40 41.30
41.30
7.57 8.81 9.62 9.21 9.07
7.57 8.81 9.62 9.21 9.07
Furthermore, the the full full width width at at half-maximum half-maximum (FWHM) (FWHM) of of crystallization crystallization peak peak of of PEEK PEEK increases increases Furthermore, with increasing MWNT content. The FWHM values of PEEK and its nanocomposites are also listed with increasing MWNT content. The FWHM values of PEEK and its nanocomposites are also listed in Table Table 2. 2. This Thisincrease increaseininthe thewidth width crystallization peak of PEEK/MWNT nanocomposites in ofof thethe crystallization peak of PEEK/MWNT nanocomposites due due to MWNT additions could be attributed to a wider crystal size distribution However, to MWNT additions could be attributed to a wider crystal size distribution [32]. However,[32]. the addition of the addition of 15% nHA to thenanocomposites PEEK/MWNT nanocomposites leads to aofslight decrease of the FWHM 15% nHA to the PEEK/MWNT leads to a slight decrease the FWHM of crystallization of crystallization peak and a marked decreaseThus in crystallinity. Thusof a large of nHA fillers that peak and a marked decrease in crystallinity. a large amount nHA amount fillers that agglomerate in agglomerate in the PEEK matrix cannot act as effective sites for polymeric chain nucleation. the PEEK matrix cannot act as effective sites for polymeric chain nucleation. 3.3. Tensile Behavior 3.3. Tensile Behavior Figure 5 shows the stress-strain curves of PEEK and its nanocomposites. The tensile parameters Figure 5 shows the stress-strain curves of PEEK and its nanocomposites. The tensile parameters of of these samples and human cortical bone are summarized in Table 3. It is obvious that the these samples and human cortical bone are summarized in Table 3. It is obvious that the elastic modulus elastic modulus of PEEK can be increased from 3.87 to 4.25 GPa by adding 1.88 vol % MWNTs. of PEEK can be increased from 3.87 to 4.25 GPa by adding 1.88 vol % MWNTs. The elongation at The elongation at break of PEEK is reduced from 67.1% to 56.48% by adding 1.88 vol % MWNTs. break of PEEK is reduced from 67.1% to 56.48% by adding 1.88 vol % MWNTs. However, the However, the PEEK/(15% nHA)-(1.88% MWNT) hybrid still exhibits ductile feature as evidenced PEEK/(15% nHA)-(1.88% MWNT) hybrid still exhibits ductile feature as evidenced by the SEM by the SEM micrograph as shown in Figure 3b. MWNTs with exceptionally high stiffness also micrograph as shown in Figure 3b. MWNTs with exceptionally high stiffness also exhibit high mechanical flexibility upon the application of large deformation strains [33]. Thus the additions of low MWNT contents to PEEK enhance its tensile stiffness and strength, with a small reduction in tensile ductility. On the other hand, the addition of 15 vol % nHA to PEEK increases it stiffness to 6.2 GPa, but with a drastic reduction in fracture elongation to 2.71% due to the brittle nature of nHA [23]. From
Polymers 2016, 8, 425
9 of 19
exhibit high mechanical flexibility upon the application of large deformation strains [33]. Thus the additions of low MWNT contents to PEEK enhance its tensile stiffness and strength, with a small reduction in tensile ductility. On the other hand, the addition of 15 vol % nHA to PEEK increases it stiffness to 6.2 GPa, but with a drastic reduction in fracture elongation to 2.71% due to the brittle nature of nHA [23]. From Table 3, the addition of 1.88 vol % MWNT to PEEK/(15% nHA) leads to a further increase in elastic modulus from 6.20 to 7.13 GPa. The tensile strength and elongation at break of the PEEK/(15% nHA)-(1.88% MWNT) hybrid are 64.48 MPa and 1.74%, respectively. all the tensile properties of PEEK/(15% nHA)-(1.88% MWNT) hybrid are Polymers 2016, 8, Therefore, 425 9 of 18 superior to those of human cortical bone. This demonstrates that the PEEK/(15% nHA)-(1.88% MWNT) demonstrates the for PEEK/(15% nHA)-(1.88% MWNT) hybrid can be forof fabricating load-bearing hybrid can bethat used fabricating load-bearing bone implants inused terms mechanical property bone implants From in terms of 2, mechanical property consideration. Table 2, PEEK/(15% nHA)-(0.93% consideration. Table PEEK/(15% nHA)-(0.93% MWNT)From and PEEK/(15% nHA)-(1.88% MWNT) MWNT) exhibit and PEEK/(15% MWNT)with hybrids exhibit lower Xc values comparingAs with hybrids lower XnHA)-(1.88% binary PEEK/MWNT composites. a binary result, c values comparing PEEK/MWNTnHA)-(0.93% composites. MWNT) As a result, PEEK/(15% PEEK/(15% and PEEK/(15% PEEK/(15%nHA)-(0.93% nHA)-(1.88%MWNT) MWNT)and hybrids exhibit nHA)lower (1.88% strength MWNT)than hybrids exhibit lower tensile strength than binary PEEK/MWNT composites as tensile binary PEEK/MWNT composites as shown in Table 3. As recognized, polymers shown in Table 3. As recognized, their composites degree of crystallinity and their composites with higherpolymers degree ofand crystallinity exhibit with betterhigher tensile strength due to the exhibit better tensile strength due to the presence of more ordered polymer crystallites. presence of more ordered polymer crystallites.
Figure stress-strain curves curves of of PEEK PEEK and and its its nanocomposites. nanocomposites. Figure 5. 5. Tensile Tensile stress-strain Table 3. Tensile properties of of PEEK PEEK and and its its nanocomposites. nanocomposites. Table 3. Tensile properties Sample Elastic modulus (GPa) Sample Elastic modulus (GPa) PEEK 3.87 ± 0.10 PEEK MWNT) 3.87 PEEK/(0.93% 4.21±± 0.10 0.11 PEEK/(0.93% 4.21 PEEK/(1.88%MWNT) MWNT) 4.25±± 0.11 0.85 PEEK/(1.88% MWNT) 4.25 PEEK/(15% nHA)-(0.93% MWNT) 6.83±± 0.85 0.20 PEEK/(15% nHA)-(0.93% MWNT) 6.83 ± 0.20 PEEK/(15% nHA)-(1.88% MWNT) 7.13 ± 0.12 PEEK/(15% nHA)-(1.88% MWNT) 7.13 ± 0.12 PEEK/(15% nHA) [23] 6.20 ± 0.13 PEEK/(15% nHA) [23] 6.20 ± 0.13 Human cortical bone [20] 7–30 Human cortical bone [20] 7–30
Tensile stress (Mpa) Tensile stress (Mpa) 80.06 ± 0.49 80.06 0.49 83.38± ± 0.78 83.38 0.78 82.08± ± 3.68 82.08 3.68 70.99± ± 7.51 70.99 ± 7.51 64.48 ± 8.51 64.48 ± 8.51 70.56 ± 3.22 70.56 ± 3.22 50–150 50–150
Elongation (%) Elongation (%) 67.10 ± 13.40 67.10 ±±13.20 13.40 57.25 57.25 ±±24.90 13.20 56.48 56.48 24.90 2.32 ±±1.15 2.32 ± 1.15 1.74 ± 0.58 1.74 ± 0.58 2.71 ± 0.34 2.71 ± 0.34 1–3 1–3
3.4. Wettability 3.4. Wettability Contact angle is a measure of the wettability of a solid when a liquid comes in contact with it. A Contact angle is a measure of the wettability of a solid when a liquid comes in contact with hydrophobic solid surface forms when the water contact angle is larger than 90°. In this case, the water it. A hydrophobic solid surface forms when the water contact angle is larger than 90◦ . In this case, droplet does not spread but rather forms a spherical cap resting on the solid surface with a contact angle. the water droplet does not spread but rather forms a spherical cap resting on the solid surface with By contrast, the hydrophilic solid surface shows a water contact angle smaller than 90°. Figure 6 shows a contact angle. By contrast, the hydrophilic solid surface shows a water contact angle smaller than 90◦ . the appearances of water droplets and contact angles on the surfaces of all samples studied. Pure Figure 6 shows the appearances of water droplets and contact angles on the surfaces of all samples PEEK displays a contact angle of 106.58° ± 1.13°, revealing its hydrophobic nature. Adding 0.93 vol % studied. Pure PEEK displays a contact angle of 106.58◦ ± 1.13◦ , revealing its hydrophobic nature. and 1.88 vol % MWNTs to PEEK decreases its water contact angles. At 1.88 vol % MWNT loading, the Adding 0.93 vol % and 1.88 vol % MWNTs to PEEK decreases its water contact angles. At 1.88 vol % contact angle reduces to 99.07° ± 0.50°. However, contact angle drops markedly to 84.08° ± 0.65° and 76.99° MWNT loading, the contact angle reduces to 99.07◦ ± 0.50◦ . However, contact angle drops markedly ± 0.78° by hybridizing 15% nHA with 0.93% MWNTs and 1.88% MWNTs, respectively. This is due to the presence of nHA, which is hydrophilic in nature. Thus hydrophilic PEEK/(15% nHA)-(0.93% MWNT) and PEEK/(15% nHA)-(1.88% MWNT) hybrids favor adhesion of osteoblasts on their surfaces.
Polymers 2016, 8, 425
10 of 19
to 84.08◦ ± 0.65◦ and 76.99◦ ± 0.78◦ by hybridizing 15% nHA with 0.93% MWNTs and 1.88% MWNTs, respectively. This is due to the presence of nHA, which is hydrophilic in nature. Thus hydrophilic PEEK/(15% nHA)-(0.93% MWNT) and PEEK/(15% nHA)-(1.88% MWNT) hybrids favor adhesion of Polymers 2016, on 8, 425 10 of 18 osteoblasts their surfaces.
Figure on PEEK PEEK and and its its nanocomposites. nanocomposites. Figure 6. 6. Contact Contact angles angles formed formed by by spreading spreading of of water water droplets droplets on
From the literature, enhancing the hydrophilicity of the polymer surface leads to increased cell From the literature, enhancing the hydrophilicity of the polymer surface leads to increased cell spreading and adhesion. Upon implantation into the body, water molecules interact with the material spreading and adhesion. Upon implantation into the body, water molecules interact with the material surfaces followed by protein adsorption. These surface proteins play a key role in cell adhesion, surfaces followed by protein adsorption. These surface proteins play a key role in cell adhesion, proliferation, and subsequent differentiation [34,35]. The bound proteins on the material surface proliferation, and subsequent differentiation [34,35]. The bound proteins on the material surface provide recognition sites for cell adhesion via specific cell receptors such as integrins [35,36]. provide recognition sites for cell adhesion via specific cell receptors such as integrins [35,36]. 3.5. Cellular Adhesion 3.5. Cellular Adhesion The initial cell-biomaterial interactions mimic to a certain extent the natural communication of The initial cell-biomaterial interactions mimic to a certain extent the natural communication of cells cells with extracellular matrix (ECM). Cell adhesion is mediated by the integrins of cell surface receptor with extracellular matrix (ECM). Cell adhesion is mediated by the integrins of cell surface receptor and and the ECM proteins (e.g., fibronectin, collagen), which in turn are sensitive to the chemical the ECM proteins (e.g., fibronectin, collagen), which in turn are sensitive to the chemical composition composition and wettability of biomaterials [37]. Integrins are transmembrane proteins that bind ECM and wettability of biomaterials [37]. Integrins are transmembrane proteins that bind ECM and and interact with the cytoskeleton at focal adhesion complexes. Once integrins adhere to such interact with the cytoskeleton at focal adhesion complexes. Once integrins adhere to such molecules, molecules, they are activated and clustered into nascent adhesions [37,38]. Therefore, osteoblast adhesion they are activated and clustered into nascent adhesions [37,38]. Therefore, osteoblast adhesion on the on the biomaterial surface is evidenced by markedly expedited cell spreading and dense actin fiber biomaterial surface is evidenced by markedly expedited cell spreading and dense actin fiber formation. formation. PEEK exhibits a relatively hydrophobic surface, thereby limiting cell attachment. By PEEK exhibits a relatively hydrophobic surface, thereby limiting cell attachment. By adding bioactive adding bioactive nHA and MWNTs, the resulting PEEK hybrids become hydrophilic as discussed nHA and MWNTs, the resulting PEEK hybrids become hydrophilic as discussed above. Figure 7a–c above. Figure 7a–c shows the fluorescence micrographs of osteoblasts cultured on the PEEK/(15% shows the fluorescence micrographs of osteoblasts cultured on the PEEK/(15% nHA)-(0.93% MWNT) nHA)-(0.93% MWNT) hybrid for 1 and 3 days, respectively. These micrographs show extensive hybrid for 1 and 3 days, respectively. These micrographs show extensive spreading of osteoblasts and spreading of osteoblasts and distinct actin stress fibers, especially for hybrids cultivated with distinct actin stress fibers, especially for hybrids cultivated with osteoblasts for 3 days. Furthermore, osteoblasts for 3 days. Furthermore, more distinct actin stress fibers are observed on the PEEK/(15% more distinct actin stress fibers are observed on the PEEK/(15% nHA)-(1.88% MWNT) hybrid as nHA)-(1.88% MWNT) hybrid as expected (Figure 8a,b). The higher expression level of actin and focal expected (Figure 8a,b). The higher expression level of actin and focal adhesion contacts demonstrate adhesion contacts demonstrate enhanced cellular activity and stable cytoskeleton, thereby facilitating enhanced cellular activity and stable cytoskeleton, thereby facilitating progressive development of progressive development of cellular processes [39]. For comparison, fluorescence micrographs of cellular processes [39]. For comparison, fluorescence micrographs of osteoblasts cultured on the osteoblasts cultured on the PEEK/(0.93% MWNT) and PEEK/(1.88% MWNT) nanocomposites for 3 PEEK/(0.93% MWNT) and PEEK/(1.88% MWNT) nanocomposites for 3 days are shown in Figure 9a,b, days are shown in Figure 9a,b, respectively. These images reveal that osteoblast can attach and spread respectively. These images reveal that osteoblast can attach and spread on the PEEK/MWNT composite on the PEEK/MWNT composite surfaces in the absence of nHA, but with lower amounts of the cell surfaces in the absence of nHA, but with lower amounts of the cell adhesion. It is noted that these adhesion. It is noted that these fluorescence figures provide qualitative observations only. fluorescence figures provide qualitative observations only.
Polymers 2016, 8, 425
11 of 19
Polymers 2016, 8, 425
11 of 18
Polymers 2016, 8, 425
11 of 18
Polymers 2016, 8, 425
11 of 18
Figure 7. Fluorescence micrographs of osteoblasts cultured on PEEK/(15% nHA)-(0.93% MWNT) hybrid
Figure 7. Fluorescence micrographs of osteoblasts cultured on PEEK/(15% nHA)-(0.93% MWNT) and stained for F-actinmicrographs cytoskeletonof(green) and nucleus for (a) 1 nHA)-(0.93% day and (b) 3MWNT) days; (c)hybrid High Figure 7. Fluorescence osteoblasts cultured(blue) on PEEK/(15% hybrid and7.stained for F-actin cytoskeleton (green) and on nucleus (blue) for (a) 1 day and hybrid (b) 3 days; Figure Fluorescence micrographs of(green) osteoblasts cultured PEEK/(15% nHA)-(0.93% MWNT) magnification showing the morphology well-organized at day and stained forimage F-actin cytoskeleton andofnucleus (blue) foractin (a) 1filaments day andof (b)a 3cell days; (c) 3. High (c) High image showing the morphology of well-organized actinand filaments of a(c) cell at day 3. andmagnification stained forimage F-actin cytoskeleton (green) andofnucleus (blue) for (a) 1filaments day (b)a cell 3 days; High magnification showing the morphology well-organized actin of at day 3. magnification image showing the morphology of well-organized actin filaments of a cell at day 3.
Figure 8. Fluorescence micrographs of osteoblasts cultured on PEEK/(15% nHA)-(1.88% MWNT) hybrid and stained for F-actin cytoskeleton (green) and nucleus at (a) day 1 and (b) day 3. Figure 8. Fluorescence micrographs of osteoblasts cultured on(blue) PEEK/(15% nHA)-(1.88% MWNT) Figure 8. Fluorescence micrographs of osteoblasts cultured on PEEK/(15% nHA)-(1.88% MWNT) Figure and 8. Fluorescence micrographs of osteoblasts cultured on(blue) PEEK/(15% nHA)-(1.88% MWNT) hybrid stained for F-actin cytoskeleton (green) and nucleus at (a) day 1 and (b) day 3. hybrid and and stained for for F-actin cytoskeleton nucleus(blue) (blue)atat day 1 and (b) day hybrid stained F-actin cytoskeleton(green) (green) and and nucleus (a)(a) day 1 and (b) day 3. 3.
Figure 9. Fluorescence micrographs of osteoblasts cultured on (a) PEEK/(0.93% MWNT) and (b) PEEK/(1.88% MWNT) nanocomposites stained for F-actin cytoskeleton (green) and nucleus (blue) Figure 9. Fluorescence micrographs ofand osteoblasts cultured on (a) PEEK/(0.93% MWNT) and (b) Figure 9. Fluorescence micrographs ofand osteoblasts on (a) PEEK/(0.93% MWNT) and (b) for 3 days. PEEK/(1.88% MWNT) nanocomposites stained forcultured F-actin cytoskeleton (green) and nucleus (blue) Figure 9. Fluorescence micrographs of osteoblasts cultured on (a) PEEK/(0.93% MWNT) and PEEK/(1.88% for 3 days. MWNT) nanocomposites and stained for F-actin cytoskeleton (green) and nucleus (blue) (b) PEEK/(1.88% MWNT) nanocomposites and stained for F-actin cytoskeleton andthrough nucleus The and spreading of osteoblasts on a material surface can also be(green) examined for 3 adherence days.
(blue) for adherence 3 days. and spreading of osteoblasts on a material surface can also be examined through SEM The imaging. Figure 10a,b show the SEM micrographs of PEEK/(1.88% MWNT) nanocomposites The adherence and spreading of osteoblasts on a material surface can also be examined through SEM imaging. Figure 10a,b SEM micrographs of PEEK/(1.88% MWNT) nanocomposites seeded with osteoblasts for 2show and 4the days, respectively. Apparently, osteoblasts attach firmly on these SEMadherence imaging. Figure 10a,b SEM micrographs of PEEK/(1.88% MWNT) seeded with osteoblasts for 2show and of 4 the days, respectively. Apparently, osteoblasts attach firmly on these The and spreading osteoblasts on a material surface can also benanocomposites examined through withFigure osteoblasts 2 andthe 4 days, Apparently, osteoblastsMWNT) attach firmly on these SEM seeded imaging. 10a,bforshow SEMrespectively. micrographs of PEEK/(1.88% nanocomposites
seeded with osteoblasts for 2 and 4 days, respectively. Apparently, osteoblasts attach firmly on these
Polymers 2016, 8, 425 Polymers 2016, 8, 425
12 of 19 12 of 18
Polymers 2016, 8, 425 12 of 18flatly nanocomposite surfaces after cultivation for 2 days. At day 4, they then proliferate and spread nanocomposite surfacesmany after cultivation for 2 days. At day 4, they thenthrough proliferate and spread extension. flatly on the surfaces in which neighbor cells link with each other cytoplasmic nanocomposite surfaces after cultivation for 2 days. At day 4, they then proliferate and spread flatly on the surfaces in which many neighbor cells link with each other through cytoplasmic extension. The PEEK/(1.83% MWNT) nanocomposite surface is almost covered with osteoblasts after culturing on the surfaces in which many neighbor cells link with each other through cytoplasmic extension. The PEEK/(1.83% MWNT) nanocomposite surface is almost covered with osteoblasts after culturing for 4 The days. It is evident that nanocomposite MWNTs act assurface effective sites covered for osteoblastic adhesion. culturing Interestingly, MWNT) is almost with osteoblasts for 4PEEK/(1.83% days. It is evident that MWNTs act as effective sites for osteoblastic adhesion.after Interestingly, osteoblasts attach and spread entirely on the PEEK/(15% nHA)-(0.93% MWNT) hybrid surface cultured for 4 days. It is evident that MWNTs effective sites for osteoblasticMWNT) adhesion.hybrid Interestingly, osteoblasts attach and spread entirelyactonasthe PEEK/(15% nHA)-(0.93% surface for 2 cultured days (Figure 11a).and At day 4, the feature remains unchanged (Figure 11b).surface osteoblasts spread entirely PEEK/(15% nHA)-(0.93% MWNT) hybrid for attach 2 days (Figure 11a). At osteoblastic day 4,on thethe osteoblastic feature remains unchanged (Figure 11b).
cultured for 2 days (Figure 11a). At day 4, the osteoblastic feature remains unchanged (Figure 11b).
Figure 10. images SEM images of PEEK/(1.88% MWNT) nanocomposite cultured osteoblasts for2 and Figure 10. SEM of PEEK/(1.88% MWNT) nanocomposite cultured withwith osteoblasts for (a) Figure images of PEEK/(1.88% MWNT) nanocomposite cultured with osteoblasts for (a) 2 and10. (b)SEM 4 days. (b) 4 days. (a) 2 and (b) 4 days.
Figure 11. SEM images of PEEK/(15% nHA)-(0.93% MWNT) hybrid cultured with osteoblasts for Figure 11.(b)SEM images of PEEK/(15%nHA)-(0.93% nHA)-(0.93% MWNT) cultured with osteoblasts for for (a) 2 and 4images days. Figure 11. SEM of PEEK/(15% MWNT)hybrid hybrid cultured with osteoblasts (a) 2 and (b) 4 days. (a) 2 and (b) 4 days. 3.6. Cellular Metabolic Activity 3.6. Cellular Metabolic Activity TheMetabolic MTT andActivity WST-1 assays can measure viable cell number [40], while Mwenifumbo et al. 3.6. Cellular The MTT that and MTT WST-1 assays can measure viable cellactivity number[41]. [40],Awhile Mwenifumbo et be al. demonstrated assay is related to cell metabolic live/dead stain would The MTT and WST-1 assays can measure viable cell number [40], while Mwenifumbo demonstrated that MTT assay is related to cell metabolic activity [41]. A live/dead stain would be used to measure cell viability. Figure 12 shows the results of MTT measurements for PEEK and its et al. demonstrated that MTT assay is Figure related cellPEEK/(1.88% metabolic [41]. A live/dead stain would used to measure cell viability. 12to shows the results activity of MTT measurements for PEEK and its be nanocomposites. PEEK/(0.93% MWNT) and MWNT) composites exhibit higher cell nanocomposites. PEEK/(0.93% MWNT) and PEEK/(1.88% MWNT) composites exhibit higher cell used metabolic to measure cell viability. Figure 12 shows the results of MTT measurements for PEEK activity comparing to pure PEEK specimen, especially after cultivation for 7 days. Thus and metabolic activity comparing to pure PEEK and specimen, especially MWNT) after surfaces. cultivation forbeen 7 days. Thus its nanocomposites. PEEK/(0.93% MWNT) PEEK/(1.88% composites exhibit higher MWNT fillers promote the growth of osteoblasts on the nanocomposite It has reported MWNT fillers promote the growth of osteoblasts on the nanocomposite surfaces. It has been reported in the literature that comparing carbon nanotubes mayPEEK exhibitspecimen, cytotoxic effects towards biological cells [42,43]. cell metabolic activity to pure especially after cultivation for 7 days. in thecytotoxicity literature that carbon nanotubes exhibit carbon cytotoxic effects towards biological is mainly caused by may individual dispersed insurfaces. the cells cell [42,43]. culture ThusThe MWNT fillers promote the growth of osteoblasts onnanotubes the nanocomposite It has been The cytotoxicity is mainly caused by individual carbon nanotubes dispersed in the cell culture medium or organic suspensions. As such, individual carbon nanotubes can penetrate cell membrane reported in the literature that carbon nanotubes may exhibit cytotoxic effects towards biological medium or in organic suspensions. As such, individual carbon nanotubeseffects can penetrate cell membrane and reside the cytoplasm [44,45]. On the other hand, no cytotoxic are observed in carbon cells [42,43]. The cytotoxicity is[44,45]. mainlyOn caused by individual carboneffects nanotubes dispersed in the cell and reside in the cytoplasm the other hand, no cytotoxic are observed in carbon nanotube fillers of polymer nanocomposites [21–23]. This is because carbon nanotube fillers are culture medium or organic suspensions. As such, individual carboncarbon nanotubes can penetrate nanotube fillers polymer nanocomposites This is because nanotube are cell embedded firmlyofwithin the matrix of polymer[21–23]. nanocomposites. In this case, they serve as fillers the active membrane and reside in the cytoplasm [44,45]. On the other hand, no cytotoxic effects are observed embedded firmly within the matrix of polymer nanocomposites. In this case, they serve as the active sites for the attachment of osteoblasts. From Figure 12, a marked increase in cell metabolic activity in sites forseen the in attachment of osteoblasts. From MWNT) Figure 12, a marked in cell metabolic activityfillers carbon nanotube fillers of polymer nanocomposites [21–23]. Thisincrease is nHA)-(1.88% because carbon nanotube can be both PEEK/(15% nHA)-(0.93% and PEEK/(15% MWNT) hybrids. can be seen in both PEEK/(15% nHA)-(0.93% MWNT) and PEEK/(15% nHA)-(1.88% MWNT) hybrids. are embedded firmly within the matrix polymer nanocomposites. this case, they serve Thus the presence of inorganic nHA inofsuch hybrids offers a beneficialIneffect in enhancing theiras the Thus of inorganic in such hybrids offers a beneficial effect in enhancing their activebiocompatibility. sitesthe forpresence the attachment of nHA osteoblasts. From Figure 12, a marked increase in due cell to metabolic From the water contact measurements, these hybrids are hydrophilic the biocompatibility. From the water contact measurements, these hybrids are hydrophilic due to the presence nHA. On the contrary, PEEK/(0.93% and PEEK/(1.83% MWNT) composites activity can beofseen in both PEEK/(15% nHA)-(0.93%MWNT) MWNT) and PEEK/(15% nHA)-(1.88% MWNT) presence of nHA. On the contrary, PEEK/(0.93% MWNT) and PEEK/(1.83% MWNT) composites exhibit hydrophobic behavior because ofnHA the absence nHA. Asoffers discussed above, increased hybrids. Thus the presence of inorganic in suchofhybrids a beneficial effect insurface enhancing exhibit hydrophobic behavior because of the absence of nHA. As discussed above, increased surface
their biocompatibility. From the water contact measurements, these hybrids are hydrophilic due to the presence of nHA. On the contrary, PEEK/(0.93% MWNT) and PEEK/(1.83% MWNT) composites
Polymers 2016, 8, 425
13 of 19
Polymers 2016, 8, 425
13 of 18
exhibit hydrophobic behavior because of the absence of nHA. As discussed above, increased surface hydrophilicity hydrophilicity enhances enhancesprotein proteinadsorption adsorptionand andcell cell spreading. spreading. Thus Thus hydrolytic hydrolytic materials materials favor favor the adhesion and proliferation of osteoblasts on their surfaces [34–46].
Figure bromide (MTT) assay results showing cell Figure 12. 12.3-(4,5-Dimethylthiazol-2-yl)-2,5-diphenyltetrazolium 3-(4,5-Dimethylthiazol-2-yl)-2,5-diphenyltetrazolium bromide (MTT) assay results showing metabolic activity of murine MC3T3-E1 pre-osteoblasts grown on PEEK and and its nanocomposites for 1,for 3 cell metabolic activity of murine MC3T3-E1 pre-osteoblasts grown on PEEK its nanocomposites and 7 days. * represents p < 0.05. Significance is assessed for each assayed. 1, 3 and 7 days. * represents p < 0.05. Significance is assessed for time-point each time-point assayed.
It is worth-noting that MTT measurements tend to give lower cellular metabolic activity for carbon It is worth-noting that MTT measurements tend to give lower cellular metabolic activity for carbon nanotubes due to the formation of insoluble formazan products [47]. MTT assay is a colorimetric test nanotubes due to the formation of insoluble formazan products [47]. MTT assay is a colorimetric test based on the reduction of the yellowish, water-soluble tetrazolium salt into a water-insoluble, purple based on the reduction of the yellowish, water-soluble tetrazolium salt into a water-insoluble, purple formazan product by mitochondrial enzyme succinate dehydrogenase of living cells in the culture. formazan product by mitochondrial enzyme succinate dehydrogenase of living cells in the culture. The reduction occurs only when reductase enzymes are active. Dead cells are incapable of converting The reduction occurs only when reductase enzymes are active. Dead cells are incapable of converting MTT into formazan. MTT assay needs an additional solubilization step to dissolve color formazan MTT into formazan. MTT assay needs an additional solubilization step to dissolve color formazan crystals. The intensity of the color gives a relative count of viable cells. Such formazan crystals do not crystals. The intensity of the color gives a relative count of viable cells. Such formazan crystals do not dissolve completely in an organic solvent, particularly in the presence of carbon nanotubes [47]. The dissolve completely in an organic solvent, particularly in the presence of carbon nanotubes [47]. undissolved crystals in a solvent give low colorimetric readings in the spectrophotometric The undissolved crystals in a solvent give low colorimetric readings in the spectrophotometric measurements, causing low cell metabolic activity. By contrast, WST-1 assay produces water soluble measurements, causing low cell metabolic activity. By contrast, WST-1 assay produces water formazan and does not form insoluble clusters like MTT. Therefore, WST-1 assay generates reliable soluble formazan and does not form insoluble clusters like MTT. Therefore, WST-1 assay generates results for assessing cell metabolic activity. Figure 13 shows the cell metabolic activity measured by reliable results for assessing cell metabolic activity. Figure 13 shows the cell metabolic activity the WST-1 assay for the PEEK-based nanocomposites. Apparently, WST-1 assay gives considerably measured by the WST-1 assay for the PEEK-based nanocomposites. Apparently, WST-1 assay gives higher cell metabolic activity than MTT assay. At day 7, the amount of viable cells for PEEK/(15% considerably higher cell metabolic activity than MTT assay. At day 7, the amount of viable cells for nHA)-(0.93% MWNT) and PEEK/(15% nHA)-(1.88% MWNT) hybrids is relatively high as compared PEEK/(15% nHA)-(0.93% MWNT) and PEEK/(15% nHA)-(1.88% MWNT) hybrids is relatively high as to PEEK/(0.93% MWNT) and PEEK/(1.83% MWNT) composites. compared to PEEK/(0.93% MWNT) and PEEK/(1.83% MWNT) composites. For the MTT and WST assays, the amount of formazan crystals produced is directly proportional to the number of metabolically active cells in the culture. Both assays reveal that, after 7 days, cells cultured on the PEEK/(15% nHA)-(0.93% MWNT) and PEEK/(15% nHA)-(1.88% MWNT) hybrids exhibit a significantly higher metabolic activity than on the PEEK control specimen. As aforementioned, nHA enhances protein adsorption, thereby promoting osteoblast adhesion, proliferation, and differentiation [19]. In other words, proteins that can induce osteoblast adhesion, including fibronectin and vitronectin, have been reported to have higher adsorption rates on nHA [19,48]. Moreover, osteoblastic cells also attach and survive on the MWNT materials, producing higher metabolic activity on the basis of MTT results [41]. Therefore, PEEK/(15% nHA)-(0.93% MWNT) and PEEK/(15% nHA)-(1.88% MWNT) hybrid nanocomposites exhibit enhanced cell activity compared to the control PEEK specimen. Figure 13. 2-(4-Iodophenyl)-3-(4-nitrophenyl)-5-(2,4-disulfophenyl)-2H-tetrazolium (WST-1) assay results showing cell metabolic activity of murine MC3T3-E1 pre-osteoblasts grown on PEEK and its nanocomposites for 1, 3 and 7 days. * represents p < 0.05. Significance is assessed for each time-point assayed.
formazan and does not form insoluble clusters like MTT. Therefore, WST-1 assay generates reliable results for assessing cell metabolic activity. Figure 13 shows the cell metabolic activity measured by the WST-1 assay for the PEEK-based nanocomposites. Apparently, WST-1 assay gives considerably higher cell metabolic activity than MTT assay. At day 7, the amount of viable cells for PEEK/(15% nHA)-(0.93% MWNT) and PEEK/(15% nHA)-(1.88% MWNT) hybrids is relatively high as compared Polymers 2016, 8, 425 14 of 19 to PEEK/(0.93% MWNT) and PEEK/(1.83% MWNT) composites.
Polymers 2016, 8, 425
14 of 18
For the MTT and WST assays, the amount of formazan crystals produced is directly proportional to the number of metabolically active cells in the culture. Both assays reveal that, after 7 days, cells cultured on the PEEK/(15% nHA)-(0.93% MWNT) and PEEK/(15% nHA)-(1.88% MWNT) hybrids exhibit a significantly higher metabolic activity than on the PEEK control specimen. As aforementioned, nHA enhances protein adsorption, thereby promoting osteoblast adhesion, proliferation, and differentiation [19]. In other words, proteins that can induce osteoblast adhesion, including fibronectin and vitronectin, have been reported to have higher adsorption rates on nHA [19,48]. Moreover, osteoblastic cells also attach and survive on the MWNT materials, producing higher metabolic activity on the basis of MTT results [41]. Therefore, PEEK/(15% nHA)-(0.93% MWNT) and PEEK/(15% Figure 13. (WST-1) assay results Figure 13. 2-(4-Iodophenyl)-3-(4-nitrophenyl)-5-(2,4-disulfophenyl)-2H-tetrazolium 2-(4-Iodophenyl)-3-(4-nitrophenyl)-5-(2,4-disulfophenyl)-2H-tetrazolium (WST-1) assay nHA)-(1.88% MWNT) hybrid nanocomposites exhibit enhanced cell activity compared to the control showing cell metabolic activity of murine MC3T3-E1 pre-osteoblasts grown on PEEK and its results showing cell metabolic activity of murine MC3T3-E1 pre-osteoblasts grown on PEEK and its PEEKnanocomposites specimen. nanocompositesfor for1,1, 3 and 7 days. * represents p < 0.05. Significance is assessed each time-point 3 and 7 days. * represents p < 0.05. Significance is assessed for eachfor time-point assayed. assayed.
3.7. Cellular Differentiation and Mineralization 3.7. Cellular Differentiation and Mineralization Alkaline phosphatase (ALP) activity and calcium mineralization are mostly used as biochemical Alkaline phosphatase (ALP) activity and calcium mineralization are mostly used as biochemical markers for early and late differentiation of osteoblast cells, respectively [49,50]. Bone formation markers for early and late differentiation of osteoblast cells, respectively [49,50]. Bone formation involves a series of events that occur in the initial proliferation and differentiation stages, followed by involves a series of events that occur in the initial proliferation and differentiation stages, followed mineralization. Proliferating osteoblasts show alkaline phosphatase activity in vitro; this is greatly by mineralization. Proliferating osteoblasts show alkaline phosphatase activity in vitro; this is greatly enhanced during early differentiation of osteoblasts. Alkaline phosphatase catalyzes hydrolysis of enhanced during early differentiation of osteoblasts. Alkaline phosphatase catalyzes hydrolysis p-nitrophenyl phosphate in alkaline buffer and produces phenol and inorganic phosphate. An enhanced of p-nitrophenyl phosphate in alkaline buffer and produces phenol and inorganic phosphate. level of this enzyme is required just before the onset of bone mineralization, providing localized An enhanced level of this enzyme is required just before the onset of bone mineralization, providing enrichment of inorganic phosphate for nHA nucleation and proliferation. Figure 14 shows the ALP localized enrichment of inorganic phosphate for nHA nucleation and proliferation. Figure 14 shows activity for the osteoblastic cells exposed to PEEK and its nanocomposites. Apparently, very low ALP the ALP activity for the osteoblastic cells exposed to PEEK and its nanocomposites. Apparently, activity is detected after 3 days for all samples investigated. At day 14, alkaline phosphatase activity very low ALP activity is detected after 3 days for all samples investigated. At day 14, alkaline of osteoblasts grown on the hybrids, especially PEEK/(15% nHA)-(1.88% MWNT) increases markedly phosphatase activity of osteoblasts grown on the hybrids, especially PEEK/(15% nHA)-(1.88% MWNT) in comparison to those observed in pure PEEK and PEEK-MWNT nanocomposites. This increases markedly in comparison to those observed in pure PEEK and PEEK-MWNT nanocomposites. demonstrates the ability of this hybrid nanocomposite to enhance early osteoblast differentiation. This demonstrates the ability of this hybrid nanocomposite to enhance early osteoblast differentiation.
Figure 14. phosphatase (ALP) (ALP) activity activity normalized normalized to to protein protein content content of of murine murine MC3T3-E1 MC3T3-E1 Figure 14. Alkaline Alkaline phosphatase pre-osteoblasts cultured on PEEK and its nanocomposites for 1, 3 and 7 days. * represents p pre-osteoblasts cultured on PEEK and its nanocomposites for 1, 3 and 7 days. * represents p