The ACE I/D polymorphism was determined by polymerase chain reaction (PCR) .... Stephens et al. ... Rigat B, Hubert C, Corvol P, Soubrier F. PCR detection.
RESEARCH REPORT
POLYMORPHISM IN THE ANGIOTENSIN-CONVERTING ENZYME (ACE) GENE AND ACE ACTIVITY IN TYPE 2 DIABETIC PATIENTS A. Nikzamir*1, M. Nakhjavani2, T.Golmohammadi3, L. Dibai2 and R. Saffary2
1) Department of Biochemistry, School of Medicine, Ahwaz Jondi Shapour University of Medical Sciences, Ahwaz, Iran 2) Endocrinology and Metabolism Research Center (EMRC), Vali-e-Asr Hospital, Tehran University of Medical Sciences, Tehran, Iran 3) Department of Biochemistry, School of Medicine, Tehran University of Medical Sciences, Tehran, Iran
Abstract- It has recently been shown that an insertion (I)/deletion (D) polymorphism exists in the angiotensin-converting enzyme (ACE) gene that can affect the serum ACE level. There are three genotypes: DD, DI, and II, with the ACE level being highest in DD, intermediate in DI, and lowest in II. The DD genotype has been reported as a genetic risk factor for diabetes mellitus. In the present investigation, 170 patients with type 2 diabetes mellitus (T2DM) and 144 control subjects were studied. The ACE I/D polymorphism was determined by polymerase chain reaction (PCR) utilizing specific primers. ACE activity was determined spectrophotometrically. Distribution of ACE gene (I/D) polymorphism and allele frequencies in patients with T2DM were significantly different from those in control (P < 0.001); D allele frequency was 51% in T2DM vs. 48% in controls. The level of ACE activity was significantly higher in the DD genotype (91.1 ± 23.18) than those in ID (60.6 ± 22.8) and in II genotypes (36.8 ± 6.9). There was a significant difference in genotype distribution between the two groups (P < 0.001). New normal ranges of serum ACE level were determined for each genotype. Moreover, we found test sensitivity to be 62.3%. Serum ACE activity was significantly associated with ACE (I/D) gene polymorphism. © 2008 Tehran University of Medical Sciences. All rights reserved. Acta Medica Iranica 2008; 46(4): 277-282.
Key words: Renin-angiotensin system, angiotensin converting enzyme, type 2 diabetes mellitus
INTRODUCTION It has been shown that patients with active clinical diseases tend to have a higher serum ACE level. The ACE gene contains a polymorphism based on the presence (insertion [I]) or absence (deletion [D]) of a nonsense DNA fragment. The polymorphism is Received: 12 Feb. 2007, Revised: 5 Mar. 2007, Accepted: 14 Apr. 2007
* Corresponding Author: Abdolrahim Nikzamir, Department of Biochemistry, School of Medicine, Ahwaz Jondi Shapour University of Medical Sciences, Ahwaz, Iran Tel: + 98 21 66948671 Fax: +98 21 66948671 Email: nikzamirar @ yahoo.com
located in intron 16, so that ACE itself does not differ due to genotype, but the polymorphism accounts for 47% of the total phenotypic variance in serum ACE level. The genotype is classified into three types: deletion homozygotes, DD; insertion homozygotes, II; and heterozygotes, DI. The serum ACE level of DD type is reported to be about twice that of II type and DI type is intermediate (1, 2). The DD genotype has been reported as a genetic risk factor for myocardial infarction, dilated cardiomyopathy, left ventricular hypertrophy, IgA nephropathy, diabetic nephropathy and hypertension (3, 4). In the present study, we examined the distribution of genotypes both in type 2 diabetes
Polymorphism in the ACE gene
mellitus (T2DM) and in normal controls to find a genetic risk factor. Furthermore, the serum ACE level of each genotype was assessed in T2DM and normal controls.
MATERIALS AND METHODS ACE gene polymorphism was studied in 170 patients with T2DM and 144 control subjects in Tehran, Iran. Patients were recruited from Diabetes Clinic of the Imam Hospital, Tehran University of Medical Sciences. The diagnosis of T2DM was based on the WHO criteria (i.e. fasting plasma glucose level higher than 126 mg/dl and/or glucose level exceeding 200 mg/dl at 2 hours in the 75 g oral glucose tolerance test) (5). Informed consent was obtained from patients and control subjects. The study was approved by Ethics Committee of Tehran University of Medical Sciences. Controls did not have any abnormalities regarding their physical examination, blood pressure, family history, urine analysis and routine laboratory blood tests and none of them were receiving any medications at the time of participation. After a 12-hour overnight fasting, 10 ml of 15% EDTA anticoagulated blood sample and 5 ml of blood without anticoagulant were obtained from each individual and centrifuged within 2 hours. The D and I alleles were identified on the basis of polymerase chain reaction (PCR) amplification of the respective fragments from intron 16 of the ACE gene and size fractionation and visualization by electrophoresis. DNA was extracted from peripheral leukocytes with standard techniques (6). PCR was performed with 20 pmoles of each primer: sense oligo 5'CTGGAGACCACTCCCATCCTTTCT3' and anti-sense oligo: 5'GATGTGGCCATCACATT CGTCAGAT3' in a final volume of 25 µl, containing 1.5 mM MgCl2, 50 mM KCl, 10 mM Tris-HCl, pH 8.3, 0.2 mM of each dNTP, and 0.9 unit of Taq polymerase (Fermantas). The DNA was amplified for 30 cycles with denaturation at 94° C for 30 s, annealing at 58° C for 30 s and extension at 72° C for 1 min, followed by final extension at 72° C for 8 min (DNA Thermal Cycler Eppendorf). PCR products were electrophoresed in 2% agarose-gel
278
Acta Medica Iranica, Vol. 46, No. 4 (2008)
with 5 µg ethidium bromide per milliliter. The amplification products of the D and I alleles were identified by 300 nm ultraviolet trans-illumination as distinct bands (D allele: 190 bp; I allele: 490 bp) (Fig. 1). Because the D allele in heterozygous samples was preferentially amplified, each sample with the DD genotype was subjected to a second independent PCR amplification with a primer pair that recognized an insertion-specific sequence (hace 5a, 5'TGGGACCACAGCGCCCGCCACTAC3'; hace 5c, 5'TCGCCAGCCCTCCCATGCCCATAA 3'), under identical PCR conditions except for an annealing temperature of 67° C. The reaction yields a 335-bp amplicon only in the presence of an I allele, and no product in samples homozygous for DD (7, 8). This procedure demonstrated that approximately 5.7% of samples (18/314) with the DI genotype were misclassified as DD with the insertion-spanning primer (Fig. 2). Serum ACE level was measured by a colorimetric method (turbidimetry assay, modified Lieberman method) using p-hydroxyhippuryl-Lhistidyl-L-leucine (Sigma, USA) as the substrate (9). The allele ratio and genotype distribution of diabetic patients and normal control subjects were analyzed with chi-square test. Analysis of serum ACE level was performed using Mann-Whitney U test for comparison of the two groups, and KruskalWallis test for the three genotypes. A P value < 0.05 was considered significant. Values are expressed as means ± SD.
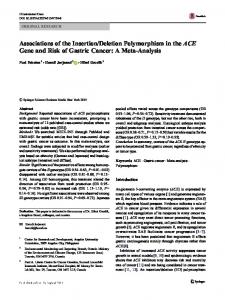
Fig. 1. Detection of ACE I/D polymorphism. M, 100-1000 bp DNA ladder; DD homozygous, a single 190 bp product; ID heterozygous, both 190 bp and 490 bp; II homozygous, a single 490 bp product.
A. Nikzamir et al.
In normal control subjects, the average serum ACE level of II, DI, and DD individuals were 30.6 ± 21.6, 43.4 ± 18.9, and 57.5 ± 20.2 (IU/l), respectively. Of the 170 diabetic patients, serum ACE levels were measured at the first visit to our hospital, with the average values being 36.8 ± 6.9, 60.6 ± 22.8, and 91.1 ± 23.18 (IU/l) for II, DI, and DD types, respectively. Significant differences among the three genotypes were found for both T2DM patients (P < 0.001) and normal control subjects (P < 0. 001). The serum ACE levels in the T2DM cases were significantly increased compared with those for the respective normal control subjects of each genotype (P < 0.0001) (Table 2, Fig. 3). We defined the 95% confidence interval of our normal control data for each genotype as the new normal range of serum ACE level (II type, 24.6 ~ 36.4; DI type, 38.9 ~ 48; and DD type, 48.3 ~ 66.7 IU/l), and compared the sensitivity of this new range with that of the conventional normal range (8.0 ~ 52 IU/l) for diagnosis and prognosis of T2DM (Table 1). Of 170 patients with T2DM, 62.3% had ACE activity of ≥ 52 IU/l. Of the 144 normal subjects, 72.9% had ACE activity of ≤ 52 IU/l (Table 3).
Fig. 2. Detection of ACE I/D polymorphism. M, 100-1000 bp DNA ladder; ID, single 335 bp product; DD, no product.
RESULTS Of the 144 normal control subjects, 54 had the II genotype (37.5%), 69 the DI type (47.9%), and 21 the DD type (14.6%). Of the 170 T2DM, 28 were of II genotype (16.5%), 99 were of DI (58.2%), and 43 were of DD (25.3%). The observed genotype distribution was in agreement with the HardyWeinberg proportion. There were significant differences in the genotype distribution between normal controls and T2DM cases (Table 1). There were no significant differences in the genotype distribution and I/D ratio between normal controls and T2DM cases (Table 2).
Table 1. Allele and genotype frequency of ACE gene insertion/deletion polymorphism in type 2 diabetes and control subjects T2DM (n=170)
Normal Controls (n=144)
Variable
N
%
N
%
P value*
DD genotype
43
25.3
21
14.6
0.02
ID genotype
99
58.2
69
47.9
0.07
II genotype
28
16.5
54
37.5