RESEARCH ARTICLE
Population Structure of Montastraea cavernosa on Shallow versus Mesophotic Reefs in Bermuda Gretchen Goodbody-Gringley1*, Chiara Marchini2, Alex D. Chequer3, Stefano Goffredo2 1 Bermuda Institute of Ocean Sciences, 17 Biological Lane, St. Georges, Bermuda GE 01, 2 Marine Science Group, Department of Biological, Geological and Environmental Sciences, University of Bologna, Via F. Selmi 3, 40126 Bologna, Italy, European Union, 3 Ocean Support Foundation, Suite 1222, 48 Par-la-Ville Road, Hamilton, Bermuda HM 11 *
[email protected]
Abstract
OPEN ACCESS Citation: Goodbody-Gringley G, Marchini C, Chequer AD, Goffredo S (2015) Population Structure of Montastraea cavernosa on Shallow versus Mesophotic Reefs in Bermuda. PLoS ONE 10(11): e0142427. doi:10.1371/journal.pone.0142427 Editor: Chaolun Allen Chen, Biodiversity Research Center, Academia Sinica, TAIWAN Received: April 1, 2015 Accepted: October 21, 2015 Published: November 6, 2015 Copyright: © 2015 Goodbody-Gringley et al. This is an open access article distributed under the terms of the Creative Commons Attribution License, which permits unrestricted use, distribution, and reproduction in any medium, provided the original author and source are credited. Data Availability Statement: All relevant data are within the paper. Funding: Funding for this work was provided by a Grant-in-Aid from BIOS and a Marco Polo Award from UNIBO to support C. Marchini. In-kind support was also provided by the Ocean Support Foundation to cover technical diving costs and boat fees. Competing Interests: The authors have declared that no competing interests exist.
Mesophotic coral reef ecosystems remain largely unexplored with only limited information available on taxonomic composition, abundance and distribution. Yet, mesophotic reefs may serve as potential refugia for shallow-water species and thus understanding biodiversity, ecology and connectivity of deep reef communities is integral for resource management and conservation. The Caribbean coral, Montastraea cavernosa, is considered a depth generalist and is commonly found at mesophotic depths. We surveyed abundance and size-frequency of M. cavernosa populations at six shallow (10m) and six upper mesophotic (45m) sites in Bermuda and found population structure was depth dependent. The mean surface area of colonies at mesophotic sites was significantly smaller than at shallow sites, suggesting that growth rates and maximum colony surface area are limited on mesophotic reefs. Colony density was significantly higher at mesophotic sites, however, resulting in equal contributions to overall percent cover. Size-frequency distributions between shallow and mesophotic sites were also significantly different with populations at mesophotic reefs skewed towards smaller individuals. Overall, the results of this study provide valuable baseline data on population structure, which indicate that the mesophotic reefs of Bermuda support an established population of M. cavernosa.
Introduction In recent years, coral reefs have undergone drastic decline due to numerous anthropogenic impacts to environmental conditions including eutrophication, disease, the loss of herbivory, and bleaching associated with ocean warming [1–4]. Currently, nearly 30% of the world's coral reefs are considered severely damaged, and close to 60% are in danger of being lost by 2030 [5]. These losses are particularly pronounced on shallow water reefs of the Caribbean, where the comprehensive study by Jackson et al. [1] reports an overall decline in coral cover of 59%, from an average of 33% before 1984 to 14.3% since 2005. Deep reef systems in the mesophotic zone (>30m), however, have not experienced the same trend, displaying relatively stable coral
PLOS ONE | DOI:10.1371/journal.pone.0142427 November 6, 2015
1 / 17
Population Structure of Mesophotic Coral in Bermuda
populations over time [6]. Yet, in comparison to shallow-water coral reefs, mesophotic reefs have received little attention [7]. Mesophotic coral ecosystems (MCE’s) are comprised of a variety of taxa, including sponges, macroalgae, and azooxanthellate corals, as well as light-dependent zooxanthellate corals that exist in zones between approximately 30m and 150m in tropical and subtropical zones [8–10]. These regions tend to exist in low energy deep fore-reef zones that are characterized by steep gradients in light and temperature [8]. Typically the depth at which light is reduced to 1% of the available surface light defines the lower limits of the mesophotic zone [11]. Previous technological limitations have presented major challenges to conducting research on MCE’s, resulting in limited understanding of the bathymetric and geographic extent of MCE’s and the biodiversity and community structure they support across regions. Even basic taxonomic and systematic characterization of these communities is unknown, underscoring the importance of establishing baseline information on species assemblages and the roles they play in ecosystem function [10, 12]. Analyses of size-frequency distributions can reveal characteristics of species populations as they represent stages of population growth and decline [13]. Population size structure results from variations in rates of colony growth, recruitment and mortality, and may indicate individual sensitivities to life-history processes and environmental variation. The life cycle of modular organisms such as scleractinian corals, however, is complicated by processes such as fragmentation, fission, fusion, and partial mortality, making the relationship between surface area and age difficult to interpret [14]. Yet coral colony surface area can be correlated to age if partial mortality is low, and thus characterizations of population size-frequency distributions may provide critical demographic information, particularly for massive, non-branching colonies [13, 15–19]. Describing coral populations in terms of population size-frequency, therefore, can provide a snap-shot of current reef condition and if monitored over time may serve as an indicator for stability or decline [17, 20]. The aim of this study is to provide baseline characterization of population structure for the dominant zooxanthellate coral at adjacent shallow and mesophotic reefs in Bermuda. As such, this study provides an initial assessment of mesophotic reef condition in relation to environmental conditions that vary with depth, such as temperature and nutrient levels. Fricke and Meischner [21] conducted the only comprehensive study of mesophotic reef composition in Bermuda using submersible video transect surveys. Their study found species diversity decreased drastically below 40m. Among the species found in these mesophotic zones include Agaricia fragilis, Stephanocoenia michelini, Madracis decactis, Scolymia cubensis, Montastraea cavernosa and Orbicella franksii, with M. cavernosa and O. franksii being the dominant representatives below 30m. Using in situ diver-led surveys we examine variations in colony density, surface area, percent cover and size-frequency distributions and provide baseline data on the population structure of M. cavernosa on mesophotic reefs in Bermuda.
Materials and Methods Ethics Statement Surveys for this study were conducted in public areas outside of any marine reserves and did not require approval or permitting. No specimens were manipulated or collected from reef sites in completing this study and care was taken to avoid contact with benthic substrata.
Site and Species Selection Located 32°N, 64°W, Bermuda’s sub-tropical coral reefs represent the northernmost reef system in the Atlantic. The shallow rim reefs of this pseudo-atoll encircle the platform, dropping
PLOS ONE | DOI:10.1371/journal.pone.0142427 November 6, 2015
2 / 17
Population Structure of Mesophotic Coral in Bermuda
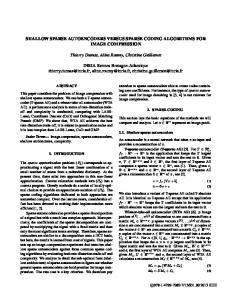
Fig 1. Survey Map. Survey locations on the south shore of Bermuda at shallow (10m; gray markers) and mesophotic (45m; black markers) sites. S1: Rita, 10m; D1: XL, 45m; S2: Coopers, 10m; D2: Coopers, 45m; S3: Tuckers, 10m; D3: Tuckers, 45m; S4: Spittal, 10m; D4: Spittal, 45m; S5: Devonshire, 10m; D5: Devonshire, 45m; S6: Hungry Bay, 10m; D6: Hungry Bay, 45m. doi:10.1371/journal.pone.0142427.g001
quickly to deep mesophotic reefs. Thus, deep reefs are easily accessible in Bermuda and corals surviving in these zones are both at their latitudinal and bathymetric limits. Furthermore, shallow water coral cover in Bermuda ranks among the highest in the Caribbean with an estimated cover of 38.6% [1]. Bermuda, therefore, is an ideal and important location in which to study coral community composition and connectivity across a depth gradient. M. cavernosa (Linnaeus, 1767) is a common reef building coral on fore reef slopes throughout the Caribbean and western Atlantic, extending from Bermuda to Brazil and the West African coast [22, 23]. M. cavernosa is considered an ‘extreme’ depth-generalist [9], as it inhabits depths from 3–100m across its geographical range [21, 24, 25]. Along its bathymetric distribution, M. cavernosa exhibits significant phenotypic plasticity in morphology, rates of respiration, and primary productivity [25–27], and is the only hermatypic species documented to survive below 70m in Bermuda [21].
Surveys Twelve coral surveys were performed between August 17th and December 28th 2014 to estimate abundance and surface area of M. cavernosa colonies between shallow and mesophotic reef sites in Bermuda (Fig 1). Six surveys were conducted at shallow sites (10m depth), and six were conducted at nearby mesophotic sites (45m depth). Site names, map labels, GPS coordinates, and survey dates are included in Table 1. Site locations were selected based on accessibility and
PLOS ONE | DOI:10.1371/journal.pone.0142427 November 6, 2015
3 / 17
Population Structure of Mesophotic Coral in Bermuda
Table 1. Survey Locations. Details of site locations surveyed including site map label (Fig 1), corresponding site name, depth (m), date surveyed, and GPS location (latitude and longitude). Map Label
Site Name
Depth (m)
Date
Latitude
Longitude
S1
Rita
10
17-Aug-14
N32° 21' 29.3"
W64° 38' 29.3"
S2
Coopers
10
17-Aug-14
N32° 20' 28.4"
W64° 39' 28.1"
S3
Tuckers
10
5-Sep-14
N32° 19' 57.7"
W64° 40' 16.5"
S4
Spittal
10
5-Sep-14
N32° 18' 42.3"
W64° 42' 53.4"
S5
Devonshire
10
28-Dec-14
N32° 18' 0.7"
W64° 44' 16.1"
S6
Hungry Bay
10
28-Dec-14
N32° 17' 8.5"
W64° 45' 26.1"
D1
XL
45
17-Aug-14
N32° 21' 58.0"
W64° 36' 5.3"
D2
Coopers
45
17-Aug-14
N32° 20' 29.6"
W64° 37' 47.2"
D3
Tuckers
45
5-Sep-14
N32° 19' 8.8"
W64° 39' 41.0"
D4
Spittal
45
5-Sep-14
N32° 18' 3.7"
W64° 42' 34.7"
D5
Devonshire
45
21-Dec-14
N32° 17' 36.5"
W64° 43' 48.9"
D6
Hungry Bay
45
28-Dec-14
N32° 16' 37.5"
W64° 44' 39.4"
doi:10.1371/journal.pone.0142427.t001
visual identification of reef structure at mesophotic sites. Paired shallow sites were selected as the nearest site encountered at 10m depth traveling up the reef slope perpendicular to the shoreline. At each site, all M. cavernosa colonies with greater than 50% of the colony located within 1m of either side of a 30m transect tape (60m2 total area per survey) were counted and largest surface diameter measured (to nearest cm). Diameter was chosen as a metric for ease of completing surveys at depth with minimal bottom time (maximum bottom time of 25 min.). Transects at each site were laid along the reef slope to ensure a constant depth, beginning at the closest non-living reef structure encountered upon reaching the benthos to which the tape could be secured. A colony was defined as any autonomous coral skeleton with living tissue as described by Meesters et al. [19].
Population Structure Analyses Density of M. cavernosa colonies (# of colonies 60m-2) met the assumptions of normality and equal variance and was analyzed by depth using a Student’s t-test. Mean colony diameter was used to calculate surface area of each colony using the following equation: surface area = 2π (diameter/2)2. Colony surface area was logarithmically transformed to reduce non-normality and heteroschedasticity and for each site, geometric mean (μ), standard deviation (SD), skewness (g1), and kurtosis (g2) were calculated. Mean colony surface area, standard deviation and skewness were compared by depth using the Student’s t-test (n = 6), and kurtosis was compared by depth using a Mann-Whitney U-test [28–30]. These statistics describe the shape of a distribution and allow comparisons between populations at different depths independent of colony surface area [13, 19]. The total surface area per 60m2 transect was also used to calculate percent cover of M. cavernosa (% cover 60m-2). Data was transformed to arcsine values and compared by depth using a Student’s t-test. Mean size-frequency distributions were generated for each depth zone (shallow and mesophotic) and compared with each other by a Kolmogorov-Smirnov test and to a normal distribution using a Shapiro-Wilk W test [31–33]. Additionally, size-frequency distributions within each shallow and mesophotic site were compared using a Kolmogorov-Smirnov test. Similarity of size-frequency distributions between shallow and mesophotic sites was calculated with the Spearman rank-correlation coefficient by dividing colony numbers into 10 surface area size classes based on a logarithmic scale (class borders were < 0.5, 1.0, 1.5, 2.0. 2.5, 3.0, 3.5, 4.0, 4.5,
PLOS ONE | DOI:10.1371/journal.pone.0142427 November 6, 2015
4 / 17
Population Structure of Mesophotic Coral in Bermuda
and >4.5 cm2). Correlation coefficients were not normally distributed, and group means were tested with the Mann-Whitney U-test. All analyses were computed using PASW Statistics 17.0. Size-frequency distributions within sites were also examined with a principal coordinate ordination (PCO) analysis based on Euclidean similarity, which generates a two-dimensional plot. PCO analysis is an equivalent to principal component analysis (PCA), but with more flexibility of resemblance measures [34] and allows spatial visualization of dissimilarities among sites and between depths. This analysis was performed using PRIMER version 6.
Nutrient and Temperature Analyses Seawater samples were collected at two shallow sites and two mesophotic sites during survey dives (Tuckers and Spittal). Four replicate samples were collected at each site. Analysis of nitrate (NO3), nitrite (NO2), and silicate (SiO4-2) were conducted at BIOS with a Seal Analytical AA3 continuous flow analyzer. Concentrations of nitrogen (NO3 + NO2) and silicate at each site met the assumptions of normality and equal variance and were analyzed by depth using Student’s ttests (n = 4 per site). Seawater temperature readings were recorded at each of the surveyed shallow and mesophotic sites between July 2014 and January 2015 using a Shearwater Petrel dive computer. Each site was visited twice during this time period for a total of 12 paired temperature readings. Mean temperatures were compared by depth using a Student’s t-test (n = 6).
Results Distribution Parameters Table 2 gives the geometric mean surface area, skewness, kurtosis, maximum colony surface area, standard deviation, the probability that the sample is from a normal distribution, and the sample size at each site. Each parameter is also given for all shallow sites and all mesophotic sites combined.
Colony abundance, surface area and percent cover The mean density of colonies varied significantly by depth (p = 0.002, Students t-test, F = 0.106, n = 6), with higher colony density at mesophotic sites compared with shallow sites Table 2. Distribution Parameters. M. cavernosa population distribution parameters including site name, depth (m), geometric mean surface area (μ; cm2), skewness (g1), kurtosis (g2), standard deviation (SD), maximum colony surface area (95%; cm2), the probability that the populations is from a normal distribution (Pnorm), and the sample size (n) for each site surveyed and for all shallow sites and all mesophotic sites combined. Depth
μ
g1
g2
SD
95%
Pnorm
n
Rita/XL
10
2508
-0.638
0.497
0.834
16343
0.042
26
Coopers
10
1731
0.389
-0.369
0.518
8836
0.012
12 21
Site
Spittal
10
1503
-0.535
-0.281
0.457
5655
0.006
Tuckers
10
1991
-1.904
4.283
0.737
5284
0.000
6
Devonshire
10
1808
-0.154
-1.161
0.555
7697
0.005
29
Hungry Bay
10
2145
0.046
-1.052
0.617
13586
0.010
31
Rita/XL
45
522
-0.755
0.992
0.687
7697
0.009
62
Coopers
45
330
-0.763
0.630
0.555
2389
0.010
66
Spittal
45
639
-0.304
-0.178
0.709
3927
0.043
36
Tuckers
45
349
-1.088
0.945
0.767
3041
0.031
58
Devonshire
45
322
-0.260
0.004
0.749
2513
0.152
96
Hungry Bay
45
441
-0.614
0.273
0.719
2513
0.078
108
Shallow
10
1933
-0.499
0.452
0.620
16343
0.000
125
Deep
45
434
-0.627
0.369
0.713
7697
0.000
426
doi:10.1371/journal.pone.0142427.t002
PLOS ONE | DOI:10.1371/journal.pone.0142427 November 6, 2015
5 / 17
Population Structure of Mesophotic Coral in Bermuda
(Fig 2A). Colony surface area also varied significantly between depths (p 0) or flatter than normal (platykurtic, g2 < 0). Kurtosis did not vary significantly by depth (Fig 3; p = 0.150, MannWhitney U-test), where the average kurtosis was 0.45 and 0.37 for shallow and mesophotic sites, respectively.
Size-Frequency Distributions Mean size-frequency distributions for shallow versus mesophotic sites are given in Fig 4. Logarithmically transforming colony surface area data greatly improved normality. Mean distribution patterns from shallow and mesophotic sites were bell-shaped, yet differed significantly from a normal distribution (Table 2; p