ORIGINAL PAPER
Pore Structure of the Cys-loop Ligand gated ion channels Nathan L.Absalom1,2, Peter R. Schofield1,3 and Trevor M. Lewis1*
1
School of Medical Sciences, University of New South Wales, Sydney, NSW 2052, Australia Garvan Institute of Medical Research, 384 Victoria St, Darlinghurst, NSW 2010, Australia. 3 Prince of Wales Medical Research Institute, Barker Street, Randwick 2031, Australia 2
*Address correspondence to Trevor M. Lewis, School of Medical Sciences, The University of New South Wales, Sydney, NSW, 2052, Australia. Fax: (61) 2 9385 1099; E-mail:
[email protected]
Published in Neurochemical Research (2009) 34:1805–1815 DOI 10.1007/s11064-009-9971-2 Abstract The Cys-loop receptor family of ligand-gated ion channels play a key role in synaptic transmission in the central nervous system of animals. Recent advances have led to the elucidation of two crystal structures of related prokaryotic ligand-gated ion channels and the electron micrograph derived structure of the acetylcholine receptor from Torpedo mamorata. Here, we review the structural and biochemical data that form our understanding of the structure of the channel pore. We introduce original data from the glycine receptor using the substituted-cysteine accessibility technique and show that while the helical structure of the segment that surrounds the channel pore is generally agreed, the location of the channel gate, the pore diameter and the structure that forms the entry to the channel pore are likely to differ between receptors. The fundamental structural differences between anion and cation selective receptors and how these differences are related to the pore structure are also considered. Keywords: ligand-gated ion channel, M2, pore structure, substituted-cysteine accessibility method, glycine receptor
Introduction Fast synaptic transmission in the nervous system of animals is mediated by ligand-gated ion channels (LGICs), where the receptor for the neurotransmitter and the ion channel are combined in the same transmembrane protein. These allosteric proteins respond to the binding of the ligand with a series of conformational changes that result in opening of the ion channel to allow the selective flow of ions across the cell membrane. The most prominent group of LGICs is the Cys-loop superfamily, named after the disulfide bridge in a loop of 13 amino acids that is highly conserved across members of the family. In the mammalian nervous system, the Cys-loop receptors include the nicotinic acetylcholine receptor (nAChR) and serotonin receptor (5-hydroxytryptomine receptor type 3; 5-HT3) that are selective for cations, and the glycine receptor (GlyR) and the -aminobutyric acid type-A receptor (GABAAR) that are selective for anions. The function of each Cys-loop LGIC relies upon two key characteristics: specificity for the recognition of the neurotransmitter that activates the receptor and the ion selectivity of the channel pore.
2
The Cys-loop receptors are all proposed to be pentameric complexes, with the subunits arranged to form the central ion-conducting pore. Each subunit is predicted to have a similar topology, with a large N-terminal extracellular domain (ECD) followed by four transmembrane domains (M1-M4), a large intracellular loop between M3 and M4, and a short extracellular C-terminus. Until recently, the quaternary structure of these subunits in the assembled receptor has largely been inferred from the cryo-electron microscopy studies of Unwin and colleagues on the nAChR from the electric organ of Torpedo marmorata (1). This has been aided by the crystal structure of the acetylcholine binding protein (AChBP) (2) that has been co-crystallised with agonists and antagonists (3, 4) and is homologous to the ECD of the nAChR. From the structure of the AChBP (2), the homologous ECD of each subunit has been described as being comprised of -strands arranged in a -sandwich, with the ligand binding pocket occurring at the interface between adjacent ECDs. Several loops that connect -strands contribute to the interface with the transmembrane domain (TMD) and are proposed to have a key role in transduction of the ligand binding event to cause channel opening (5). The TMD of each subunit is comprised of four helices (M1-M4) and it is the second, the M2 region, from each subunit that contributes to the formation of the centrally located channel pore. Members of the Cys-loop LGIC superfamily have been identified in prokaryotes and the animal kingdom, but not yet in plants, fungi, alveolates or other eukaryotes. The functional role of these receptors in prokaryotic organisms is not well understood, but they are broadly thought to function as chemotaxis receptors (6). In animals, the physiological role of the receptor depends on the resting potential of the cell and the equilibrium potential for permeant ions. Generally the cationic and anionic channels perform the directly opposite physiological roles of excitation and inhibition, respectively. Sequence analysis demonstrates that eukaryotic members of the LGIC superfamily have more in common with themselves than prokaryotic members, however
Absalom et al. 2009
the cation (nAChR and 5-HT3AR) and anion (GlyR and GABAAR) selective subunits have evolved along two clear monophyletic branches (6). So while the mammalian receptors are related and share many common structural features, the comparison of anion and cation selective receptors requires care and an understanding of the differences. This paper will describe the current understanding of the pore structure and highlight some of the differences between the anion and cation selective receptors. Structure of the Channel Pore The inherent complications in crystallizing membrane-bound proteins have meant that to date there has been no publication of a crystal structure of a mammalian LGIC. However, cryo-electron microscopy studies of the nAChR from the electrical organ of Torpedo marmorata (1, 7) and the crystal structures of prokaryotic LGICs derived from the organisms Erwinia chrysanthemi (ELIC) and Gloebacter violaceus (GLIC) have provided the details that underlie our current knowledge of the pore structure (810) (Figure 1). The nAChR, ELIC and GLIC are all cation selective channels. At present, however, there are no published structures of any anion selective LGICs. As there are differences in sequence and function between the cation and anion selective channels, it is likely there will be subtle differences in the pore structures as well. The refined structure of the Torpedo nAChR was determined in the absence of acetylcholine (7), and as such represents a closed state of the receptor. When viewing the pore region of the Torpedo nAChR structure from the synaptic cleft, the transmembrane helices (M1-M4) arrange in a near-perfect five-fold symmetrical arrangement around the central ion-conducting pore (7). The inner M2 helices that line the pore tilt radially inwards towards the central axis until they reach the centre of the membrane, producing a funnel or a V-like structure, widest at the extracellular end (7). These M2 helices that shape the central conducting path are 40 Å long and are slightly kinked at the top of the helix (-Pro 23′) and again halfway along at -
Absalom et al. 2009
3
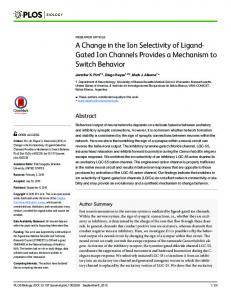
Figure 1. X-ray crystal structure of the LGIC from (A) Erwinia chrysanthemi (ELIC), the electron micrograph structure from (B) Torpedo mamorata nAChR and the X-ray crystal structure of the LGIC from (C) Gloebacter violaceus (GLIC). All structures are shown as a ribbon cartoon of the alpha-carbons in the peptide backbone. The M2 helix that lines the channel pore is depicted as a black ribbon. In the upper part of each panel only two subunits of each receptor is shown for clarity. The approximate position of the cell membrane is indicated with the outside (Out) and inside (In) surfaces. In the lower part of each panel the transmembrane helix bundles for each receptor is shown, looking from the extracellular side down the axis of the pore.
Leu 9′ (using the prime numbering system that facilitates comparison of M2 residues between family members (11); see Figure 2). The narrowest region of the pore is near the middle of the M2 at -Leu 9′ to -Val 13′, where the diameter of this closed state structure is close to 6 Å (7). By comparison, the open channel pore diameter has been estimated to be at least 7.4 Å in Rana pipiens muscle (12) and Torpedo california (13), and 8.4 Å in mouse muscle (14), by determining the size of the largest ion that is able to permeate the channel pore. Thus, in the closed state of the pore, the barrier to ion permeation is not formed by occluding the pore, but by forming a hydrophobic barrier between -Leu 9′ to -Val 13′, making it energetically unfavourable for ions to pass (7). The recently discovered prokaryotic GLIC is a proton-activated ion channel that does not desensitize after prolonged exposure to agonist (15). By crystallizing the channel at a pH of 4 and 4.6, where the channel would normally conduct cations, the resultant X-ray structure is thought to be that of a prokaryotic LGIC in an open state (9, 10). In contrast, the ligand for the ELIC channel is unknown and the X-ray structure derived from these crystals is thought
to represent a prokaryotic LGIC in a closed state (8). The pore of the ELIC and GLIC resemble mammalian LGICs with a symmetrical pentameric arrangement of M2 helices surrounding the central ion channel pore. However, within each single subunit of the ELIC and GLIC structures the four helices (M1-M4) are packed more tightly compared with the nAChR (Figure 1. This raises the question as to whether this difference is due to the crystallization of the ELIC and GLIC compared to the membrane arrays of the nAChRs used in the cryo-electron microscopy studies, or if it is a true difference in structure. The closed channel of the ELIC differs from the nAChR in that the helices form a straight cylindrical pore rather than the funnel or Vshape of the nAChR (8). On the extracellular side, the ELIC channel pore is interrupted by bulky side chains that restrict the channel diameter to approximately 2Å between residues Leu 9′ and Phe 16′. The model suggests that water would be unable to access the closed pore from the extracellular side. The pore then extends toward the intracellular side with a hydrophilic channel approximately 6Å wide (8).
4
Figure 2. Sequence alignment of the M2 region of CysLoop LGICs. Anion selective (human GlyR and rat GABAAR), cation selective (Torpedo and mouse nAChR1, mouse 5-HT3A) and prokaryotic (ELIC, GLIC) receptor sequences are grouped together. The subunits shown have either published structures or results from SCAM studies. The residues that form the selectivity filter (-2′ to 0′), the outer ring of charge (19′) and the central leucine (9′) are highlighted. Cyt, cytoplasmic side of the membrane; Ext, extracellular side of the membrane.
The pore of GLIC is similar to the nAChR in that it resembles a funnel or V-shape starting with a 12Å outside diameter and reducing to an inner diameter of between 5 and 6Å. The M2 helices are tilted with respect to the membrane to create this effect, with outer hydrophobic side chains facing the helix interfaces and inner polar side chains facing the pore (9, 10). A ring of charged glutamate residues (Glu 2′) surrounds the narrowest region of the GLIC channel pore and is thought to interact with ions passing through. Unlike the ELIC and nAChR channel pore, there is no hydrophobic barrier around the 9′ position preventing ion permeation, consistent with the hypothesis that this structure is in the open state. The M2 Helix and its environment The M2 helix of each subunit is surrounded by the M1 and M3 helices that isolate it from the hydrophobic membrane and one face of the M2 helix contributes to the channel pore. A sequence alignment of the M2 region from selected subunits of anion and cation selective LGICs is show in Figure 2. When comparing the GlyR1 subunit to other LGICs, there is 6070% sequence identity with the GABAAR and GABAAR subunits, while there is only a 20-
Absalom et al. 2009
25% sequence identity with the cation selective channels nAChR1 and 5-HT3AR. The subunits of anion selective receptors exhibit a M2 region that is dominated by polar residues such as serines, threonines and glycines along the entire length, with the exception of the conserved Leu 9′ and flanking Val 8′ in the middle of the helix. In the cation selective receptors, the polar residues are confined to the intracellular half of the M2, below the conserved Leu 9′, with the extracellular half of the M2 dominated by large hydrophobic residues. One key residue is a proline (Pro -2′) at the intracellular end of the M2 region that is conserved in the GlyR and GABAAR2 subunits, but is absent in the nAChR or 5HT3AR. The minimum pore diameter in the open state of the GlyR and GABAAR is experimentally estimated to be between 5.3 Å to 6 Å (16-19), while in the nAChR and 5HT3R it is estimated to be larger with a value between 7.4 Å to 8.4 Å (12-14, 20). Insertion of the Pro -2′ into the sequence of the nAChR7 together with Gly-1′Ala and Val13′Thr resulted in a change from cation-selective to anionselective receptors (21). The converse is true in the GlyR1. Deletion of just the proline (Pro 2′) in the GlyR1 caused a reduction in anion selectivity and increased the pore diameter to 6.9 Å (22). The GlyR1 double mutant Pro-2′, Ala-1′Glu further increases the pore diameter to 9.7 Å (23). From this data, it has been hypothesized that the presence or absence of the Pro -2′ results in alterations in the local geometry of the structure, changing either the size of the pore or the electrostatic interactions of the peptide backbone with the ion flow (21, 24). In either case, this proline residue is likely to alter the pore structure of the anion-selective channels compared to the cation-selective channels. This needs to be taken into consideration when homology models of the pore from anion-selective channels are derived from the cation-selective channel structures. In the absence of any X-ray crystal or electron structure for the anion-selective channels, other methods have been employed to determine the similarities and differences in the M2 region of the various channels. The first and most
Absalom et al. 2009
important of these comes from the substitutedcysteine accessibility method (SCAM), a technique used for scanning ion channel structures to identify water-accessible surfaces. This technique has been applied to the M2 region of nAChR (25-28), GABAAR (29, 30), 5-HT3AR (31, 32) and GlyR (33) in previously published work. It is timely to reassess this data in the light of the new crystals structure. We also present here original experimental data using the SCAM technique to probe the M2 region of the GlyR. The SCAM technique relies on the reaction of the sulfhydryl group of a cysteine sidechain with the thiosulfonate bond of a methane thiosulfonate (MTS) reagent. This reaction results in the creation of a disulfide bond with the MTS reagent sidechain attached. This reaction occurs 109 times faster with oxidised – S- groups than reduced –SH groups (34). A set of receptors are created where each individual amino acid in the pore region is substituted to a cysteine. When in the hydrophilic environment of the channel pore, the cysteine residue occurs as a –S- group available for modification. When facing the hydrophobic membrane or protein interior, the cysteine residue occurs as a –SH group. Therefore, the individual receptors with mutated cysteines that react to the MTS reagents are inferred to have their original amino acid sidechains facing the interior of the channel pore (25). Experimental Procedures Mutagenesis and expression of human GlyR 1 subunit cDNA The cDNA encoding the wild-type (WT) human 1 subunit of the GlyR was subcloned into the pCIS expression vector. Site-directed mutagenesis was performed using the oligonucleotide-directed polymerase chain reaction (PCR) (15) technique and confirmed by DNA sequencing of the complete plasmid. The residues 1′ to 17′ in the M2 region were individually mutated to a cysteine in the wildtype GlyR 1 subunit.
5
Plasmid DNA encoding wild-type or mutated 1 subunits of the human GlyR was transiently transfected into exponentially growing 293 cells (adenovirus transformed human embryonic kidney cells; ATCC CRL 1573) along with cDNA for the CD4 protein (2:1, 1 GlyR:CD4) using the 3% CO2, calcium phosphate transfection technique. After 24 hr exposure to precipitate, cells were washed with culture medium (Eagle’s minimum essential medium in Hank’s salts supplemented with 2 mM glutamine and 10% fetal calf serum). Patchclamp studies were performed on homopentameric 1 GlyRs 24-72 hours after washing the cells. Transfected cells were identified by labelling with CD4 polystyrene beads (Dynabead M-450, CD-4; Invitrogen, Mount Waverly, Australia). Electrophysiology Whole-cell patch clamp experiments were performed at room temperature (22.5±0.3oC). The cells were continually superfused with an external bathing solution containing: 140 mM NaCl, 5 mM KCl, 2 mM CaCl2, 1 mM MgCl2, 10 mM HEPES and 10 mM glucose, adjusted to pH 7.4 with 1 M NaOH. Glycine concentrations were made up in the external bathing solution and were applied directly to the cells with a modified U-tube. Patch pipettes were fabricated from borosilicate glass capillaries and fire polished to give a tip resistance of 2-6 M. Pipettes were filled with an intracellular solution containing: 120 mM CsCl, 20 mM TEACl, 1 mM CaCl2, 2 mM MgCl2, 10 mM HEPES and 11 mM EGTA adjusted to pH 7.2 with CsOH. Whole-cell currents were recorded at a holding potential of –50 mV using an Axopatch-1D amplifier and digitised using pClamp 6.0 software and a Digidata 1200 ADC interface (Molecular Devices, Sunnyvale, CA, USA). Concentration-response curves were constructed from the peak current response to the application of a range of agonist concentrations, with a minimum of 1 minute between successive applications.
6
Sulfhydryl reagents and reactions We used the charged methane thiosulfonate (MTS) derivatives, 2-sulfonatoethyl methanethiosulfonate (MTSES; negatively charged) and 2-(trimethylammonium)ethyl methanethiosulfonate (MTSET; positively charged) (Toronto Research Chemicals Inc., North York, Canada). Stock solutions of 100 mM MTSES and MTSET in distilled water were aliquotted into screw-cap microcentrifuge tubes and rapidly frozen in an ethanol / dry ice mix before storage at –20oC. For each application of MTS reagents, a new aliquot was thawed, diluted in bathing solution to the working concentration and used within two minutes. After recording a concentration response curve prior to MTS reagent addition, either 2.5 mM MTSET or 10 mM MTSES was applied directly to the cell for 1 min. A second concentration response curve was then recorded. Data analysis and statistics Concentration-response data were plotted on semi-logarithmic axes and fitted using a nonlinear least squares routine (Origin, OriginLab, Northampton, MA, USA) with the empirical Hill equation: I = Imax ([A]nH/([A]nH + EC50nH)) Where I is the peak whole cell current recorded following application of a range of concentrations of the agonist, [A]; Imax is the estimated maximum current, EC50 is the glycine concentration required for a half-maximum response and nH is the Hill co-efficient. The change in EC50 (EC50) and the decrease in the maximum current (Imax) were determined for each experiment and expressed as a ration in the following way: EC50 = log(EC50(after)/EC50(prior)) Imax = (Imax(after)/Imax(prior)) – 1 . 100% The subscripts ‘prior’ and ‘after’ indicate the values obtained prior and after application of MTS reagents, respectively. The ratio of the EC50 values is log transformed (EC50) so that any shift to the left or the right in the EC50 is effectively expressed as a linear distance on a
Absalom et al. 2009
log scale and the shifts can be meaningfully compared between mutants that have different initial EC50 values. The values obtained were averaged over several experiments. Statistics were performed on the EC50 and Imax values using a one-way ANOVA with Dunnett’s posthoc test. Results and Discussion SCAM on the GlyR All residues in the M2 region of the GlyR1 subunit cDNA were individually mutated to cysteine and the cDNAs were transfected into HEK293 cells in culture for patch clamp electrophysiological recordings. Concentrationresponse curves were constructed from the peak whole-cell currents recorded in response to the application of a range of glycine concentrations. Saturating concentrations of MTSET (2.5 Mm) or MTSES (10 mM) were added for one minute in the absence of glycine to determine the accessibility of the cysteines in the closed state. Concentration-response curves were again constructed from peak whole-cell currents recorded in response to glycine concentrations and compared to the concentration response curve prior to MTS reagent addition (Figure 3, Table I). The cysteine substitutions at positions Leu 9′, Met 11′, Thr 13′, Gln 14′ and Ser 15′ of the GlyR all displayed some change in the concentration-response curves following reaction with MTSET or MTSES. These residues are all in the extracellular half of the M2 region and plotting them on a simple helical-wheel (Figure 4) it is clear that they don’t occur on the same face of the helix. A sequence alignment of the GlyR1 and nAChR1 M2 regions predicts that Gly 2′, Thr 6′, Leu 9′, Thr 13′ and Gly 17′ in the GlyR1 would be accessible to the channel pore, based upon the Torpedo nAChR structure. However, no change is observed for Gly 2′ and Thr 6′ in the closed state, both of which occur below the conserved Leu 9′. Surprisingly, there is also no significant change observed in the case of Gly17′Cys. A reduction in the maximum current is observed in the cases of the Leu9′Cys and Thr13′Cys receptors after reaction with
Absalom et al. 2009
Figure 3. Concentration-response curves of Leu9′Cys, Met11′Cys, Thr13′Cys, Gln14′Cys Ser15′Cys and WildType receptors to glycine prior to (closed circles) and after (open circles) 10 mM MTSES addition. In each cysteine substituted receptor there was a significant decrease in the maximum current, while the wild-type (WT) receptor showed no significant changes in the concentrationresponse curve. Points are mean ± s.e.m for n ≥ 3 experiments. EC50 is estimated from fitting the Hill equation (continuous curve).
MTS reagents, which is significant in the case of MTSES and for modification of Leu9′Cys by MTSET. This is consistent with the MTS reagents reacting with the cysteine and the sidechain of the MTS reagent now being located within the channel pore, creating a steric or electrostatic hindrance to ion flow and reducing the maximum current. Previously, the residues Gly 2′ and Thr 6′ have been shown to be accessible in the open state of the GlyR1 subunit channel (35). Together, these results suggest Gly 2′, Thr 6′, Leu 9′ and Thr 13′ are all facing the channel pore, consistent with the helical model of the M2 region (Figure 4) and with access occluded beyond the central Leu 9′ residue in the closed state.
7
The mutants Met11′Cys, Gln14′Cys and Ser15′Cys are also accessible to MTS reagent modification, with a reduction in the maximum current observed for each of these receptors. The reduction in the Imax is significant for Met11′Cys (54%), Gln14′Cys (31%) and Ser15′Cys (32%) following modification by MTSES. An alignment of Met 11′, Gln 14′ and Ser 15′ with the M2 region of the Torpedo nAChR predicts that these residues are facing the exterior of the channel pore or towards residues on the adjacent M2 region. Both the GlyR and the GABAAR are thought to have water-filled cavities behind the inner M2 helices, where ethanol can modulate receptor function, with the residue at the 15′ (GlyR1 Ser 15′) position implicated (36, 37). This water-filled cavity is possible in the GlyR and GABAAR because of the polar nature of the M2 helix. Thus, it is likely the Met 11′, Gln 14′ and Ser 15′ residues are freely accessible to M2 reagents from this water-filled cavity as opposed to the structure being non-helical at this point. By comparison, the M2 helix of the nAChR1 is hydrophobic in the extracellular half and so lacks a water-accessible pocket (7). The reaction of MTS reagents with these residues also causes changes in the EC50, with an increase observed for Met11′Cys but a decrease for Gln14′C and Ser15′Cys. One possibility for Met11′Cys might be that the MTS modified cysteines impair the mobility of the M2 helix, thus reducing the ability of the M2 helix to move into the open pore conformation. This reduction in open probability could also account for the decrease in Imax that is also observed. The EC50 results for Gln14′Cys and Ser15′Cys, however, are not able to be explained by a similar mechanism. Our results with the GlyR1 show MTSET is able to react with Leu9′Cys and cause a significant (52%) decrease in Imax (Table I). Thus, MTSET was able to penetrate the closed GlyR pore to the same extent as MTSES, as Leu9′Cys was able to react with both reagents. No further residues on the intracellular side beyond Met 11′ showed any significant reaction with MTS reagents. This suggests the channel gate occurs at or below the Leu 9′ in the
8
GlyR1. The overall reactivity of cysteine substitutions in the extracellular half of the GlyR M2 was more moderate with MTSET compared to MTSES. There were a number of residues where MTSET caused a 20% reduction in Imax, but this was not statistically significant. The greater impact of MTSES on receptor function for those residues that were reactive may in part be explained by the negative charge reducing the permeation of Cl– anions, in addition to possible steric hinderance. By comparison, the positively charged MTSET would favour Cl– permeation and so only steric hinderance would likely influence the Imax. The converse of this has been shown in the cation selective nAChR, where the positively charged MTSES causes a significant change in Imax in a greater number of cysteine substituted M2 residues than MTSES (23). Implication of SCAM Results on Channel Structure The Torpedo nAChR and ELIC structures are both thought to be in a functionally closed state, yet they predict quite different accessibility profiles of the pore to ions. The extracellular half of the ELIC pore is occluded by bulky, hydrophobic sidechains, with extracellular ions probably prevented from accessing the pore beyond Phe 20′ (7, 8). In the Torpedo receptor structure, extracellular ions would be able to access the pore further, but not beyond the “hydrophobic girdle” at Val 13′ (7). It has been suggested that the Torpedo structure is a “functionally closed but structurally nearly open conformation” (10). The ELIC structure is certainly at odds with the SCAM data in the closed state of receptors. For example, in the nAChR MTS reagents are able to access the closed pore and react with substituted cysteines as far as Thr 2′ (26, 27), which is certainly further than would be expected from the ELIC structure. It is also further than predicted from the Torpedo structure, but the desensitized state (after exposure to agonist for minutes) shows accessibility only as far as Leu 9′ (28). Functional data also indicates that the extracellular half of the M2 region is a more dynamic structure than the lower, constricted
Absalom et al. 2009
part of the channel. This is demonstrated by analysis of a series of mutations in the M2 region of the nAChR subunit, using the rateequilibrium free energy relationship to generate a statistical value () that identifies whether the site of the mutations is temporally closer to the open state or the closed. The results indicated that the extracellular half of the M2 undergoes a conformational change ahead of the intracellular half (38). A related behaviour has been described in the M2 region of the subunit of the GABAAR, where SCAM results suggest that the extracellular half of the M2 region is a more mobile structure than the lower half (39), which appears to be more tightly packed. This at least raises the possibility that the extracellular half of the M2 could occur in more than one conformation, even in the closed state, and that these are represented by the Torpedo and ELIC structures. This is with the caveat, however, that the ELIC does have a more tightly packed arrangement of the transmembrane helices compared to the Torpedo structure. The point at which molecules are excluded from the channel pore in the closed state is commonly referred to as the gate. The results from SCAM studies have been used to infer the location of the gate by analysing the residues accessible to MTS reagents in the absence and then presence of agonist. As alluded to above, the gate in the nAChR appears to be between Gly 2′ and Thr 2′ in the closed state (26, 27), but extending as far as Leu 9′ in the desensitized state (28). The gate in both the GlyR and GABAAR is also likely to be further towards the intracellular pore than the “hydrophobic girdle” found in the Torpedo structure. In the GlyR and GABAAR the 13′ residue in the 1 subunit is a hydrophilic threonine rather than a hydrophobic valine and so would not contribute to any hydrophobic interaction. In the GlyR, the most intracellular residue that is accessible to modification in the absence of glycine is Leu 9′. In the GABAAR reaction of MTSEA with the 1Thr6′Cys residue in the absence of agonist caused a change in maximum current, although the cysteine modification with p-
Absalom et al. 2009
9
Table I. Substituted-cysteine accessibility method on the closed state of the GlyR MTSES
MTSET
Receptor
EC50 (M)
nH
Imax (nA)
Imax (%)
EC50 (log)
n
WT Val1′Cys Gly2′Cys Leu3′Cys Gly4′Cys Ile5′Cys Thr6′Cys Thr7′Cys Val8′Cys Leu9′Cys Thr10′Cys Met11′Cys Thr12′Cys Thr13′Cys Gln14′Cys Ser15′Cys Ser16′Cys Gly17′Cys
31.8 ± 4.9 90.1 ± 29 135 ± 24 6.64 ± 1.3 102 ± 17 2.60 ± 0.28 48.7 ± 15 142 ± 8.7 1.5 ± 0.2 14.3 ± 2.8 252 ± 62 48.5 ± 9.9 10.6 ± 0.9 94.0 ± 22 43.4 ± 15 103 ± 35 181 ± 90 249 ± 95
3.6 ± 0.4 3.4 ± 0.3 3.4 ± 0.3 2.1 ± 0.3 3.5 ± 0.3 2.9 ± 0.3 1.5 ± 0.1 4.3 ± 0.4 3.9 ± 0.6 2.3 ± 0.6 1.6 ± 0.1 2.4 ± 0.2 2.4 ± 0.2 1.4 ± 0.1 1.6 ± 0.2 1.8 ± 0.1 1.9 ± 0.1 1.4 ± 0.2
4.9 ± 3.1 5.2 ± 2.2 6.8 ± 2.0 7.8 ± 0.6 4.4 ± 1.5 5.4 ± 1.3 2.3 ± 1.3 10.8 ± 2.3 3.2 ± 0.9 0.3 ± 0.05 4.3 ± 1.1 3.3 ± 0.6 6.9 ± 1.7 3.0 ± 0.8 6.0 ± 0.7 6.2 ± 0.9 4.1 ± 1.0 8.0 ± 1.4
1±7 13±7 1±5 15±1 2±3 11±6 4±7 20±6 20±5 34±16* 9±4 54±6** 5±6† 45±9** 31±6* 32±8* 10±8 16±3
-0.146±0.084 -0.098±0.071 -0.111±0.072 -0.143±0.024 -0.112±0.025 -0.254±0.145 -0.178±0.068 -0.105±0.050 -0.004±0.050 0.069±0.098 -0.151±0.048 0.356±0.239* -0.513±0.128 0.047±0.144 -0.513±0.027 -0.736±0.112* -0.112±0.063 -0.040±0.112
4 3 4 4 4 4 3 4 4 3 4 3 4 3 4 5 4 4
Imax (%) 9±9 11±9 8±4 9±2 7±11 14±6 4±2† 15±4 13±11 52±6* 20±3 25±12 15±6 32±6 40±17 10±3 13±14 21±3
EC50 (log)
n
-0.035±0.039 -0.110±0.072 -0.458±0.099* 0.021±0.123 -0.079±0.039 -0.121±0.041 -0.001±0.123 -0.061±0.027 -0.040±0.114 0.004±0.068 -0.140±0.023 0.317±0.095 -0.114±0.025 -0.137±0.013 -0.563±0.224* -0.403±0.104 -0.182±0.144 -0.210±0.055
3 3 4 4 4 4 3 4 3 3 4 4 4 4 4 4 4 3
Results for the GlyR1 with 10mM MTSES or 2.5mM MTSET applied in the absence of glycine. Shown are the EC50, hill coefficient nH and maximum current (Imax) derived from concentration-response curves. The percentage decrease in maximum current (Imax) and the log of the EC50 ratio (EC50) after addition of MTSES or MTSET are shown along with the corresponding number of experiments (n). Values are shown as the mean ± S.E.M. †In two cases, there was a small increase in the average Imax. Statistical analysis was performed for the Imax and EC50 with one-way ANOVA and Dunnett’s post-hoc t-test. * P