Porosity and Permeability Estimation using Neural Network Approach from Well Log Data a b*
Akhilesh K. Verma , ,
[email protected] and a c b a Burns A. Cheadle , Aurobinda Routray , William K. Mohanty and Lalu Mansinha a Department of Earth Sciences, Western University, London, Ontario, Canada b Department of Geology and Geophysics, Indian Institute of Technology Kharagpur, India c Department of Electrical Engineering, Indian Institute of Technology Kharagpur, India
Summary In recent years, artificial intelligence techniques, and neural networks in particular, have gained popularity in solving complex nonlinear problems. Permeability, porosity and fluid saturation are three fundamental characteristics of reservoir systems that are typically distributed in a spatially non-uniform and non-linear manner. In this context, porosity and permeability prediction from well log data is well-suited to neural networks and other computer based techniques. The present study aims to estimate formation porosity and permeability from digital well log data using an artificial neural network (ANN) approach. A representative case study from the Alberta Deep Basin is presented. Five well log responses (Gamma Ray Log (GR), Deep Resistivity (RD), Formation Density (DEN), Neutron Porosity (PHIN) and Density Porosity (PHID)) are used as inputs in the ANN to predict porosity and permeability. Core porosity and permeability are used as target data in the ANN to test the prediction. The accuracy of the ANN approach is tested by regression plots of predicted values of porosity and permeability with core porosity and permeability respectively. Excellent matching of core data and predicted values reflects the accuracy of the technique. ANN is a fast and accurate method for the prediction of reservoir properties and could be applied in reservoir modeling and characterization. Key words: Artificial intelligent techniques, neural networks, reservoir characterization, porosity, permeability, well logging.
Introduction A petroleum reservoir is a heterogeneous geological system with large intrinsic complexity. Reservoir porosity, permeability and hydrocarbon saturation are directly related to the storage capacity, fluid flow capacity and amount of hydrocarbon pore volume respectively. Problems related to reservoir characterization are difficult due to natural heterogeneity, uncertainty and nonlinearity in these reservoir parameters. Consequently, it is typically very difficult to explicitly quantify spatial relationships of variable reservoir properties. Computer-based intelligence methods (e.g. Neural network, Fuzzy logic, Genetic algorithm etc.) can easily handle this type of complicated problem very accurately (Ouenes, 2000; Nikravesh et al., 2001; Nikravesh et al., 2003). In the last two decades, several researchers have worked on reservoir characterization problems from different perspectives using soft computing methods (Nikravesh et al., 2001). From the conclusions of those studies, it is evident that soft computing yields reservoir characterization results somewhat superior to conventional methods because inherent uncertainties are not incorporated explicitly into conventional hard computing techniques (Nikravesh et al., 2003). Neural network, fuzzy logic and neuro-fuzzy techniques are generally used by different workers for the same purpose (Fung et al., 1997; Ouenes, 2000; Nikravesh et al., 2001). Artificial neural networks (ANN) are analogous to biological nervous systems and consist of input layer, hidden layers and output layer (Fausett 1994; Haykin, 1999). The architecture of an ANN includes a
GeoConvention 2012: Vision
1
large number of neurons organized in different layers, with the neurons of one layer connected to neurons of another layer by means of adjusting weights. As in nature, the network function is determined largely by the connections between elements. A neural network is trained to perform a particular function by adjusting the values of the connections (weights) between elements. Commonly, neural networks are adjusted, or trained, so that a particular input leads to a specific target output. Such a process is called a learning algorithm, where the network is adjusted, based on a comparison of the output and the target, until the network output closely matches the target. Typically many such input/target pairs are needed to train a network. This study demonstrates the application of ANN to estimate permeability (K) and porosity (Φ) from well log data from the interval 3160 – 3240 metres KB in well location 102/01-06-054-21W5. Five well log data types were used for the analysis: Gamma Ray Log (GR), Deep Resistivity (RD), Formation Density (DEN), Neutron Porosity (PHIN) and Density Porosity (PHID). These well log data comprise inputs in the neural network and core porosity and permeability for the same well are considered as desired (target) output in the NN. Incorporation of core analysis data presents, several challenges for ANN modeling. First, core data depths typically need to be bulk-shifted to correlate with the log data.
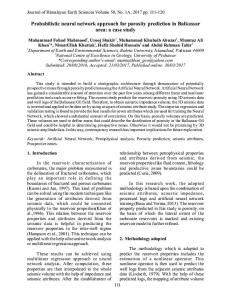
Figure 1: Core porosity and permeability with interpolated data points.
In this study, the bulk shift was applied by visual comparison between a depth plot of discrete core porosity values and the density porosity curve. Secondly, core analyses are not regularly sampled in depth and the depth points of core data do not precisely match the sample depths of well log data. To address this latter problem, we used a nearest neighbor interpolation method (De Boor, 1978; Kahaner, et al., 1989) to interpolate core data at equal depth intervals corresponding to depth points in the LAS input files. The interpolated core porosity and permeability are presented in Figure 1, and these data are used as target in the neural network.
GeoConvention 2012: Vision
2
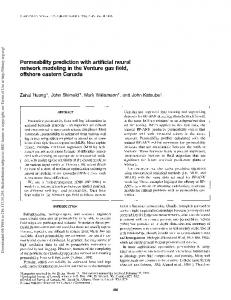
Methodology The general architecture of artificial neural networks (ANN) consists of input, hidden and output layers of neurons (Haykin, 1999). Generally the neurons are connected in a feed forward manner. A single neuron is characterized by input weights, a threshold and a nonlinear or linear activation function. A neuron in one layer is connected to other layers by weights. Thus the output of the system is a nonlinear function of the weighted sum of the inputs plus a bias. Architecture of ANN for the present study is shown in Figure 2. The standard workflow of back propagation method used in this work consists of the following steps: 1. Initialize the network synaptic weights to small random values. 2. From the set of training input/output pairs present an input pattern and calculate the network response. 3. The desired network response is compared with the actual and using the equations, the local errors are computed. 4. The weights of the network are updated. 5. Step 2 to step 4 are repeated until a minimum overall error is obtained.
Input Layer
Hidden Layer
Output Layer
Connecting Weights
GR RHOB
---------------
RD PHIN
Permeability or Porosity
PHID Figure 2: Architecture of the artificial neural network for the present study.
In general, Suppose there are “n” number of inputs (x1, x2, x3,.......,xn) and one output, then the output (y) can be presented by following relationship:
n y f (net ) f wi xi i 1 and
net wT x w1 x1 w2 x2 ..........wn xn
where “f(net)” refers to activation or transfer function and, “wi” is the weight vector. In the training phase of the network, the parameters of the network are optimized and a process of curve fitting is initiated. The training phase is done by one of the learning algorithms available in the literature. The most widely used learning algorithm for training of the neural network is the backpropagation learning algorithm (Haykin, 1999; Lim, 2003) which is used in this study. The training
GeoConvention 2012: Vision
3
process involves the feeding of training samples as input vectors through a neural network, calculating the error of the output layer, and then adjusting the weights of the network to minimize the error. The training set is passed through the network and an average of all the square errors for the outputs is computed. The average error is then propagated back to update weights and bias value of the network in order to get more accurate prediction.
Results Core porosity and permeability were chosen as target to the network. Training data were chosen from random order selection from the original well log data.
(a)
(b)
Figure 3: (a) Predicted porosity from ANN and core porosity with depth; (b) Regression plot of core porosity and predicted porosity from ANN.
The training process of the network involved selection of the structure (i.e. number of layers, number of neurons, type of activation function etc.) and updating of weights and biases which was done by several learning algorithms. A network with one hidden layer has been chosen as dictated by established practice. Since there are five inputs and one output, the structure of the input and output layers is fixed. The numbers of hidden neurons were increased until the dimension (the number of weights) equalled the number of available data. Sixty hidden neurons with tanh nonlinearity and one output neuron with linear activation were chosen. Weights and biases of the network were then properly initialized and the network was subjected to a back-propagation Levenberg-Marquardt training algorithm.
GeoConvention 2012: Vision
4
Results are presented in Figures 3(a) and 4(a) as superimposed plots of predicted values from ANN with core data. The regression plots in Figures 3(b) and 4(b) reflect the accuracy of neural network approach. Correlation coefficients of 0.9939 and 0.9981 were obtained for porosity and permeability prediction respectively.
(a)
(b)
Figure 4: (a) Predicted permeability from ANN and core permeability with depth; (b) Regression plot of core permeability and predicted permeability from ANN.
Discussion and Conclusions The high degree of correlation between actual and ANN-predicted core porosity and permeability in this study demonstrates the potential of artificial intelligence methods for reservoir characterization problems. The next phase of the study requires a “blind” test of applying the trained ANN from the calibration well to other offsetting wells and evaluating predicted values against actual core analyses for those wells. Issues of normalization of input log responses will be an important consideration in experimental design, prior to assessing the general applicability of the ANN method.
Acknowledgements The first author is thankful to the Department of Foreign Affairs and International Trade (DFAIT), Govt. of Canada, for the scholarship granted in the completion of this research work.
GeoConvention 2012: Vision
5
References De Boor, C., 1978, A Practical Guide to Splines, Springer-Verlag. Fausett, L. V., 1994, Fundamentals of neural networks: Architecture, algorithms, and applications, Prentice-Hall, Englewood Cliffs, N.J. Fung,C.C., Wong, K.W. and Eren, H., 1997, Modular artificial neural network for prediction of petrophysical properties from well log data, IEEE Trans. on Instrumentation and Measurement, 46, No. 6. Haykin, S.S., 1999, Neural Networks: A Comprehensive Foundation, Prentice Hall Kahaner, D., Moler, C. and Nash, S., 1989, Numerical Methods and Software, Prentice-Hall, Englewood Cliffs, NJ. Lim, Jong-Se, 2003, Reservoir permeability determination using artificial neural network. J. Korean Soc. Geosyst. Eng. 40, 232– 238. Nikravesh, M., Aminzadeh, F., 2001, Past, present and future intelligent reservoir characterization trends (editors’ view points): Journal of Petroleum Science and Engineering, 31, 67–79. Nikravesh, M., Aminzadeh, F., Zadeh, L.A., 2003, Soft computing and intelligent data analysis in oil exploration: Developments in petroleum sciences 51. Ouenes, A., 2000, Practical application of fuzzy logic and neural networks to fractured reservoir characterization: Computers & Geosciences 26, 953-962.
GeoConvention 2012: Vision
6