Port competition and selection in contestable hinterlands; the case of Austria
Peter W. de Langen Erasmus University Rotterdam Department of Port, Transport and Regional economics Burg. Oudlaan 50, 3062 PA Rotterdam The Netherlands tel: +31 10 4081845 fax: +31 10 4081953 e-mail:
[email protected] EJTIR, 7, no. 1 (2007), pp. 1-14
Received: October 2005 Accepted: October 2006
This paper deals with port competition and port selection for cargo to/from Austria. Austria is located centrally in Europe and seaports in at least five countries are used for imports and exports. Changes of market shares over time of different ports serving Austria are analysed. Switching of cargo between ports does take place, but friction prevents instantaneous switching. Consequently, it took a decade for the new potential of inland shipping to Austria, resulting from the opening of the Rhine-Main-Donau canal, was fully realised. A survey was held to analyse port choice decisions of two types of decision makers: shippers and forwarders. These results show shippers and forwarders have similar views on port selection, but shippers have a less price-elastic demand. Keywords: port choice, port competition, hinterland, Austria, case study
1. Introduction Port competition has become fiercer over time (Meersman and Van de Voorde, 2002), amongst others because of the rise of international trade, concentration in the shipping industry and liberalization of transport markets. Furthermore, the nature of port competition has changed; port services are no longer provided in isolation, but need to fit into door-todoor supply chains. Terminal operating companies (TOCs) as well as port authorities not only provide services to shipping lines, but increasingly play a role in hinterland transport. This is explained by a number of reasons. First, an increasing amount of door-to-door costs are inland costs (Notteboom and Rodrigue, 2004). Thus, the efficiency of hinterland transport
2
Port competition and selection in contestable hinterlands; the case of Austria
becomes more important for the competitive position of TOCs in supply chains. Second, whereas TOCs have in general been able to improve terminal operations to accommodate increasing volumes (and ship sizes), dealing with these increased volumes has proved more difficult in hinterland transport. Third, unlike the shipping industry that is dominated by relatively few global players, the number of firms involved in providing hinterland services is huge. Thus, there is need for the effective coordination of hinterland services (De Langen and Chouly, 2004). In this paper an analysis is made of port competition and port selection in Austria, a country that is served by at least six different ports in five different countries: Hamburg and Bremen (Germany), Rotterdam (The Netherlands), Antwerp (Belgium), Trieste (Italy), and Koper (Slovenia). The analysis of port selection processes in a region with fierce competition from ports in different countries adds to existing studies of port selection. In the remainder of this paper, first, a theoretical background for analysing hinterlands of ports is provided, and second, an analysis of changing market shares of the ports competing for Austrian cargo is made. Third, results of a survey of port choice decisions of shippers and forwarders are discussed and fourth, an overview of the perceived quality of the six competing ports is presented. A concluding section finalises the paper.
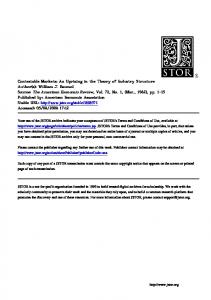
2. Analysing port hinterlands Sargent (1938) provides a first analysis of port hinterlands. Other contributions to understanding port hinterlands include Morgan (1951), who argues that the hinterland of a port is different for each commodity. He also argues that ‘liner port hinterlands’ are the most complicated. Taaffe et al. (1963) analyse increasing concentration of transport flows on a few corridors to the hinterland. Bird (1963) describes spatial change of port complexes and Van Klink (1995) argues that ports increasingly create networks with hinterland nodes to increase the competitive position of the port. Van Klink and van den Berg (1998) and Rodrigue (2004) further emphasise the importance of corridors to the hinterland. Notteboom and Rodrigue (2004) introduce the concept of ‘island formations’ that can give a port a competitive edge in a hinterland. De Langen and Chouly (2004) stress the importance of analysing hinterland access as an ´interorganisational issue´. A distinction can be made between captive and contestable hinterlands. This distinction is very similar to the distinction made by Morgan (1951) between primary hinterlands, the area where the port is well established and secondary hinterlands, with rivalry among ports. All regions where one port has a substantial competitive advantage because of lower generalized transport costs to these regions belong to the captive hinterland of this port. Consequently, this port handles the vast majority of all cargoes to/from these regions. Haralambides (2002) observes that for most ports, such captive hinterlands have diminished. Contestable hinterlands consist of all those regions where there is no single port with a clear cost advantage over competing ports. As a consequence, various ports will have a share of the market. Figure 1 shows, in stylized form, the distinction between captive and contestable hinterland.
European Journal of Transport and Infrastructure Research
De Langen
3
Equal quality of hinterland access Superior hinterland access port A Captive hinterland Cost Port A Advantage Port A ($/ton)
Captive hinterland Cost Port B Advantage
Port B ($/ton) Contestable hinterland
Port A 200
150
100
50
0
50
100
150
200
Port B
Distance advantage to closest port (km) Figure 1. Captive and contestable hinterlands. Figure 1 shows the cost advantage of a port related to its distance advantage compared to a competing port. When the quality of hinterland access is exactly the same for both ports, the cost difference is nil as the distance to both competing ports is exactly the same. Various factors other than distance influence the level of ‘generalised transport costs’ to locations in the hinterland, such as quality of the infrastructure, frequency of services and natural or political barriers (see Vigarie, 2004). The dotted line in figure 1 shows an example of a port (port A) with a cost advantage not solely explained by distance.1 Port competition is fiercest in those regions where no single port has a lasting cost advantage compared to other ports. Such regions are part of the contestable hinterland. In Europe, the clearest example of such a contestable hinterland is Austria. Ports from 5 different countries compete for and have a substantial market share of Austrian cargo. Thus, an analysis of port competition and selection in this country is especially relevant for understanding how competitive advantage can be created in contestable hinterlands.2 Such an analysis is presented in the following paragraphs.
3. The evolution of Austria’s maritime transport routes Austria is a relatively small, open and prosperous economy in Europe. The country’s goods imports were about 91 billion euro and goods exports were about 90 billion euro in 2004 1
The shape of the ‘cost advantage curve’ in figure 1 is upward sloping rather than linear. This assumes the presence of scale economies due to higher frequencies or better vehicle utilization in regions in the proximity of the seaport. 2 The Mid-West of the USA (around Chicago) is perhaps the best example of a contestable hinterland in North America. This region is served by US and Canadian ports on the west coast, such as LA/Long Beach and Vancouver, ports in the Gulf coast, most importantly the ´Lower Mississippi ports´, ports on the West Coast, such as New York/New Yersey, and Great Lakes ports, such as Montreal.
European Journal of Transport and Infrastructure Research
4
Port competition and selection in contestable hinterlands; the case of Austria
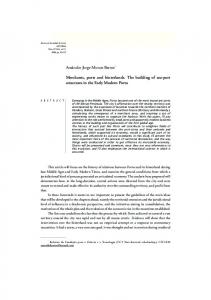
(Statistics Austria, 2006). Both imports and exports are more than 35% of the country’s GDP. The majority of trade is continental European trade, to countries such as Germany, by far the largest trading partner and Italy, the second largest trading partner. Major overseas trading partners are the US, China and Japan (Statistics Austria, 2006). Figure 2 shows the main seaports serving Austria (Seehafenbilanz, 1997; 2004).3 These ports can be classified in three pairs, the North ports (Hamburg and Bremen), the West ports (Rotterdam and Antwerp) and the South ports (Trieste and Koper). The ports in the same pair use to a large extent the same infrastructure to serve Austria. Thus, port performance can be expected to be an important determinant in the competition between such ports. A relevant question in this respect is: ´is competitive advantage specific to one port, or instead specific to a port pair?’ If the latter is the case, cooperation between the ports in the same pair may be sensible.
Hamburg Rotterdam
Bremen
Antwerp
Austria Trieste
Koper
Figure 2. The main seaports serving Austria The volumes of overseas imports and exports and their distribution over ports in 2003 are given in table 1.
3
The existence of these ‘port pairs’ is interesting in the context of scale economies in transport. The existence of port pairs seems to indicate that at least some scale economies are relevant for corridors, but less so for specific port activities. This issue is not further explored in the paper.
European Journal of Transport and Infrastructure Research
De Langen
5
Table 1. The volumes of the six largest ports for Austrian cargo
Rotterdam Antwerp Bremen Hamburg Koper Trieste
Volume in 2003 (*1,000) Import Export Total 3,180 648 3,828 1,051 453 1,540 187 662 849 926 1,207 2,133 2,216 568 2,784 324 610 934
Source: Seehafenbilanz (2004)
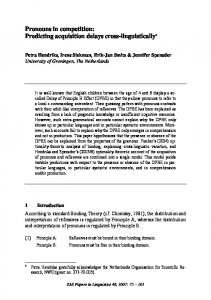
These data cannot be split up into commodities as in generally done in seaports, because these data are not collected in Austria.4 A substantial fraction of the imports consist of raw materials, while the exports are mainly finished goods (Statistics Austria, 2004). Figure 3 and 4 show the evolution of market shares of the six most important ports for Austrian imports and exports respectively, over the last decade. market shares 6 ports for imports 50% 45% 40%
market shares
35% Rotterdam 30%
Antwerp
25%
Bremen Hamburg
20%
Koper 15%
Trieste
10% 5% 0% 1991 1992 1993 1994 1995 1996 1997 1998 1999 2000 2001 2002 2003
Figure 3. Market shares of ports for Austrian imports 1990-2003 The figures yield three interesting observations. First, the overall fluctuations of the market shares are large, both for import and for export flows. These fluctuations indicate competition is fierce; ports can gain or lose substantial market share in a short period. Factors that have influenced the development of market shares in this period include the opening of the Rhine4
The six port authorities do not have data on market shares to Austria for specific commodities either. They may be able to roughly estimate their market shares, but such figures would be rather unreliable. Furthermore, whereas an estimate for the present situation may be possible, the analysis of the data is based on a time series of more than 10 years. Port authorities cannot possibly estimate such data accurately.
European Journal of Transport and Infrastructure Research
6
Port competition and selection in contestable hinterlands; the case of Austria
Main-Donau Canal, in 1992, the water levels in the Rhine5, and political instability in former Yugoslavia. market shares 6 ports for exports
30%
25%
Rotterdam Antwerp
market shares
Bremen 20%
Hamburg Koper Trieste
15%
10%
5% 1991
1993
1995
1997
1999
2001
2003
Figure 4. Market shares of ports for Austrian exports 1990-2003 Second, the market share of Rotterdam has risen sharply. The same applies, though to a smaller extent, to Antwerp. This rising market share can be attributed to the opening of the Rhine-Main Donau Canal. This has led to a larger market share for inland shipping. Rotterdam and Antwerp have benefited from increased inland shipping volumes as they are well connected to the river Rhine. This explains their strongly increased market shares for imports: especially the bulk imports are less time sensitive and thus suitable for inland waterway transport. The rise in market share has taken roughly a decade. This is a substantial period. Two kinds of explanations may be put forward. First, it may be argued that many decision makers make decisions on the basis of history and existing relations (D’este and Meyrick, 1992; Tongzon, 2002). Second, it may be that switching from one transport mode and port to another incurs costs. For instance, the structure of supply chains and storage locations may need to change, or firms may need to invest in inland shipping terminals or inland barges. These ‘switching costs’ explain why switching does not take place immediately, but ´friction´ has to be overcome (see Hesse and Rodrigue, 2004). Third, the figures show that, unlike many observers in the shipping industry have forecasted (Fageda, 1999), no shift from the ‘North ports’ and ‘West ports’ to the ‘South ports’ has occurred, even though the South ports have a clear distance advantage. This demonstrates distance alone does not explain market shares in the hinterland (Malchow and Kanafani, 2004).
5
When the water level in the Rhine is low, inland barges cannot be fully loaded. Consequently, less cargo is transported by inland waterway and ports with good barge connections lose market share.
European Journal of Transport and Infrastructure Research
De Langen
7
4. Port selection of shippers and forwarders: results from a survey. There is a growing literature on port selection. In one important research approach, transport choice is modelled (see Mangan et al., 2002), amongst others with discrete choice models (Malchow and Kanafani, 2004; Tiwari et al., 2003). A number of relevant research findings have been obtained.6 First, the importance of location (the origin or destination in the hinterland) turns out to be the most important factor in port choice (Malchow and Kanafani, 2004). Second, good characteristics (such as value density and refrigerated or not) influence port choice (Malchow and Kanafani, 2004). This is explained because different goods have different time sensitivities (De Langen, 1999). Third, the number of ship calls and routes offered by a particular port are relevant (Tiwari et al., 2003). Notwithstanding these findings, the approach has one major shortcoming: differences in the behaviour of decision makers in port choice are not included in the analysis. There are however indications that ‘behavioural factors’ are relevant in port choice.7 Mangan et al. (2002) show for instance that driver factors, such as onboard facilities and opportunities to have a rest break, influence the choice of ferry ports. They also argue that partnership relations between road transport firms and RoRo carriers influence port choice. Tongzon (1995) has shown the relatively high concern of shippers with indirect costs, such as unreliability, damage and adverse reputation effects. Murphy et al. (1992) show that port selection factors are valued differently by freight forwarders and shippers.8 This study complements existing studies by dealing specifically with port selection of shippers and forwarders in contestable hinterlands. Tongzon (2002) distinguishes three kinds of shippers: those with long term contracts with shipping lines, those that outsource logistics to forwarders and third, ‘independent shippers’ (Tongzon, 2002) who make transport choices themselves. He concludes that both independent shippers and forwarders engage in port choice continuously. Hesse and Rodrigue (2004) introduce the term ‘supply chain power’ and attribute this power to third party logistics providers, such as forwarders. This underlines the relevance of analysing port selection processes of forwarders. The survey results were obtained by e-mailing a survey to a sample of about 300 Austrian shippers and forwarders. The addresses were obtained from websites with contact details of forwarders, importers and exporters.9 The use of various data sources ensures a relatively random sample. All firms were asked to return the survey if they regularly engaged in port selection decisions. This reduces the response rate as not all selected firms make such decisions (e.g. when they only deal with
6
In this discussion, no attention is paid to the selection of transshipment ports, for this issue see Lirn et al., 2003. These ‘behavioural factors’ may be perfectly rational for the involved decision-makers. We regard factors as ‘behavioural’ when they are ‘actor specific’. Malchow and Kanafani (2003, p. 319) argue that ‘the shipper preferences are wholly subsumed within the choice of a carrier’ (or forwarder). However, it seems more realistic to assume such actors also influence port choice for ‘company specific reasons’ such as the need for effective repositioning of empties, volume discounts in contracts with ports and the like. 8 Murphy and Daley (1995) analyse previous studies where shipper and carrier preferences are compared. They conclude that the ranking of various carrier selection factors is very similar between carriers and shippers, while the mean importance attributed to various factors differs between carriers and shippers. 9 The websites www.transportdata.de, www.compass.net, www.gelbeseites.at, www.trend.at and www.austrianexport.org were used. The data collection was carried out by S. Vergouw, for his Masters thesis on this topic (Vergouw, 2004). 7
European Journal of Transport and Infrastructure Research
8
Port competition and selection in contestable hinterlands; the case of Austria
continental supply chains10). Furthermore, the fact that surveys were send by email may have lowered the response rate, which was 11%. The 15 shippers and 17 forwarders that did return a completed survey engage in port selection processes and provide a sufficiently large sample to draw some tentative conclusions. Table 2 shows the opinions of both shippers and forwarders with regard to a number of propositions on port selection. Table 2. Responses to a number of port selection propositions11 Proposition Port choice is based on historical reasons/tradition Port choice is based on personal relations in port Port choice is based on (perception of) price Port choice is based on (perception of) quality of port Total transport costs are important but not decisive in port selection Quality and service determine port choice, as long as the price does not exceed a certain level our company is willing to pay. A lower price can compensate a lower service level When more ports offer an attractive price/quality, cargo is distributed over various ports Port choice is continuously re-assessed If our current port provides satisfactory services, there is no reason to change ports, even if price advantages exist
Forwarder (n=15) Agree (%) Disagree (%) 14 79 20 67 73 7 80 0
Shipper (n=17) Agree (%) Disagree (%) 8 83 13 56 59 12 65 6
60
33
76
24
73
13
71
24
53*
33*
12*
82*
21
79
53
41
60
40
65
29
13*
87*
35*
47*
* Significant differences in opinion between shippers and forwarders, p