Portfolio: Finding Relevant Functions and Their Usages Collin McMillan
Mark Grechanik
Denys Poshyvanyk
Qing Xie, Chen Fu
College of William & Mary Williamsburg, VA 23185
Accenture Technology Lab Chicago, IL 60601
College of William & Mary Williamsburg, VA 23185
Accenture Technology Lab Chicago, IL 60601
[email protected]
mark.grechanik@ accenture.com
ABSTRACT Different studies show that programmers are more interested in finding definitions of functions and their uses than variables, statements, or arbitrary code fragments [30, 29, 31]. Therefore, programmers require support in finding relevant functions and determining how those functions are used. Unfortunately, existing code search engines do not provide enough of this support to developers, thus reducing the effectiveness of code reuse. We provide this support to programmers in a code search system called Portfolio that retrieves and visualizes relevant functions and their usages. We have built Portfolio using a combination of models that address surfing behavior of programmer and sharing related concepts among functions. We conducted an experiment with 49 professional programmers to compare Portfolio to Google Code Search and Koders using a standard methodology. The results show with strong statistical significance that users find more relevant functions with higher precision with Portfolio than with Google Code Search and Koders.
Categories and Subject Descriptors D.2.9 [Software Engineering, Management]: Productivity; D.2.m [Software Engineering, Miscellaneous]: Reusable software
General Terms Algorithms, Experimentation
Keywords Code search, portfolio, pagerank, function call graph, ranking.
1.
INTRODUCTION
Different studies show that programmers are more interested in finding definitions of functions and their uses than variables, statements, or arbitrary fragments of source code [31]. More specifically, programmers use different tools including code search engines to answer three types of questions [30, 29]. First, programmers want to find initial focus points such as relevant functions that
Permission to make digital or hard copies of all or part of this work for personal or classroom use is granted without fee provided that copies are not made or distributed for profit or commercial advantage and that copies bear this notice and the full citation on the first page. To copy otherwise, to republish, to post on servers or to redistribute to lists, requires prior specific permission and/or a fee. ICSE ’11, May 21–28, 2011, Honolulu, Hawaii, USA Copyright 2011 ACM 978-1-4503-0445-0/11/05 ...$10.00.
[email protected]
{qing.xie,chen.fu} @accenture.com
implement high-level requirements. Second, programmers must understand how a function is used in order to use it themselves. Third, programmers must see the chain of function invocations in order to understand how concepts are implemented in these functions. It is important that source code search engines support programmers in finding answers to these questions. In general, understanding code and determining how to use it, is a manual and laborious process that takes anywhere from 50% to 80% of programmers’ time [5, 8]. Short code fragments that are returned as results to user queries do not give enough background or context to help programmers determine how to reuse these code fragments, and programmers typically invest a significant intellectual effort (i.e., they need to overcome a high cognitive distance [17]) to understand how to reuse these code fragments. On the other hand, if code fragments are retrieved as functions, it makes it easier for developers to understand how to reuse these functions. A majority of code search engines treat code as plain text where all words have unknown semantics. However, applications contain functional abstractions that provide a basic level of code reuse, since programmer define functions once and call them from different places in source code. The idea of using functional abstractions to improve code search was proposed and implemented elsewhere [3, 10, 23, 32]; however, these code search engines do not automatically analyze how functions are used in the context of other functions, despite the fact that understanding the chains of function invocations is a key question that programmers ask. Unfortunately, existing code search engines do little to ensure that they retrieve code fragments in a broader context of relevant functions that invoke one another to accomplish certain tasks. Our idea is that since programmers frequently ask various questions about functions, a code search engine should incorporate information about these functions that is used to answer the programmers’ questions. Browsing retrieved functions that are relevant to queries means that programmers follow function calls and review declarations, definitions, and uses of these functions to combine them in a solution to a given task. That is, programmers want to accomplish the whole task quickly, rather than obtain multiple examples for different components of the task. For example, consider the query “mip map dithering texture image graphics,” which we use as an example query throughout this paper. Programmers don’t want to just see examples that implement mip map techniques, and others that render texture, and others that manipulate graphic images. A programmer wants to accomplish the complete task of dithering mip map images that accompany a texture. However, among relevant results there are functions that implement mipmapping, functions that manipulate texture, and there are multiple functions that deal with graphic images. Typically, programmers investigate these functions
to determine which of them are relevant and determine how to compose these functions to achieve the goal that is expressed with the query. That is, a programmer wants to see code for the whole task of how to mip map images that accompany a texture in computer graphics. A search engine can support programmers efficiently if it incorporates in its ranking how these functions call one another, and displays that information to the user. We created a code search system called Portfolio that supports programmers in finding relevant functions that implement highlevel requirements reflected in query terms (i.e., finding initial focus points), determining how these functions are used in a way that is highly relevant to the query (i.e., building on found focus points), and visualizing dependencies of the retrieved functions to show their usages. Portfolio finds highly relevant functions in close to 270 Millions LOC in projects from FreeBSD Ports1 by combining various natural language processing (NLP) and indexing techniques with PageRank and spreading activation network (SAN) algorithms. With NLP and indexing techniques, initial focus points are found that match key words from queries; with PageRank, we model the surfing behavior of programmers, and with SAN we elevate highly relevant chains of function calls to the top of search results. We have built Portfolio and conducted an experiment with 49 professional C++ programmers to evaluate Portfolio and compare it with the well-known and successful engines Google Code Search and Koders. The results show with strong statistical significance that users find more relevant code with higher precision with Portfolio than those with Google Code Search and Koders. To the best of our knowledge, we are not aware of any existing code search engines that have been evaluated against and shown to be more accurate than widely used commercial code search engines, with strong statistical significance and over a large codebase and using a standard information retrieval methodology [22, pages 151-153]. Portfolio is free and available for public use2 .
2.
THE MODEL
The search model of Portfolio uses a key abstraction in which the search space is represented as a directed graph with nodes as functions and directed edges between nodes that specify usages of these functions (i.e., a call graph). For example, if the function g is invoked in the function f, then a directed edge exists from the node that represents the function f to the node that represents the function g. Since the main goal of Portfolio is to enable programmers to find relevant functions and their usages, we need models that effectively represent the behavior of programmers when navigating a large graph of functional dependencies. These are navigation and association models that address surfing behavior of programmers and associations of terms in functions in the search graph.
2.1 Navigation Model When using text search engines, users navigate among pages by following links contained in those pages. Similarly, in Portfolio, programmers can navigate between functions by following edges in the directed graph of functional dependencies using Portfolio’s visual interface. To model the navigation behavior of programmers, we adopt the model of the random surfer that is used in popular search engines such as Google. Following functional dependencies helps programmers to understand how to use found functions. The surfer model is called random because the surfer can “jump” to a new URL, or in case of source code, to a new function. These random jumps are called teleportations, and this navigation model is the basis for the popular ranking algorithm PageRank [2, 19]. 1 http://www.freebsd.org/ports 2 http://www.searchportfolio.net
Figure 1: Example of associations between different functions. In the random surfer model, the content of functions and queries does not matter, navigations are guided only by edges in the graph that specifies functional dependencies. Accordingly, PageRank reflects only the surfing behavior of users, and this rank is based on the popularity of a function that is determined by how many functions call it. However, the surfing model is query independent since it ignores terms that are used in search queries. Taking into consideration query terms may improve the precision of code searching. That is, if different functions share concepts that are related to query terms and these functions are connected using functional dependencies, then these functions should be ranked higher. We need a search model that should automatically make embedded concepts explicit by using associations between functions that share related concepts, and then we combine this model with the surfing model in Portfolio.
2.2 Association Model The main idea of an association model is to establish relevance among facts whose content does not contain terms that match user queries directly. Consider the query “mipmap dithering texture image graphics.” Among relevant results there are functions that implement mip map techniques, and others that render texture, and there are multiple functions that manipulate graphic images. This situation is schematically shown in Figure 1, where the function F contains the term mip map, the function G contains the term dithering, the function P contains the terms graphics and image, and the term texture is contained in the function Q. Function F calls the function G, which in turn calls the function H, which is also called from the function Q, which is in turn called from the function P. The functions F, P, and Q will be returned by a search engine that is based on matching query terms to those that are contained in documents. Meanwhile, the function H may be highly relevant to the query but it is not retrieved since it has no words that match the search terms. In addition, the function G can be called from many other functions since its dithering functionality is generic; however, its usage is most valuable for programmers in the context of the function that is related to query terms. A problem is how to ensure that the functions H and G end up on the list of highly relevant functions. To remedy this situation we use an association model that is based on a Spreading Activation Network (SAN) [4, 6]. In SANs, nodes represent documents, while edges specify properties that connect these documents. The edges’ direction and weight reflect the meaning and strength of associations among documents. For example, an article about clean energy and a different article about the melting polar ice cap are connected with an edge that is labeled with the common property “climate change.” Once applied to SAN, spreading activation computes new weights for nodes (i.e., ranks) that reflect implicit associations in the networks of these nodes. In Portfolio, we view function call graphs as SANs where nodes represent functions, edges represent functional dependencies, and weights represent a strength of associations, which includes the number of shared terms. After the user enters a query, a list of functions is retrieved and sorted based on the score that reflects the
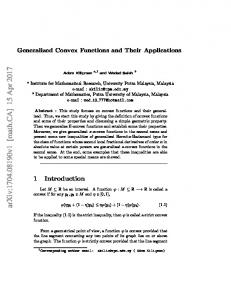
Figure 2: Portfolio architecture. match between query terms and terms in functions. Once Portfolio identifies top matching functions, it computes SAN to propagate concepts from these functions to others. The result is that every function will have a new score that reflects the associations between concepts in these functions and user queries.
2.3 The Combined Model The ranking vectors for PageRank kπkPR and spreading activation kπkSAN are computed separately and later are linearly combined in a single ranking vector kπkC = f (kπkPR , kπkSAN ). PageRank is query independent and is precomputed automatically for a function call graph, while kπkSAN is computed automatically in response to user queries. Assigning different weights in the linear combination of these rankings enables fine-tuning of Portfolio by specifying how each model contributes to the resulting score.
3.
OUR APPROACH
In this section we describe the architecture of Portfolio and show how to use Portfolio.
3.1 Portfolio Architecture The architecture for Portfolio is shown in Figure 2. The main elements of the Portfolio architecture are the database holding software applications (i.e., the Projects Archive), the Metadata Builder, the Function Graph Builder, the SAN and PageRank algorithms, the Visualizer and the key word search engine. Applications metadata describes functions that are declared, defined and invoked in the applications and words that are contained in the source code of these functions and comments. Portfolio is built on an internal, extensible database of 18,203 C/C++ projects that contain close to 2.3Mil files with close to 8.6Mil functions that contain 2,496,172 indexed words. Portfolio indexes and searches close to 270Mil LOC in these C/C++ projects that are extracted from FreeBSD’s source code repository called ports3 . It is easy to extend Portfolio by adding new projects to the Projects Archive. The user input to Portfolio is shown in Figure 2 with the arrow labeled (7). The output is shown with the arrow labeled (18). Portfolio works as follows. The input to the system is the set of applications from the Projects Archive that contain various functions (1). The Function Graph Builder analyzes the source code of these applications statically and it outputs (2) the function call graph (FCG) that contains functional dependencies. This operation is imprecise since resolving dynamic dispatch calls and function pointers statically is an undecidable problem [18]. Since this 3 http://www.freebsd.org/ports
- last checked August 17,2010.
is done offline, precise program analysis can be accommodated in this framework to achieve better results in obtaining correct functional dependencies. We conduct the sensitivity analysis of Portfolio and its constituent algorithms in Section 5.7.1. Next, the algorithm PageRank is run (3) on the FCG, and it computes (4) the rank vector, kπkPR , in which every element is a ranking score for each function in the FCG. The Metadata Builder reads in (5) the source code of applications, applies NLP techniques such as stemming and identifier splitting, and indexes the source code as text resulting (6) in Projects Metadata. When the user enters a query (7), it is passed to the key word search component along with the Projects Metadata (8). The key word search engine searches the metadata using the words in the query as keys and outputs (9) the set of Relevant Functions whose source code and comments contain words that match the words from the query. These relevant functions (10) along with the FCG (11) serve as an input to the algorithm SAN. The algorithm SAN computes (12) spreading activation vector of scores kπkSAN for functions that are associated with the relevant functions (10). Ranking vectors kπkPR (14) and kπkSAN (13) are combined into the resulting vector kπk (15) that contains ranking scores for all relevant functions. The Visualizer takes (16) the list of relevant functions that are sorted in descending order using their ranking scores and (17) the metadata, in order to present (18) the resulting visual map to the user as it is shown in Figure 3.
3.2 Portfolio Visual Interface After the user submits a search query, the Portfolio search engine presents functions relevant to the query in a browser window as it is shown in Figure 3. The left side contains the ranked list of retrieved functions and project names, while the right side contains a static call graph that contains these and other functions. Edges of this graph indicate the directions of function invocations. Hovering a cursor over a function on the list shows a label over the corresponding function on the call graph. Font sizes reflect the combined ranking; the higher the ranking of the function, the bigger the font size used to show it on the graph. Clicking on the label of a function loads its source code in a separate browser window.
4. RANKING In this section we discuss our ranking algorithm.
4.1 Components of Ranking There are three components that compute different scores in the Portfolio ranking mechanism: a component that computes a score based on word occurrences (WOS), a component that computes a score based on the random surfer navigation model (PageRank) described in Section 2.1, and a component that computes a score based on SAN connections between these calls based on the association model described in Section 2.2. WOS ranking is used to bootstrap SAN by providing rankings to functions based on query terms. The total ranking score is the weighted sum of the PageRank and SAN ranking scores. Each component produces results from different perspectives (i.e., word matches, navigation, associations). Our goal is to produce a unified ranking by putting these orthogonal, yet complementary rankings together in a single score.
4.2 WOS Ranking The purpose of WOS is to enable Portfolio to retrieve functions based on matches between words in queries and words in the source code of applications. This is a bootstraping ranking procedure that serves as the input to the SAN algorithm.
Figure 3: A visual interface of Portfolio. The left side contains a list of ranked retrieved functions for the motivating example query and the right side contains a call graph that contains these functions; edges of this graph indicate the directions of function invocations. Hovering a cursor over a function on the list shows a label over the corresponding function on the call graph. Font sizes reflect the score; the higher the score of the function, the bigger the font size used to show it on the graph. Clicking on the label of a function loads its source code in a separate browser window.
The WOS component uses the Vector Space Model (VSM), which is a ranking function typically used by search engines to rank matching documents according to their relevance to a given search query. This function is implemented in the Lucene Java Framework which is used in Portfolio. VSM is a standard bag-of-words retrieval function that ranks a set of documents based on the relative proximity of query terms (e.g., without dependencies) appearing in each document. Each document is modeled as a vector of terms contained in that document. The weights of those terms in each document are calculated using the Term Frequency/Inverse Document Frequency (TF/IDF) formula. Using TF/IDF, the weight for a term is calculated as t f = ∑ nnk where n is the number of occurrences of the term k in the document, and ∑k nk is the sum of the number of occurences of the term in all documents. Then the similarities among the documents are calculated using the cosine distance between each pair of ·d2 where d1 and d2 are document vecdocuments cos(θ) = kdd1kkd 1 2k tors.
4.3 PageRank PageRank is widely described in literature, so here we give its concise mathematical explanation as it is related to Portfolio [2, 19]. The original formula for PageRank of a function Fi , denoted r(Fi ), is the sum of the PageRanks of all functions that invoke Fi : r(F ) r(Fi ) = ∑Fj ∈BFi |F j| , where BFi is the set of functions that invoke j Fi and |F j | is the number of functions that the function F j invokes. This formula is applied iteratively starting with r0 (Fi ) = 1/n, where n is the number of functions. The process is repeated until PageRank converges to some stable values or it is terminated after some number of steps. Functions that are called from many other functions have a significantly higher score than those that are used infrequently or not at all.
4.4 Spreading Activation Spreading activation computes weights for nodes in two steps: pulses and termination checks. Initially, a set of starting nodes is selected using a number of top ranked functions using the WOS ranking. During pulses, new weights for different nodes are transitively computed from the starting nodes using the formula N j = Σi f (Ni wi j ), where the weight of the node N j is equal to the sum of all nodes Ni that are incident to the node N j with edges whose weights are wi j . This edge weight serves to give a reduced value to nodes further away from the initial nodes. Therefore, the weight is a value between 0 and 1. The function f is typically called the threshold function that returns nonzero value only if the value of the argument is greater than some chosen threshold, which acts as a termination check preventing “flooding” of the SAN.
4.5 Example of SAN Computation Consider an example of SAN computation that is shown in Figure 4. This example is closely related to the motivating example query “mip map dithering texture image graphics.” The first ranking component, WOS, assigned the weights 0.65 and 0.52 to the two functions TiledTexture and ImageTexture 1 All weights correspondingly. We label these functions with . are to the right (rounded off to the second digit). Their subscripts indicate the order in which weights are computed from the first function weights. For example, the weight is computed for the function CreateTextureFromImage by multiplying the WOS weight for the function TiledTexture by the SAN edge weight 0.8. Several functions (e.g., load, initRendered) get different weights by following different propagation paths from the initial function nodes. In these cases, we use the highest value for each node; the final value assigned to initRenderer is 0.27.
4.6 Combined Ranking The combined rank is S = λPR kπkPR + λSAN kπkSAN , where λ is the interpolation weight for each type of the score. These weights
C, to the examined code fragments or functions using a four-level Likert scale. We asked participants to examine only the top ten code fragments that resulted from their searches since the time for each experiment was limited to two hours. The guidelines for assigning confidence levels are the following. 1. Completely irrelevant - there is absolutely nothing that the participant can use from this retrieved code fragments, nothing in it is related to keywords that the participant chose based on the descriptions of the tasks. 2. Mostly irrelevant - a retrieved code fragment is only remotely relevant to a given task; it is unclear how to reuse it. 3. Mostly relevant - a retrieved code fragment is relevant to a given task and participant can understand with some modest effort how to reuse it to solve a given task. 4. Highly relevant - the participant is highly confident that code fragment can be reused and s/he clearly see how to use it. Figure 4: Example of SAN weight computation, wi j = 0.8. are determined independently of queries unlike the scores WOS and SAN, which are query-dependent. Adjusting these weights enables experimentation with how underlying structural and textual information in application affects resulting ranking scores. Experimentation with PageRank involves changing the teleportation parameter that we briefly discussed in Section 2.1.
5.
EXPERIMENTAL DESIGN
Typically, search engines are evaluated using manual relevance judgments by experts [22, pages 151-153]. To determine how effective Portfolio is, we conducted an experiment with 49 participants who are C/C++ programmers. Our goal was to evaluate how well these participants could find code fragments or functions that matched given tasks using three different search engines: Google Code Search (or simply, Google)4 , Koders5 and Portfolio6 . We chose to compare Portfolio with Google and Koders because they are popular search engines with the large open source code repositories, and these engines are used by tens of thousands of programmers every day.
5.1 Methodology We used a cross validation experimental design in a cohort of 49 participants who were randomly divided into three groups. The experiment was sectioned in three experiments in which each group was given a different search engine (i.e., Google, Koders, or Portfolio) to find code fragments or functions for given tasks. Each group used a different task in each experiment. The same task was performed by different participants on different engines in each experiment. Before the experiment we gave a one-hour tutorial on using these search engines. In the course of each experiment, participants translated tasks into a sequence of keywords that described key concepts they needed to find. Once participants obtained lists of code fragments or functions that were ranked in descending order, they examined these functions to determine if they matched the tasks. Each participant accomplished this step individually, assigning a confidence level, 4 http://www.google.com/codesearch 5 http://www.koders.com 6 http://www.searchportfolio.net
Forty four participants are Accenture employees who work on consulting engagements as professional programmers for different client companies. Five participants are graduate students from the University of Illinois at Chicago who have at least six months of C/C++ experience. Accenture participants have different backgrounds, experience, and belong to different groups of the total Accenture workforce of approximately 211,000 employees. Out of 49 participants, 16 had programming experience with C/C++ ranging from six months to two years, and 18 participants reported more than three years of experience writing programs in C++. Ten participants reported prior experience with Google Code Search and three participants with Koders (which are used in this experiment thus introducing a bias toward these code search engines), nine participants reported frequent use of code search engines, and 16 said that they never used code search engines. All participants have bachelor degrees and 28 have master degrees in different technical disciplines.
5.2 Precision Two main measures for evaluating the effectiveness of retrieval are precision and recall [36, page 188-191]. The precision is calfunctions that are relevant , culated as Pr = # of retrieved total # of retrieved functions i.e., the precision of a ranking method is the fraction of the top r ranked documents that are relevant to the query, where r = 10 in this experiment. Relevant code fragments or functions are counted only if they are ranked with the confidence levels 4 or 3. The precision metrics reflects the accuracy of the search. Since we limit the investigation of the retrieved code fragments or functions to top ten, the recall is not measured in this experiment. We created the variable precision, P as a categorization of the response variable confidence, C. We did it for two reasons: improve discrimination of subjects in the resulting data and additionally validate statistical evaluation of results. Precision, P imposes a stricter boundary on what is considered reusable code. For example, consider a situation where one participant assigns the level two to all returned functions, and another participant assigns level three to half of these functions and level one to the other half. Even though the average of C = 2 in both cases, the second participant reports much higher precision, P = 0.5 while the precision that is reported by the first participant is zero. Achieving statistical significance with a stricter discriminative response variable will give assurance that the result is not accidental.
(a) Confidence level, C.
(b) Precision, P.
Figure 5: Statistical summary of the results of the experiment for C and P.The central box represents the values from the lower to upper quartile (25 to 75 percentile). The middle line represents the median. The thicker vertical line extends from the minimum to the maximum value. The filled-out box represents the values from the minimum to the mean, and the thinner vertical line extends from the quarter below the mean to the quarter above the mean. An outside value is defined as a value that is smaller than the lower quartile minus 1.5 times the interquartile range, or larger than the upper quartile plus 1.5 times the interquartile range (inner fences). A far out value is defined as a value that is smaller than the lower quartile minus three times the interquartile range, or larger than the upper quartile plus three times the interquartile range (outer fences).
5.3 Variables The main independent variable is the search engine (Portfolio, Google Code Search, and Koders) that participants use to find relevant C/C++ code fragments and functions. The other independent variable is participants’ C++ experience. Dependent variables are the values of confidence level, C, and precision, P. We report these variables in this section. The effects of other variables (task description length, prior knowledge) are minimized by the design of this experiment.
5.4 Hypotheses We introduce the following null and alternative hypotheses to evaluate how close the means are for the Cs and Ps for control and treatment groups. Unless we specify otherwise, participants of the treatment group use Portfolio, and participants of the control group use either Google or Koders. We seek to evaluate the following hypotheses at a 0.05 level of significance. H0 The primary null hypothesis is that there is no difference in the values of confidence level and precision per task between participants who use Portfolio, Google, and Koders. H1 An alternative hypothesis to H0 is that there is statistically significant difference in the values of confidence and precision between participants who use Portfolio, Google, and Koders. Once we test the null hypothesis H0 , we are interested in the directionality of means, µ, of the results of control and treatment groups. We are interested to compare the effectiveness of Portfolio versus Google Code Search and Koders with respect to the values of confidence level, C, and precision, P. H1 (C of Portfolio versus Google) The effective null hypothesis is that µCPort = µCG , while the true null hypothesis is that µCPort ≤ µCP . Conversely, the alternative hypothesis is µCPort > µCG .
H2(P of Portfolio versus Google) The effective null hypothesis is Port ≤ that µPort = µG P P , while the true null hypothesis is that µP G Port G µP . Conversely, the alternative hypothesis is µP > µP . H3 (C of Portfolio versus Koders) The effective null hypothesis is that µCPort = µCK , while the true null hypothesis is that µCPort ≤ µCK . Conversely, the alternative is µCPort > µCK . H4(P of Portfolio versus Koders) The effective null hypothesis is Port ≥ that µPort = µK P P , while the true null hypothesis is that µP K K Port µP . Conversely, the alternative is µP < µP . The rationale behind the alternative hypotheses to H1–H4 is that Portfolio allows users to quickly understand how queries are related to retrieved functions. These alternative hypotheses are motivated by our belief that if users see visualization of functional dependencies in addition to functions whose ranks are computed higher using our ranking algorithm, they can make better decisions about how closely retrieved functions match given tasks.
5.5 Task Design We designed 15 tasks for participants to work on during experiments in a way that these tasks belong to domains that are easy to understand, and they have similar complexity. The authors of this paper visited various programming forums and internet groups to extract descriptions of tasks from the questions that programmers asked. In addition, we interviewed several programmers at Accenture who explained what tasks they worked on in the past year. Additional criteria for these tasks is that they should represent realworld programming tasks and should not be biased towards any of the search engines that are used in this experiment. These tasks and the results of the experiment are available for download7 . 7 http://www.searchportfolio.net,
follow the Experiment link.
H
Var
H1
C
H2
P
H3
C
H4
P
Approach Portfolio Google Portfolio Google Portfolio Koders Portfolio Koders
Samples 1276 1373 184 198 1276 1486 184 208
Min 1 1 0 0 1 1 0 0
Max 4 4 1 1 4 4 1 1
Median 3 2 0.7 0.25 3 2 0.7 0.5
µ 2.86 1.97 0.65 0.35 2.86 2.45 0.65 0.49
StdDev 1.07 1.11 0.28 0.33 1.07 1.12 0.28 0.3
σ2 1.15 1.23 0.08 0.11 1.15 1.25 0.8 0.09
DF
PCC
p
T
Tcrit
1372
0.04
4.2 · 10−108
24
1.96
197
0.12
3 · 10−22
10.9
1.97
1485
0.06
1.1 · 10−26
10.9
1.96
207
0.041
3 · 10−8
5.76
1.97
Table 1: Results of t-tests of hypotheses, H, for paired two sample for means for two-tail distribution, for dependent variable specified in the column Var (either C or P) whose measurements are reported in the following columns. Extremal values, Median, Means, µ, standard deviation, StdDev, variance, σ2 , degrees of freedom, DF, and the pearson correlation coefficient, PCC, are reported along with the results of the evaluation of the hypotheses, i.e., statistical significance, p, and the T statistics.
5.6 Tasks The following three tasks are examples from the set of 15 tasks we used in our experiment. • Implement a module for reading and playing midi files8 . • Implement a module that adjusts different parameters of a picture, including brightness, contrast and white balance9 . • Build a program for managing USB devices. The program should implement routines such as opening, closing, writing and reading from an USB device10 .
5.7 Threats to Validity In this section, we discuss threats to the validity of this experiment and how we address these threats.
5.7.1 Internal Validity Internal validity refers to the degree of validity of statements about cause-effect inferences. In the context of our experiment, threats to internal validity come from confounding the effects of differences among participants, tasks, and time pressure. Participants. Since evaluating hypotheses is based on the data collected from participants, we identify two threats to internal validity: C++ proficiency and motivation of participants. Even though we selected participants who have working knowledge of C++ as it was documented by human resources, we did not conduct an independent assessment of how proficient these participants are in C++. This threat is mitigated by the fact that out of 44 participants from Accenture, 31 have worked on successful commercial projects as C++ programmers for more than two years. The other threat to validity is that not all participants could be motivated sufficiently to evaluate retrieved code fragments or functions. We addressed this threat by asking participants to explain in a couple of sentences why they chose to assign certain confidence level to retrieved, and we discarded 27 results for all search engines that were not properly explained. Time pressure. Each experiment lasted for two hours. For some participants, this was not enough time to explore all 50 retrieved code fragments for five tasks (ten results for each of five tasks). Therefore, one threat to validity is that some participants could try to accomplish more tasks by shallowly evaluating retrieved code 8 http://www.codeproject.com/Messages/1427393/How-Can-I-
Read-Midi-File.aspx 9 http://www.codeguru.com/forum/showthread.php?t=432339 10 http://www.cplusplus.com/forum/general/25172/
fragments and functions. To counter this threat we notified participants that their results would be discarded if we did not see sufficient reported evidence of why they evaluated retrieved code fragments and functions with certain confidence levels. Sensitivity of Portfolio. Recovering functional dependencies automatically introduces imprecision, since it is an undecidable problem to recover precise functional dependencies in the presence of dynamic dispatch and functional pointers [18]. Since the precision of Portfolio depends on the quality of recovered functional dependencies, we conducted an evaluation of these recovered dependencies with twelve graduate computer science students at DePaul university. We randomly selected a representative sample of 25 different projects in Portfolio and we asked these students to manually inspect source code of these projects to determine the precision of FCG computed in Portfolio. The results of this evaluation show that the precision of recovered functional dependencies is approximately 76%. While the precision appears to be somewhat lower than desired, it is known that Pagerank is resilient to incorrect links. Link farms, for example, are web spam where people create fake web sites that link to one another in an attempt to skew the PageRank vector. It is estimated that close to 20% of all links on the Internet are spam [11, 28, 1]. However, it is shown that the PageRank vector is not affected significantly by these spam links since its sensitivity is controlled by different factors, one of which is teleportation parameter [9]. To evaluate the effect of incorrect links on Pagerank vector we conducted experiments where we randomly modified 25% and 50% of links between functions. Our results show that the metric length of the Pagerank vector (computed as the square root of the sum of squares of its components) changes only by approximately 7% for 50% of perturbed functional dependencies. A brief explanation is that by adding or removing a couple of links to functions that are either well-connected or not connected at all, their Pagerank score is not strongly affected. Investigating the sensitivity of Portfolio as well as improving recovery of functional dependencies is the subject of future work.
5.7.2 External Validity To make the results of this experiment generalizable, we must address threats to external validity, which refer to the generalizability of a casual relationship beyond the circumstances of our experiment. The fact that supports the validity of this experimental design is that the participants are highly representative of professional C/C++ programmers. However, a threat to external validity concerns the usage of search tools in the industrial settings, where requirements are updated on a regular basis. Programmers use
C/C++ Experts Yes No Total
Cs - Level 1 Google Koders Portf 450 269 130 222 131 56 672 400 186
Cs - Level 2 Google Koders Portf 178 252 185 79 101 92 257 353 277
Cs - Level 3 Google Koders 189 272 65 108 254 380
Portf 229 106 335
Cs - Level 4 Google Koders 139 247 49 98 188 345
Portf 339 135 474
Total 2,879 1,242 4,121
Table 2: The numbers of the different levels of confidence, C for participants with and without expert C/C++ experience.
these updated requirements to refine their queries and locate relevant code fragments or functions using multiple iterations of working with search engines. We addressed this threat only partially, by allowing programmers to refine their queries multiple times. In addition, participants performed multiple searches using different combinations of keywords, and they select certain retrieved code fragments or functions from each of the search results. We believe that the results produced by asking participants to decide on keywords and then perform a single search and rank code fragments and functions do not deviate significantly from the situation where searches using multiple (refined) queries are performed. Another threat to external validity comes from different sizes of software repositories. Koders.com claims to search more than 3 Billion LOC, which is also close to the number of LOC reported by Google Code Search. Even though we populated Portfolio’s repository with close to 270 Mil LOC, it still remains a threat to external validity.
6.
RESULTS
In this section, we report the results of the experiment and evaluate the hypotheses. We use one-way ANOVA, t-tests for paired two sample for means, and χ2 to evaluate the hypotheses that we stated in Section 5.4.
6.1 Testing the Null Hypothesis We used ANOVA to evaluate the null hypothesis H0 that the variation in an experiment is no greater than that due to normal variation of individuals’ characteristics and error in their measurement. The results of ANOVA confirm that there are large differences between the groups for C with F = 261.3 > Fcrit = 3 with p ≈ 5 · 10−108 which is strongly statistically significant. The mean C for the Google Code Search is 1.97 with the variance 1.14, which is smaller than the mean C for Koders, 2.45 with the variance 1.26, and it is smaller than the mean C for Portfolio, 2.86 with the variance 0.99. Also, the results of ANOVA confirm that there are large differences between the groups for P with F = 52.5 > Fcrit = 3.01 with p ≈ 8.6 · 10−22 which is strongly statistically significant. The mean P for the Google Code Search is 0.35 with the variance 0.1, which is smaller than the mean P for Koders, 0.49 with the variance 0.09, and it is smaller than the mean P for Portfolio, 0.65 with the variance 0.07. Based on these results we reject the null hypothesis and we accept the alternative hypothesis H1 . A statistical summary of the results of the experiment for C and T (median, quartiles, range and extreme values) is shown as boxand-whisker plots in Figure 5(a) and Figure 5(b) correspondingly with 95% confidence interval for the mean. Even though the numbers of sample sizes are slightly different since some users missed one experiment, we replaced missing values with their averages. Even though replacing missing data introduces an error, given extremely low values of p, this error is highly unlikely to affect our results.
6.2 Comparing Portfolio with Google To test the null hypothesis H1 and H2 we applied two t-tests for two paired sample means, in this case C and P for participants who used Google Code Search and Portfolio. The results of this test for C and for P are shown in Table 1. The column Samples shows different values that indicate that not all 49 participants participated in all experiments (three different participants missed two different experiments). Based on these results we reject the null hypotheses H1 and H2 and we accept the alternative hypotheses that states that participants who use Portfolio report higher relevance and precision on finding relevant functions than those who use Google Code Search.
6.3 Comparing Portfolio with Koders To test the null hypotheses H3 and H4, we applied two t-tests for two paired sample means, in this case C and P for participants who used Portfolio and Koders. The results of this test for C and for P are shown in Table 1. Based on these results we reject the null hypotheses H3 and H4 that say that participants who use Portfolio report higher relevance and precision on finding relevant functions than those who use Koders.
6.4 Experience Relationships We construct contingency tables to establish a relationship between C for participants with (2+ years) and without (less than 2 years) expert C++ experience who use different search engines. These tables are retrieved from the table that is shown in Table 2 that shows the numbers of the different levels of confidence, C for participants with and without expert C/C++ experience. To test the null hypotheses that the categorical variable C is independent from the categorical variable Java experience, we apply three χ2 -tests, χ2G , χ2K , and χ2P for the search engines Google, Koders, and Portfolio respectively. We obtain χ2G ≈ 6.7 for p < 0.09, χ2K ≈ 2.6 for p < 0.47, and χ2P = 2.09 for p < 0.56. The insignificant values of χ2 and large values of p > 0.05 allow us to accept these null hypotheses suggesting that there is no statistically strong relationship between expert C++ programming experiences of participants and the values of reported Cs for the code search engines Google Code Search, Koders, and Portfolio.
6.5 Usefulness of Visualization Thirty three participants reported that the visualization of functional dependencies in Portfolio is useful and helped them to evaluate potential reuse of retrieved functions, while 12 respondents did not find this visualization useful. Out these 33 participants who found it useful, 27 had more than one year of C++ experience, while out of these 12 participants who did not find this visualization useful, only two had more than one year of C++ experience.
7. RELATED WORK Different code mining techniques and tools have been proposed to find relevant software components as it is shown in Table 3.
CodeFinder iteratively refines code repositories in order to improve the precision of returned software components [12]. Unlike Portfolio, CodeFinder heavily depends on the descriptions (often incomplete) of software components to use word matching, while Portfolio uses Pagerank and SANs to help programmers navigate and understand usages of retrieved functions. Codebroker system uses source code and comments written by programmers to query code repositories to find relevant artifacts [37]. Unlike Portfolio, Codebroker is dependent upon the descriptions of documents and meaningful names of program variables and types, and this dependency often leads to lower precision of returned projects. Even though it returns code snippets rather than functions, Mica is similar to Portfolio since it uses API calls from Java Development Kit to guide code search [32]. However, Mica uses help documentation to refine the results of the search, while Portfolio automatically retrieves functions from arbitrary code repositories and it uses more sophisticated models to help programmers evaluate the potential of code reuse faster and a with higher precision. Exemplar, SNIFF, and Mica use documentation for API calls for query expansion [10, 32, 3]. SNIFF then performs the intersection of types in these code chunks to retain the most relevant and common part of the code chunks. SNIFF also ranks these pruned chunks using the frequency of their occurrence in the indexed code base. In contrast to SNIFF, Portfolio uses navigation and association models that reflect behavior of programmers and improve the precision of the search engine. In addition, Portfolio offers a visualization of usages of functions that it retrieves automatically from existing source code, thus avoiding the need for third-party documentation for API calls. Web-mining techniques have been applied to graphs derived from program artifacts before. Notably, Inoue et al. proposed Component Rank[16] as a method to highlight the most-frequently used classes by applying a variant of PageRank to a graph composed of Java classes and an assortment of relations among them. Quality of match (QOM) ranking measures the overall goodness of match between two given components [33], which is different from Portfolio in many respects, one of which is to retrieve functions based on surfing behavior of programmers and associations between concepts in these functions. Gridle[24] also applies PageRank to a graph of Java classes. In Portfolio, we apply PageRank to a graph with nodes as functions and edges as call relationships among the functions. In addition, we use spreading activation on the call graph to retrieve chains of relevant function invocations, rather than single fragments of code. Programming task-oriented tools like Prospector, Hipikat, Strathcona, and xSnippet assist programmers in writing complicated code [21, 7, 14, 27]. However, their utilities are not applicable when searching for relevant functions given a query containing high-level concepts with no source code. Robillard proposed an algorithm for calculating program elements of likely interest to a developer [26]. Portfolio is similar to this algorithm in that it uses relations between functions in the retrieved projects to compute the level of interest (ranking) of the project, however, Robillard does not use models that reflect the surfing behavior of programmers and association models that improve the precision of search. We think there is a potential in exploring connections between Robillard’s approach and Portfolio. S6 is a code search engine that uses a set of user-guided program transformations to map high-level queries into a subset of relevant code fragments [25], not necessarily functions. Like Portfolio, S6 uses query expansion, however, it requires additional low-level details from the user, such as data types of test cases.
Approach
Granularity Unit Usage
AMC [13] CodeBroker [37] CodeFinder [12] CodeGenie [20] Exemplar [10] Google Code Search Gridle [24] Hipikat [7] Koders Krugle MAPO [38] Mica [32] ParseWeb [34] Portfolio Prospector [21] S6 [25] SNIFF [3] Sourceforge Sourcerer [23] SPARS-J [15][16] SpotWeb [35] Strathcona [14] xSnippet [27]
U P,U F,U P A U U P U U F U,F U,F F,P F F,P,U F,U A F,P,U F U F F
N Y Y N Y N N Y N N N Y N Y N Y Y N Y Y N Y Y
Search Method
Result
W W,Q W,Q W W,Q W W W,Q W W W,Q W,Q W,Q P,S,W T W,Q T,W W P,W P W W T,W
T T T T T T T T T T T T T G T T T T T T T T T
Table 3: Comparison of Portfolio with other related approaches. Column Granularity specifies how search results are returned by each approach (Projects, Functions, or Unstructured text), and if the usage of these resulting code units is shown (Yes or No). The column Search Method specifies the search algorithms or techniques that are used in the code search engine, i.e., Pagerank, Spreading activation, simple Word matching, parameter Type matching, or Query expansion techniques. Finally, the last column tells if the search engine shows a list of code fragments as Text or it uses a Graphical representation of search results to illustrate code usage for programmers.
8. CONCLUSION We created an approach called Portfolio for finding highly relevant functions and projects from a large archive of C/C++ source code. In Portfolio, we combined various natural language processing (NLP) and indexing techniques with a variation of PageRank and spreading activation network (SAN) algorithms to address the need of programmers to reuse retrieved code as functional abstractions. We evaluated Portfolio with 49 professional C/C++ programmers and found with strong statistical significance that it performed better than Google Code Search and Koders in terms of reporting higher confidence levels and precisions for retrieved C/C++ code fragments and functions. In addition, participants expressed strong satisfaction with using Portfolio’s visualization technique since it enabled them to assess how retrieved functions are used in contexts of other functions.
Acknowledgments We warmly thank nine graduate students, Luca DiMinervino, Arunrajkumar Dharumar, Rohan Dhond, Sekhar Gopisetty, Hariharan Subramanian, Ameya Barve, Naresh Regunta, Ashim Shivhare, Denzil Rodrigues, from the University of Illinois at Chicago who contributioned to Portfolio as part of their work towards the com-
pletion of thier Master of Science in Computer Science degrees. We also thank Bogdan Dit from the College of William and Mary for his help in building parts of Portfolio. We are grateful to the anonymous ICSE’11 reviewers for their relevant and useful comments and suggestions, which helped us to significantly improve an earlier version of this paper. This work is supported by NSF CCF-0916139, CCF-0916260, and Accenture.
9.
[20]
[21]
REFERENCES
[1] L. Becchetti, C. Castillo, D. Donato, R. Baeza-YATES, and S. Leonardi. Link analysis for web spam detection. ACM Trans. Web, 2(1):1–42, 2008. [2] S. Brin and L. Page. The anatomy of a large-scale hypertextual web search engine. Computer Networks, 30(1-7):107–117, 1998. [3] S. Chatterjee, S. Juvekar, and K. Sen. Sniff: A search engine for java using free-form queries. In FASE, pages 385–400, 2009. [4] A. M. Collins and E. F. Loftus. A spreading-activation theory of semantic processing. Psychological Review, 82(6):407 – 428, 1975. [5] T. A. Corbi. Program understanding: Challenge for the 1990s. IBM Systems Journal, 28(2):294–306, 1989. [6] F. Crestani. Application of spreading activation techniques in information retrieval. Artificial Intelligence Review, 11(6):453–482, 1997. [7] D. Cubranic, G. C. Murphy, J. Singer, and K. S. Booth. Hipikat: A project memory for software development. IEEE Trans. Software Eng., 31(6):446–465, 2005. [8] J. W. Davison, D. Mancl, and W. F. Opdyke. Understanding and addressing the essential costs of evolving systems. Bell Labs Technical Journal, 5(2):44–54, 2000. [9] D. F. Gleich, P. G. Constantine, A. D. Flaxman, and A. Gunawardana. Tracking the random surfer: empirically measured teleportation parameters in pagerank. In WWW, pages 381–390, 2010. [10] M. Grechanik, C. Fu, Q. Xie, C. McMillan, D. Poshyvanyk, and C. M. Cumby. A search engine for finding highly relevant applications. In ICSE (1), pages 475–484, 2010. [11] Z. Gyöngyi and H. Garcia-Molina. Link spam alliances. In VLDB ’05, pages 517–528. VLDB Endowment, 2005. [12] S. Henninger. Supporting the construction and evolution of component repositories. In ICSE, pages 279–288, 1996. [13] R. Hill and J. Rideout. Automatic method completion. In ASE, pages 228–235, 2004. [14] R. Holmes and G. C. Murphy. Using structural context to recommend source code examples. In ICSE, pages 117–125, 2005. [15] K. Inoue, R. Yokomori, H. Fujiwara, T. Yamamoto, M. Matsushita, and S. Kusumoto. Component rank: Relative significance rank for software component search. In ICSE, pages 14–24, 2003. [16] K. Inoue, R. Yokomori, T. Yamamoto, M. Matsushita, and S. Kusumoto. Ranking significance of software components based on use relations. IEEE Trans. Softw. Eng., 31(3):213–225, 2005. [17] C. W. Krueger. Software reuse. ACM Comput. Surv., 24(2):131–183, 1992. [18] W. Landi. Undecidability of static analysis. LOPLAS, 1(4):323–337, 1992. [19] A. N. Langville and C. D. Meyer. Google’s PageRank and
[22]
[23]
[24]
[25] [26] [27] [28]
[29]
[30]
[31]
[32]
[33]
[34]
[35]
[36]
[37]
[38]
Beyond: The Science of Search Engine Rankings. Princeton University Press, Princeton, NJ, USA, 2006. O. A. L. Lemos, S. K. Bajracharya, J. Ossher, R. S. Morla, P. C. Masiero, P. Baldi, and C. V. Lopes. Codegenie: using test-cases to search and reuse source code. In ASE ’07, pages 525–526, New York, NY, USA, 2007. ACM. D. Mandelin, L. Xu, R. Bodík, and D. Kimelman. Jungloid mining: helping to navigate the API jungle. In PLDI, pages 48–61, 2005. C. D. Manning, P. Raghavan, and H. Schtze. Introduction to Information Retrieval. Cambridge University Press, New York, NY, USA, 2008. J. Ossher, S. Bajracharya, E. Linstead, P. Baldi, and C. Lopes. Sourcererdb: An aggregated repository of statically analyzed and cross-linked open source java projects. MSR, 0:183–186, 2009. D. Puppin and F. Silvestri. The social network of java classes. In SAC ’06, pages 1409–1413, New York, NY, USA, 2006. ACM. S. P. Reiss. Semantics-based code search. In ICSE, pages 243–253, 2009. M. P. Robillard. Automatic generation of suggestions for program investigation. In ESEC/FSE, pages 11–20, 2005. N. Sahavechaphan and K. T. Claypool. XSnippet: mining for sample code. In OOPSLA, pages 413–430, 2006. H. Saito, M. Toyoda, M. Kitsuregawa, and K. Aihara. A large-scale study of link spam detection by graph algorithms. In AIRWeb ’07, pages 45–48, New York, NY, USA, 2007. ACM. J. Sillito, G. C. Murphy, and K. De Volder. Asking and answering questions during a programming change task. IEEE Trans. Softw. Eng., 34(4):434–451, 2008. J. Sillito, G. C. Murphy, and K. D. Volder. Questions programmers ask during software evolution tasks. In SIGSOFT FSE, pages 23–34, 2006. S. Sim, C. Clarke, and R. Holt. Archetypal source code searches: A survey of software developers and maintainers. ICPC, 0:180, 1998. J. Stylos and B. A. Myers. A web-search tool for finding API components and examples. In IEEE Symposium on VL and HCC, pages 195–202, 2006. N. Tansalarak and K. T. Claypool. Finding a needle in the haystack: A technique for ranking matches between components. In CBSE, pages 171–186, 2005. S. Thummalapenta and T. Xie. Parseweb: a programmer assistant for reusing open source code on the web. In ASE ’07, pages 204–213, New York, NY, USA, 2007. ACM. S. Thummalapenta and T. Xie. Spotweb: Detecting framework hotspots and coldspots via mining open source code on the web. In ASE ’08, pages 327–336, Washington, DC, USA, 2008. IEEE Computer Society. I. H. Witten, A. Moffat, and T. C. Bell. Managing Gigabytes: Compressing and Indexing Documents and Images, Second Edition. Morgan Kaufmann, 1999. Y. Ye and G. Fischer. Supporting reuse by delivering task-relevant and personalized information. In ICSE, pages 513–523, 2002. H. Zhong, T. Xie, L. Zhang, J. Pei, and H. Mei. MAPO: Mining and recommending API usage patterns. In ECOOP 2009, July 2009.