AbstractâWe present a method to estimate the coverage areas of transmitters, and a method to use a database of such coverage areas for personal positioning.
Positioning with coverage area estimates generated from location fingerprints Laura KOSKI1 , Robert PICHÉ1 , Ville KASEVA2, Simo ALI-LÖYTTY1 , and Marko HÄNNIKÄINEN2 1
Department of Mathematics, Tampere University of Technology, Finland Department of Computer Systems, Tampere University of Technology, Finland Emails: {laura.koski, robert.piche, ville.a.kaseva, simo.ali-loytty, marko.hannikainen}@tut.fi 2
In many positioning methods, position accuracy depends highly on the environment, because they require line of sight conditions to ensure acceptable accuracy. This requirement is not always met in indoor and urban environments. Location fingerprinting differs from these location methods, because it takes into account the effects that obstructions and reflecting objects will have on radio signals. This makes location fingerprinting method more detailed, precise and reliable in complex environments. Drawbacks in fingerprinting method is the need to perform extensive data collecting, the size and the location of database can impact cost and accuracy. In location fingerprinting, accuracy is good when radio map is up-to-date but degrades with time because landscape changes constantly [13, 14]. Fingerprinting method is proposed to be standardized and the work will start most likely in early 2010 in Open Mobile Alliance (OMA) [15–18]. Various standardized location methods already exist for cellular networks, like time difference of arrival (TDOA), assisted GPS (A-GPS), cell identity (CID) and enhanced CID (ECID), where in addition to CID, some supplementary information, like timing advance (TA), round trip time (RTT), RSS or neighboring CID, is utilized in positioning [19–21]. In this work, we use fingerprint database to construct a statistical model of the coverage area of a wireless CN and use this model to locate a UE. Here, coverage area means the region in the plane where signals from the CN can be received by the network user. In this work, coverage areas are modeled as ellipses. The coverage area is modeled by computing a posterior distribution of the ellipse’s parameters using Bayes’ rule. The Bayesian prior is used to model information about “typical” coverage areas. This information is especially important when the fingerprint database contains only a few observations from a CN. The location is then estimated using coverage area data and using Bayes’ rule. Ellipses are chosen because they allow closed-form solution in both the model and location estimation and because only five parameters need to be stored in the radio map for each CN. Other shapes could also be chosen, like polygons or circles. Circles are special cases of ellipses, requiring only three parameters per CN. A polygon needs six (for an arbitrary triangle) or more parameters per CN. The positioning algorithm presented in this paper is tested using a prototype indoor Wireless Sensor Network developed at the Department of Computer Systems of Tampere University
Abstract—We present a method to estimate the coverage areas of transmitters, and a method to use a database of such coverage areas for personal positioning. The coverage areas are modelled as ellipsoids, and their location and shape parameters are computed from reception samples (fingerprints) using Bayesian estimation. The position is computed as a weighted average of the ellipsoid centers, with weights determined by the ellipsoid shape parameters. The methods are tested using a subset of a prototype wireless sensor network (TUTWSN) consisting of 30 nodes deployed indoors on one floor of a university building. The network nodes use low power commercial off-the-shelf components including a 2.4 GHz radio.
I. I NTRODUCTION Location fingerprinting is a general term for positioning methods that determine user’s location using databases of radio signal measurements. A “fingerprint” includes the location of the user equipment (UE) and may include time stamp of arrival and a set of radio characteristics records from a variety of radio networks, like received signal strength (RSS) and identifier of the transmitter e.g. identity of a communication node (CN). CN may be a radio station, a TV station, a cellular network base station, a WLAN access point or some other sensor node in a wireless network. A UE may be a laptop, a mobile phone, or any other device connected to a wireless network. Fingerprinting-based methods for locating a UE are widely studied and a variety of fingerprinting based location methods have been presented, like Database Correlation Method (DCM) [1–4], RADAR [5], HORUS [6]. Also commercial technologies are available, like Polaris Wireless [7], Place Lab [8], Navizon [9] and Skyhook [10]. There are also some survey studies of fingerprinting methods [11, 12]. Location fingerprinting consists of two phases, an offline data collecting phase and an online positioning phase. In the data collecting phase, fingerprints may be measured at various locations using positioning-capable UE [1, 2, 5], or generated using a radio propagation model [3, 4]. A radio propagation model that is calibrated using measurements can be viewed as a combination of these techniques. The fingerprint database is processed and used to generate a radio map, which provides information about radio signal properties as a function of position. A radio map may be for example a database of coverage area information, as in this work, or just a database of radio characteristic records at points of a spatial grid [5]. In the positioning phase, a UE samples measurements from CNs and computes user’s location using the radio map.
978-1-4244-7157-7/10/$26.00 ©2010 IEEE
99
of Technology [22]. TUTWSN is targeted for low data rate applications and its main design objectives have been unlimited scalability and low energy consumption. The nodes are built using low power commercial off-the-shelf components. Each node includes a 2.4 GHz radio and can carry a multitude of sensors. This paper is organized as follows. In Section II, a Bayesian method for estimating coverage area of CNs using a set of location reports is presented. In Section III, a Bayesian method for estimating a position using the coverage area information is presented. Section IV introduces TUTWSN design. The test results are presented in Section V. II. E STIMATING C OVERAGE
AREAS
and where m is a p-variate known vector, a > 0 and v ≥ p are fixed constants and B is a p×p positive definite symmetric matrix. Thus µ|Σ ∼ Np (µ, a1 Σ) and Σ ∼ W−1 p (B, v), where W−1 denotes inverse-Wishart distribution. p The joint posterior density for parameters (µ, Σ) can be found using Bayes’ formula and multiplying (3) and (5) p(µ, Σ|Y) ∝ p(Y|µ, Σ)p(µ, Σ)
� � 1 ∝ |Σ|−(n+v+p+1)/2 exp − tr Σ−1 Q , 2
where
� 1 YT 1n + am , n+a a ˆ = n + a, ˆ = YT Y + B + ammT − a ˆm ˆ T. S ˆm
ˆ = m
Y = 1n µT + ǫ,
(1)
where Y is an n × p matrix representing n mutually independent observations of the p-dimensional location, 1n is an n-variate vector of ones, µ is a p-variate vector of coordinates, and ǫ is an n× p matrix of errors. Let ǫ(i) denote the (column) vector formed by taking the transpose of the ith row of matrix ǫ. It is assumed that the error vectors i = 1, . . . , n,
(2)
are, for given µ and Σ, independent and normally distributed with zero mean and variance Σ, that is, ǫ(i) |µ, Σ ∼ Np (0p , Σ). Then the likelihood function of (µ, Σ) is p(Y|µ, Σ) −n/2
∝ |Σ|
�
� 1 −1 T T T exp − tr Σ (Y − 1n µ ) (Y − 1n µ ) . 2 (3)
The likelihood can be rewritten as p(Y|µ, Σ)
� � 1 ˆ ˆ T + S) ∝ |Σ|−n/2 exp − tr Σ−1 (n(µ − µ)(µ − µ) 2 � � (4) 1 −n/2 −1 ∝ |Σ| exp − tr Σ S × 2 � � 1 −1 T ˆ ˆ exp − tr nΣ (µ − µ)(µ − µ) , 2 1 T n 1n Y is the least squares ˆ T )T (Y − 1n µ ˆ T ) = YT Y 1n µ
ˆ = where µ estimator of µ ˆµ ˆ T is the and S = (Y − − nµ residual sum of squares. Using the natural conjugate prior for parameters (µ, Σ), which is the normal-inverse-Wishart distribution [23], namely p(µ, Σ) = p(µ|Σ)p(Σ), where
�
ˆ ˆ ˆ T + S, Q=a ˆ(µ − m)(µ − m)
in which
The measurement model can be written as
ǫ(i) = Y(i) − µ
(8)
Also the joint posterior density is a normal-inverse-Wishart distribution. The marginal posterior density p(µ|Y) can be derived by integrating p(µ, Σ|Y) with respect to Σ: Z p(µ|Y) = p(µ, Σ|Y) d Σ h i−(n+v)/2 ˆ−1 (µ − m) ˆ Ta ˆ ∝ 1 + (µ − m) ˆS , (9) which follows the p-variate Student’s t-distribution, that is � � 1 ˆ ˆ µ|Y ∼ tp m, S, n + v − p . a ˆ(n + v − p)
The marginal posterior density p(µ|Y) can be derived by integrating p(µ, Σ|Y) with respect to µ: Z p(Σ|Y) = p(µ, Σ|Y) d µ � � 1 −(n+v+p)/2 −1 ˆ ∝ |Σ| exp − tr Σ S , (10) 2 which follows the inverse-Wishart distribution, that is � � ˆ n+v−1 . Σ|Y ∼ W−1 S, p The posterior distribution of parameters µ and Σ contains all relevant inference about the parameters. For our model, the coverage area estimate is completely specified by the posterior means [24, 25]
(5) �
1 p(µ|Σ) ∝ exp − tr Σ−1 a(µ − m)(µ − m)T , 2 � � 1 p(Σ) ∝ |Σ|−(v+p+1)/2 exp − tr BΣ−1 , 2
(6) (7)
ˆ and E(µ|Y) = m
(11)
1 ˆ E(Σ|Y) = S. n+v−p−2
(12)
The posterior means can be computed from measurement data in a recursive fashion, see [26] for details. For p = 2, the parameters µ and Σ can be interpreted as the center and shape matrix for an ellipse. This ellipse, with Σ suitable scaled, represents the area wherein a fingerprint observations has a certain likelihood of occurring. If the
100
measurement campaign used locations uniformly distributed in the plane, then this can be considered a model of CN’s reception area. On the other hand if fingerprint data is, say, collected by polling GNSS-equipped UEs, then what we have is a model of the most likely locations of users within range of the CN. These users are likely to be concentrated in city centers and on roads. Such a model may be useful if the objective is to provide good positioning accuracy to the majority of users, rather than good accuracy at all locations. III. P OSITIONING Now we present a Bayesian method for determining a position estimate for an UE using a CN coverage area model. Let c = (ci1 , ci2 , . . . , cin ) be the list of CNs heard by the UE and let p denote a p-variable vector containing the coordinates of the UE position. For convenience, we assume that sufficient training data has been collected that the ith coverage area parameters µi and Σi can be treated as known. We also assume that p(ci ∈ c|p) ∝ pN(µi ,Σi ) (p)
(13)
that is, the probability that a UE located at p hear the ith CN is proportional to the probability density function for the location p of a UE in the ith coverage area. Assuming that observations are mutually independent given p the likelihood functioin for p can be formed p(c|p) =
n Y i=1 n Y
p(ci ∈ c|p)
� 1 T −1 ∝ exp − (p − µi ) Σi (p − µi ) 2 i=1 � � 1 ¯ )T C−1 (p − p ¯) , ∝ exp − (p − p 2 in which ¯= p
n X i=1
!−1 Σ−1 i
�
n X i=1
! Σ−1 i µi
and C =
n X
(14)
!−1 Σ−1 i
.
i=1
Using conjugate prior, which is normal p ∼ Np (µ0 , Σ0 ), the posterior density becomes p(p|c) ∝ p(p)p(c|p) � � 1 ˆ −1 (p − p ˆ )T C ˆ) , ∝ exp − (p − p 2
prior
A weakness of the model is the assumption that the observations, that is, the ellipses of the CNs, are mutually independent and the reception probability follows a gaussian law. In some cases this assumption may be misleading. Suppose, for example, that we have n observations with the coverage area of the observations are identically distributed with the same parameters µ and Σ. Then the position estimate is the center µ of coverage area, as one may expect, but the uncertainty of position estimate is no longer Σ, but has decreased to n1 Σ. A more general approach would be to take all CNs in the radio map into account, instead of just using the list of heard CNs. It could be namely expected that if some CN is not heard in location p then the probability of not being in its coverage area is large. In this work this information is not taken into account. One reason for this is that in our tests the UE reports at most two heard CN, so nonmembership in the list is not so informative. Another reason is that convenient closed-form solutions are not available for such data. The posterior could, in principle, be computed by MCMC methods, say, but the computational burden would be huge compared to the algorithms that we have presented. IV. TUTWSN The Tampere University of Technology Wireless Sensor Network (TUTWSN) employs clustered network topology where each cluster consists of one cluster headnode and several subnodes (Fig. 1). Cluster headnodes are responsible for data routing over multiple hops. Subnodes can communicate only with their own cluster head. If required by the application, all nodes can be configured as headnodes resulting in a flat communication topology. Data is forwarded towards one or more sinknodes, which are used as gateways to interface TUTWSN to other networks such as the Internet. A database server is used to collect the data sensed by the WSN. The server provides an interface for monitoring and management User Interfaces (UIs) to query the database contents and to send commands to the WSN. The TUTWSN protocol stack consists of sensor node applications, TUTWSN Application Programming Interface (API) [27], TUTWSN Routing (TUTWSNR) [28], and TUTWSN Medium Access Control (MAC)[29]. A. Routing
(15)
ˆ which is a normal density N (ˆ p, C), � � p Pn −1 −1 Pn −1 ˆ= where p and i=0 Σi i=0 Σi µi � ˆ = Pn Σ−1 −1 . So our position estimate is a weighted C i=0 i mean and weights are inverses of covariance matrices. If no prior information about the position estimate is known then it is justified to use a prior with large covariance. In that case the prior distribution approaches the uniform distribution over the whole space. When prior covariance is large, the inverse of covariance approaches the zero matrix, and the effect of the prior on the posterior mean vanishes.
TUTWSNR is a cost-aware routing protocol including several cost metrics. Traffic can be differentiated by choosing between end-to-end delay, bandwidth, reliability, and individual route or overall network energy. Several cost functions with individual routes for every function are supported. TUTWSNR uses sink initiated route discovery for fast network build-up. It includes the flooding of a route advertisement packet originated in the sink. If during this procedure a node finds a route with smaller cost than the current route, it redirects its routing gradient and forwards the route advertisement with updated costs to its neighbors. Node initiated route discovery is used for route maintenance. This adds robustness and allows node mobility. Node
101
Cluster headnode
Gateway node
Subnode Network interface
Sink
Internet or intranet
Monitoring UI
Database server Cluster Inter-cluster communication link
Management UI
Intra-cluster communication link Figure 1.
TUTWSN topology and its utilization architecture.
Network beacons initiated route discovery happens at node start up, when next hop links are lost, or when neighbors change. It includes the transmission of a route request to one hop neighbors followed Network by a reply in the form of a route advertisement from the channel neighbors having valid routes to the sink. time Active Active A sink requests data from the network by flooding interests in the reverse direction of the route gradients formed by the Cluster SuperSuperIdle Idle frame frame route discovery. Current interests are maintained by the nodes channel similarly as in route discovery by exchanging interest requests time Access cycle and interest advertisements. Thus, the interests are exchanged ALOHA Reservable only on-demand and no polling is required. time slots time slots When routing data to the sink the next hop is chosen by Cluster beacon minimizing a cost function including the cost metrics and their respective scaling factors. The cost advertised to neighbors is cumulated along the routing gradient as on every hop nodes Figure 2. TUTWSN MAC signaling and superframe structure. add their local cost to the overall advertised cost.
B. MAC protocol TUTWSN MAC offers an energy-efficient way to access the wireless medium. For data forwarding from headnodes to the sink, a multi-cluster tree, consisting of several super-positioned cluster-tree structures, is used. It combines the energy-efficient data routing capabilities of a cluster-tree topology with the flexibility of a mesh topology. For media access TUTWSN MAC uses reservation based time-slotted data exchanges. Each access cycle is divided into an active period (superframe) and an idle period during which nodes are in a power saving state. Data is exchanged in the superframes (Fig. 2), which consist of cluster beacons, ALOHA slots, and reserved slots. The cluster beacons signal slot reservations and synchronize data exchanges. ALOHA slots are used for slot reservation, cluster association, and low-priority data transfer. The reserved slots provide reliable data transfer with a fixed throughput. The cluster beacons are transmitted with varying transmission powers for link quality estimation without Received Singal Strength Indicator (RSSI) hardware. The energy cost of listening cluster beacons is minimized by restricting the
beacon amount to two. The full range of transmission powers can still be utilized by circulating the first beacon transmission power and sending the second beacon with maximum power to achieve maximum range and connectivity. To minimize inter-cluster inference, neighboring clusters use separate frequency channels. Inter-cluster communication used in multi-hop data transfer occurs at source headnode idle time in the destination headnode superframe. A source headnode acts as a cluster member to the destination headnode similarly as subnodes in a cluster. Headnodes also transmit more frequent network beacons in a common network channel. The network beacons are used for neighbor discovery by network scans. Also, the neighbors’ neighbors are advertised in the network beacons. With this information mobile nodes can find new neighbors energyefficiently without excessive network scanning [30]. C. Positioning with TUTWSN For positioning, TUTWSN headnodes and sink nodes are used as CNs and subnodes as UEs. In order to communicate its data to a sink a subnode joins at least one cluster. This
102
accelerometer, different motion detectors, and air quality monitoring. To enable the prototype usage as a gateway, it can be equipped with an embedded Ethernet device server that bridges the MCU serial port to Ethernet. V. T ESTS
Figure 4.
TUTWSN prototype platform.
means that it starts to listen to the cluster beacons of the corresponding headnode. Thus, it can continuously record the transmission power the headnode can be reached with. For reliability, a subnode is synchronized to more than one headnode all the time. Thus, the transmission powers from multiple headnodes are recorded simultaneously. The decision as to which headnodes to synchronize to is made by the routing layer according to the advertised costs. A neighbor diagnostics application collects the transmission power data at the subnode and transmits it through the WSN to a server, from which it can be retrieved to be used as input to the positioning algorithm. D. Prototype Network Used in the Experiments A TUTWSN prototype network consisting of approximately 300 nodes has been deployed at TUT for research and teaching purposes. For this work, experiments were conducted indoors on one floor of a building containing classrooms, lecture halls, corridors, and lobby (Fig. 3). The building contains 30 fixed WSN nodes (29 headnodes and one sinknode) which were used as CNs. E. TUTWSN Prototype Platform The TUTWSN prototype platform (Fig. 4) uses a Microchip PIC18F8722 MicroController Unit (MCU), which integrates an 8-bit processor core with 128 kB of FLASH program memory, 4 kB of RAM data memory, and 1 kB EEPROM. The MCU clock speed is 8 MHz resulting in 2 MIPS performance. For wireless communication, the prototype platform uses a Nordic Semiconductor nRF24L01 2.4 GHz radio transceiver having data rate of 1/2 Mbps and 80/40 available frequency channels in the Industrial, Scientific and Medical (ISM) unlicensed radio band. Transmission power level is selectable from four power levels between -18 dBm and 0 dBm with 6 dBm intervals and ±4 dBm accuracy. A multitude of sensors can be integrated into the platform. These include e.g. temperature, humidity, illuminance,
Training data was collected using headnodes to form a radio map. During the data collecting phase every headnode collected fingerprints every five minutes for 48 hours. The incoming fingerprints were downloaded from the Internet. One fingerprint consists of IDs of at most two neighboring headnodes with the corresponding transmission power level p ∈ {0, 1, 2, 3}, the time stamp of the fingerprint, and the coordinates y where the fingerprint was measured. Fingerprints are sorted by headnode IDs and for every headnode ID i, location reports are divided into four subsets Sip = {yj |pj ≤ p} by transmission powers. Thus the subset Si0 contains location reports yj where transmission power pj was equal to zero and the subset Si3 contains all location reports. When a headnode hears a neighboring headnode with a small transmit power, it may be assumed that the headnode is close. When a headnode hears a neighboring headnode with larger transmit power, the headnode may be far away or, if signal is blocked, it may be close. The database D = {Sip |i ∈ ID, p ∈ {0, 1, 2, 3}} is used to form a radio map R, which contains coverage area parameters for each headnode. For every headnode i ∈ ID the radio map contains four elements Ri0 , Ri1 , Ri2 and Ri3 , where Rip = (µpi , Σpi ) contains location and shape parameters of coverage area which are calculated as presented in Section II using data set Sip . The whole radio map is R=
3 [
{Rip |i ∈ ID}.
p=0
For every coverage area estimate, prior distributions were chosen so that expected value for µpi is coordinates of the headnode i and expected value for Σki is a circle with 60meter radius. In testing phase the headnodes were located by turns using neighboring reports heard during the data collecting phase. In the first case all neighboring headnodes heard during the data collecting phase are used in positioning and only coverage area estimates Ri3 are used. In the second case all headnodes heard with transmission power equal to zero is used in positioning and only coverage area estimates Ri0 are used. These can be considered as cases, that network works ideally and reports all neighboring headnodes for every time stamp. But because in real life headnodes reports at most two neighboring headnodes for every time stamp, in the third case headnodes are located using reports heard at the same time stamp. In this case the entire radiomap R is in use which means that transmission power is taken account in position estimation. If, for example, headnode hears a neighboring headnode i with transmission power 2, coverage area estimate Ri2 is used positioning.
103
Sink Headnode
Figure 3.
Test deployment used in the experiments.
Testing was also made by measuring neighboring reports with hand-held subnodes at various test locations. Also in this case at most two neighboring headnode IDs with corresponding transmission powers were reported at one time stamp and the construction of the coverage areas and the positioning was carried out as previously. In addition it was also tested how positioning accuracy changes when transmission power is not taken into account and only coverage area estimates Ri3 are used for every headnode i. There were altogether 25 measurements at 7 test locations. At these test locations positioning is also done using mean of coordinates of headnodes as presented in [31], and using bounding boxes as presented in [32] and results are compared with the coverage area approach. In the bounding box approach coverage areas are modeled to be squares, and position estimate is the midpoint of the intersection of coverage areas. A. Results 1) Positioning the headnodes: It is tested whether the transmission power measurements enhance the positioning using coverage area estimates. The accuracy of the positioning estimate increases when the transmission power is taken into account both in estimating coverage areas and in positioning. The mean error is 10.1 m if the transmission power is not taken into account and 9.0 m if it is taken into account. In the first case, where the transmission power is taken into account, there were an average 12 neighboring headnodes when positioning was made. In the second case, where the transmission power is taken into account the average number of neighboring headnodes was 8. This shows that the ellipseshaped coverage area estimate presented in this work is a good coverage area estimate when UE is close to CN. When distance to CN increases, ellipses are no longer such good coverage area estimates. Mean error in the case when headnodes were located with measurements at same time stamp is 11.2 m. The numerical results for positioning headnodes are shown in Table I. Table I shows that the maximum error increases when only neighbors heard at one time step are used in positioning.
This is because the network does not always report the closest nodes to be the neighboring nodes but uses cost function to decide which the neighboring headnodes are reported as explained in Section IV-A. Table I E RRORS IN HEADNODE POSITIONING Test case All heard, R3i All heard, R0i Heard at same time stamp, R
mean (m) 10.1 9.0 11.2
RMSE (m) 12.2 10.2 13.9
Max (m) 23.3 23.3 53.2
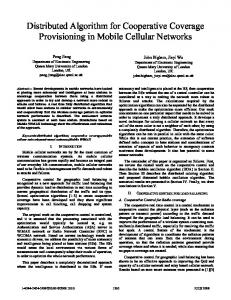
2) Positioning of handheld subnodes: The numerical results for the positioning of a subnode using different algorithms is shown in Table II. It is tested how the position of subnode affects the accuracy. As mentioned earlier, the coverage area estimates presented in this work describe how users are distributed in the coverage area, which is also reflected in the results. Although coverage areas are modeled similarly and positioning is made similarly, there is significant difference in positioning accuracy between the cases when locating headnodes and subnodes at test locations. This is because headnodes are located on walls, as shown in Figure 3, whereas test locations were at the middle of corridors and halls, in the places where people are usually located. There is little difference between positioning accuracy in the cases where the transmission power is taken into account in positioning and the whole radiomap R is in use and in the case where transmission power is not taken onto account and only Ri3 are used. In the case where only Ri3 are used it requires less computations to built a radio map and also storage requirements are only one quarter of what is needed to store the full radio map R. The case where only Ri3 was used outperforms also the case when headnodes were positioned. Table II shows that the positioning using coverage area estimates outperforms the other algorithms in accuracy. Figure 5 shows an example of how locations are estimated. Figure 5 shows that the subnode does not always report closest
104
True position Coverage area Position estimate Bounding box Position estimate Headnodes Position estimate
Figure 5.
Positioning using different algorithms
neighbors and that the coverage area model takes this into account during the data collecting phase. In the coverage area approach, five parameters need to be stored for every coverage area estimate. If positioning is made using only means of headnodes coordinates, then only two parameters need to be stored. In the bounding box approach the radii of the boxes need to be stored in addition to the two headnode location parameters. Computations are more complex in the coverage area approach compared to the other methods. It also takes an effort to build a radio map, but as in this experiment, fingerprint data can be collected using fingerprints collected by headnodes and because the amount of incoming data is large, the radio map can be built already after short data collecting phase. Table II E RRORS IN HANDHELD NODE POSITIONING Test case Coverage area, R Coverage area, R3i Headnode mean Bounding box
mean (m) 8.1 8.7 11.8 10.7
RMSE (m) 9.8 10.7 14.0 12.8
Max (m) 22.8 23.9 30.4 30.4
VI. C ONCLUSION In this paper, a Bayesian framework for estimating the coverage area of a wireless CN is introduced. Also a method for positioning UE using database of coverage areas is presented and is tested using the prototype Tampere University of Technology Wireless Sensor Network (TUTWSN). Different methods to built a radio map were tested and the effect of different coverage area models on the positioning accuracy was studied. Experiments show that transmission power information enhances the coverage area estimates and improves the positioning accuracy. However the improvement in positioning accuracy is slight, so the presented positioning method could be used without RSS in a network such as WLAN where transmission power or signal strength measured by UE is unavailable or receiver-dependent. Also the size of the radio
map is larger when multiple transmission power levels are used when generating radio map so also the storage requirements are larger. Used positioning method outperforms previous methods in accuracy, because it takes into account where users of network who hear the CN are located and does not use only the location of the CN. However, this gain comes at the cost of the data collection and construction of the radio map. The positioning method presented in this work could be used in any type of wireless communication network. It is reliable, because during data collecting phase only IDs of CN is needed to be stored, which is not as dependent on environmental changes as for example signal strength. For that reason it would be of interest to examine how well algorithms work in different networks. Algorithms used in this work are not restricted to only two-dimensional case, and positioning could be done when also height measurements are available. ACKNOWLEDGMENT This research was partly funded by Nokia Inc.. Simo AliLöytty and Ville Kaseva acknowledge the financial support of the Tampere Graduate School in Information Science and Engineering. R EFERENCES [1] H. Laitinen, J. Lähteenmäki, and T. Nordström, “Database correlation method for GSM location,” IEEE 51st VTC, Rhodes, Greece, May 2001. [2] S. Ahonen and H. Laitinen, “Database correlation method for GSM location,” IEEE 57st VTC, Jeju, Rhodes, Greece, April 2003. [3] D. Zimmerman, J. Baumann, A. Layh, F. Landstorter, R. Hoppe, and G. Wölfle, “Database correlation for positioning of mobile terminals in cellular networks using wave propagation models,” IEEE 60th Vehicular Technology Conference, September 2004. [4] R. S. Campos and L. Lovisolo, “A fast database correlation algorithm for localization of wireless network mobile nodes using coverage prediction and round trip delay,” IEEE 69th Vehicular Technology Conference, April 2009. [5] P. Bahl and V. N. Padmanabhan, “Radar: An in-building RF-based user location and tracking system,” Proceedings of the 19th International conference on Computer Communications (InfoCom). IEEE, vol. 2, pp. 775–784, March 2000. [6] M. Youssef and A. Agrawala, “The Horus WLAN location determination system,” MobiSys ’05: Proceedings of the 3rd international conference on Mobile systems, applications, and services, pp. 205–218, 2005. [7] “Polaris wireless,” www.polariswireless.com. [8] “Place lab,” www.placelab.org. [9] “Navizon,” www.navizon.com. [10] “Skyhook,” www.skyhookwireless.com. [11] V. Honkavirta, T. Perälä, S. Ali-Löytty, and R. Piché, “A comparative survey of WLAN location fingerprint-
105
[12]
[13]
[14]
[15]
[16]
[17]
[18]
[19] [20]
[21]
[22]
ing methods,” in Proceedings of the 6th Workshop on Positioning, Navigation and Communication 2009 (WPNC’09), March 2009, pp. 243–251. M. Wallbaum, “Indoor geolocation using wireless local area networks,” Ph.D. dissertation, RWTH Aachen University, February 2006. P. Krishnanmurthy, “Position location in mobile environments,” Proc. NSF Workshop on Context-Aware Mobile Database Management (CAMM), 2002. L. Wirola, “Studies on location technology standards evolution in wireless networks,” Ph.D. dissertation, Tampere University of Technology, 2010. L. Wirola, I. Halivaara, and J. Syrjärinne, “Requirements for the next generation standardized location technology protocol for location-based services,” Journal of Global Positioning Systems, vol. 7, no. 2, pp. 91–103, 2008. L. Wirola, “Generic Fingerprinting in SUPL 2.1,” Nokia Inc., Tech. Rep. OMA-LOC-2008-0303, 2008, presented in OMA LOC WG meeting, 19th-21st May, Wollongong, Australia. OMA-WID_0183-SUPL3_V1_0-20090114, Work Item Document, Secure User Plane Location Enabler Release (SUPL) V3.0, http://www.openmobilealliance.org. L. Wirola, “LPP OMA extensions draft,” Nokia Inc., Qualcomm, Nokia Siemens Networks, ZTE, Telcordia, LG Electronics, Andrew Corporation, Polaris Wireless, Tech. Rep. OMA-LOC-2009-0266R02, 2009, presented in OMA LOC WG meeting, 21st-23rd October, Los Angeles, USA. 3GPP TS 43.059 Functional Stage 2 Description of Location Services (LCS) in GERAN, http://www.3gpp.org. 3GPP TS 25.305 Stage 2 Functional Description of User Equipment (UE) Positioning in UTRAN, http://www.3gpp.org. 3GPP TS 36.305 Stage 2 functional specification of User Equipment (UE) positioning in E-UTRAN, http://www.3gpp.org. M. Kuorilehto, M. Kohvakka, J. Suhonen, P. Hämäläinen, M. Hännikäinen, and T. D. Hämäläinen, Ultra-Low Energy Wireless Sensor Networks in Practice: Theory, Realization and Deployment. Wiley Publishing, 2008.
[23] S. Press, Applied Multivariate Analysis: Using Bayesian and Frequentist Methods of Inference, 2nd ed. Malabar, Florida: Robert E. Krieger publishing company, 1982. [24] G. Box and G. Tiao, Bayesian Inference in Statistical Analysis. New York, Chichester,Brisbane, Toronto, Singapore: A Wiley-Interscience Publication, John Wiley and Sons, inc, 1973. [25] K. Mardia, J. Kent, and J. Bibby, Multivariate Analysis. London, San Diego, New York, Barkley, Boston, Sydney, Tokyo, Toronto: Academic Press, 1979. [26] L. Koski, “Positioning with Bayesian coverage area estimates and location fingerprints,” Master’s thesis, University of Tampere, to be published in 2010. [27] J. K. Juntunen, M. Kuorilehto, M. Kohvakka, V. A. Kaseva, M. Hännikäinen, and T. D. Hämäläinen, “WSN API: Application programming interface for wireless sensor networks,” in Personal, Indoor and Mobile Radio Communications, 2006 IEEE 17th International Symposium on, 2006, pp. 1–5. [28] J. Suhonen, M. Kuorilehto, M. Hännikäinen, and T. D. Hämäläinen, “Cost-aware dynamic routing protocol for wireless sensor networks - design and prototype experiments,” in Personal, Indoor and Mobile Radio Communications, 2006 IEEE 17th International Symposium on, 2006, pp. 1–5. [29] M. Kohvakka, “Medium access control and hardware prototype designs for low-energy wireless sensor networks,” 2009. [30] M. Kohvakka, J. Suhonen, M. Kuorilehto, V. A. Kaseva, M. Hännikäinen, and T. D. Hämäläinen, “Energyefficient neighbor discovery protocol for mobile wireless sensor networks,” Elsevier Ad Hoc Networks, 2008. [31] N. Bulusu, J. Heidemann, and D. Estrin, “GPS-less low cost outdoor localization for very small devices,” IEEE Personal Communications Magazine, vol. 7, no. 5, pp. 28–34, October 2000. [Online]. Available: http://lecs.cs.ucla.edu/ bulusu/papers/Bulusu00a.html [32] V. A. Kaseva, M. Kohvakka, M. Kuorilehto, M. Hännikäinen, and T. D. Hämäläinen, “A wireless sensor network for RF-based indoor localization,” EURASIP Journal on Advances in Signal Processing, vol. 2008, 2008.
106