user query and âDelta Airlineâ and âDelta Air Lines Jobsâ .... âDelta Airlineâ is a bad suggestion for query âdelta airâ due to identical ...... Alaska Airlines. Delta Air ...
Post-Ranking Query Suggestion by Diversifying Search Results Yang Song, Dengyong Zhou, Li-wei He Microsoft Research, One Microsoft Way, Redmond, WA 98052, USA {yangsong, denzho, lhe}@microsoft.com
ABSTRACT
1. INTRODUCTION
Query suggestion refers to the process of suggesting related queries to search engine users. Most existing researches have focused on improving the relevance of suggested queries. In this paper, we introduce the concept of diversifying the content of the search results from suggested queries while keeping the suggestion relevant. Our framework first retrieves a set of query candidates from search engine logs using random walk and other techniques. We then re-rank the suggested queries by ranking them in the order which maximizes the diversification function that measures the difference between the original search results and the results from suggested queries. The diversification function we proposed includes features like ODP category, URL and domain similarity and so on. One important outcome from our research which contradicts with most existing researches is that, with the increase of suggestion relevance, the similarity between the queries actually decreases. Experiments are conducted on a large set of human-labeled data, which is randomly sampled from a commercial search engine’s log. Our experimental results indicate that the post-ranking framework significantly improves the relevance of suggested queries by comparing to existing models.
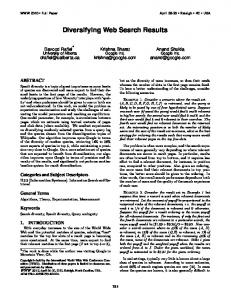
Query suggestion technique has been widely used in most commercially web search engines which facilitates the interaction between users and search engines. By its definition, a set of relevant queries are suggested to a user on the search engine result page (SERP) after the user submitted a query. If the user is not satisfied with the results shown on the page, he/she may choose to click on one of the suggested queries to refine the search. Research works have indicated that query suggestion greatly improves user satisfaction rate, especially for informational queries. Previous efforts on improving the quality of query suggestion have mainly focused on discovering relevant queries from search engine logs. For example, leveraging co-clicked URLs and session information to identify relevant queries [2, 16, 3] have shown significant improvement over other methods. In the meantime, random-walk based models [17, 19] have been extensively studied due to their simplicity and scalability. While many approaches have exhibited their effectiveness, most of them have failed to address an important issue, which is the diversification of the query suggestions. When a user clicks on a suggested query, he/she is expecting to gain additional information from a SERP with relevant topics to the original query. Therefore, we define the diversification between a query-suggestion pair to be different but relevant of their contents. Essentially, we try to find the optimal balancing point between the similarity and diversification between query-suggestion pairs. If the diversification factor is removed from our model, then the model should exhibit the same behavior as previous similarity-based approaches. Since it is relatively difficult to measure the diversification directly by only looking at two query strings, we propose a query suggestion framework which leverages post-ranking features from search results. Specifically, post-ranking features are different from pre-ranking computation where all features are required to be computed before the ranked search results are returned to the users. Post-ranking features generally means the observable elements on the SERP, e.g., the titles, snippets and URLs of the results. Therefore, we define SERP diversification between two queries to be the difference between their top-returned search results. For example, Figure 1 shows an example where “delta air” is the user query and “Delta Airline” and “Delta Air Lines Jobs” are suggested queries. In this example, we treat “Delta Airline” as a bad suggestion since the top-3 results are almost
Categories and Subject Descriptors H.3.3 [Information Search and Retrieval]: Text Mining
General Terms Algorithms
Keywords query suggestion, post-ranking re-ordering, learning-to-rank, random walk
Permission to make digital or hard copies of all or part of this work for personal or classroom use is granted without fee provided that copies are not made or distributed for profit or commercial advantage and that copies bear this notice and the full citation on the first page. To copy otherwise, to republish, to post on servers or to redistribute to lists, requires prior specific permission and/or a fee. SIGIR’11, July 24–28, 2011, Beijing, China. Copyright 2011 ACM 978-1-4503-0757-4/11/07 ...$10.00.
identical to those of “delta air”. On the other hand, “Delta Air Lines Jobs” is recognized as a good suggestion with diversified SERP results. The detailed diversification function will be discussed in our framework in Section 3. The rest of the paper is organized as follows: Section 2 presents the related work of query suggestion; Section 3 introduces our post-ranking query suggestion framework; in Section 4 we conduct experiment to evaluate our proposal; we conclude this paper with future work in Section 5.
2.
RELATED WORK
(Query Suggestion) Improving the performance and quality of query suggestion techniques have been extensively studied in the past decades. As a method mainly for interaction between search engines and users, query suggestion techniques usually cannot directly improve the relevance of the search results, but rather enhancing the entire user search experience within the same search intent. Most of the existing works rely on search engine server logs to suggest relevant queries to user inputs. Among all proposals, random walk-based methods [20, 17, 19] have exhibited noticeable performance improvement when comparing to other models. The basic idea behind random walk models is quite straightforward. Queries and URLs are represented as nodes in a bipartite graph where each edge connects one query with one URL, which indicates a click. A random walk model calculates the stable transition probability from one node to another and uses the probability to estimate the closeness between two nodes. In [8], the authors used entropy to estimate the weight of edges instead of using the raw count. The model addressed the fact that various user clicks have different importance and therefore should be treated differently. For example, a click on a more specific URL is weighted higher than a click on a general (more common) URL. The authors introduced inverse query frequency (IQF) for edge weight estimation, which exhibited better performance than raw count-based random walk models. The authors in [19] focused on a more difficult problem: suggest queries for rare queries. As rare queries often have very few or not click information, traditional click-based models are unable to perform well in this scenario. The authors therefore proposed to combine the information from clicked URLs and skipped URLs (URLs that are observed by the user who chose not to click) by constructing two bipartite graphs respectively. Two random walks are performed on each graph. Their results are combined optimally by minimizing the error function that calculates the correlation between URLs. Experiments suggested significant improvement over all other random walk models for rare queries. (Diversify Query Suggestions) Recently, authors in [15] proposed a framework for diversifying query suggestion results. Their method leveraged Markov random walk model on the query-URL bipartite graph by calculating the query hitting time. The model was capable of encouraging diversities in the search results while keeping the queries semantically related. There are some key differences between our approach and theirs. First of all, we leverage the full SERP information which contains rich signals and features, while their approach only leveraged click information from log. Since it is well known that query-URL bipartite graph is often very sparse, the quality of suggestion may be impacted. Secondly, due to the sparseness of the query-URL
Figure 2: An illustration of our framework. Step 1 generates suggestion candidates. Step 2 rank the candidates by applying a diversification function. graph, a rare query may not exist in the log and therefore the authors’ method cannot work in this case, which has no impact on our framework. Finally, our framework is quite flexible and responsive. Given a set of suggestions, we are able to rank them in real-time and adjust to the change of SERP accordingly, while their approach worked on a static set of query-URL logs that needs to retrain itself very often. (Diversify Search Results) There has been many researches that addressed the diversification of search results [1, 5, 25]. The basic idea is that search results should not only be relevant to the user query, but also relevant and different from each other. While resembles some of the techniques in this area, the objective of our research in this paper is quite different. Rather than focusing on improving the relevance of documents by re-ranking them, we aim at re-ranking suggested queries which help users refine their intent. Besides, previous researches mainly focused on with-in query document re-ranking for a particular query, while our approach handles between-query document list comparison– arguably a more challenging problem. One concern is that most of the existing works on diversifying search results only focused on ambiguous queries where those queries have more than one user intents, while our approach does not possess such limitation and can be generalized to all queries. In general, these two approaches are orthogonal to each other and can both be leveraged to improve user search experience without affecting each other. (Post-ranking Relevance Improvement) To the best of our knowledge, there exists only a few techniques that leverage post-ranking or SERP features to improve the retrieval quality in real-time. In [22], the authors collect negative implicit feedbacks from users to improve ranking. Specifically, when a user clicks the next page button on SERP, the authors assume that all previous results are irrelevant. Given those top-N negative examples, the authors propose to re-rank the remaining U results in real-time. Consequently, the authors introduce two strategies for negative feedback: 1. modifies query directly given the negative feedback, and 2. combines scores from positive and negative feedbacks optimally. Improvements are observed on benchmark TREC data sets over traditional retrieval systems.
3. THE FRAMEWORK Our framework is divided into primarily two steps. Dur-
Figure 1: An example of SERP results for three queries. “Delta Airline” is a bad suggestion for query “delta air” due to identical search results. “Delta Airline Jobs” offers better diversification. ing the first step, we generate query suggestion candidates from different sources based on log information. After that, we apply our diversification function to rank the candidates by leveraging post-ranking features. Figure 2 sketches the process.
3.1 Generating Suggestion Candidates Step 1 of our process focuses on generating candidates from search logs. In this step we put emphasis on the recall of the suggestion, therefore a raw set of candidates from different sources are generated, regardless of their relevance, and to be ranked in the next step. The first source of candidates we collect comes from random walk models. A basic random walk with restart (RWR) model is applied to the query-click logs due to its simplicity and scalability. For detail implementation of RWR, we refer interested users to [20]. User session is another important source for generating candidates. A user session is defined by search engines which often contains all user activities within a certain period of time. Search engines usually record user queries, clicks, timestamps and other information in the log. If the user becomes inactive for a while (e.g., 30 minutes), that user session ends. There exists much useful information that can be used to extract relevant queries. Specifically, we pay attention to user refined queries within the same user session. A user refined query is defined as the query reformulated by the user which followed immediately after a no-click query. For example, a user issued query “super bowl” but did not get the desired results. The user then reformulated the query to “super bowl 2011” and clicks on one of the results. Note that there also exist many other sources that related queries can be discovered, which we do not explore in this paper. Since the focus of this paper is the diversification effect on query suggestion, this part only serves as a preliminary source that generates a set of query candidates, which could certainly be improved in the future work.
3.2 The Ranking Function To achieve the diversification of search results while keep the suggested queries relevant, we introduce the following ranking function R: R(Qo , Qs ) = D(Qo , Qs ) + λS(Qo , Qs ),
(1)
where Qo denotes the original query and Qs a suggested query. The first term on the right hand side of eq.(1) measures the SERP diversification between two queries, while the second term estimates the similarity between them. λ is a tuning parameter which balances the contributions of
these two terms. This equation indicates that queries with high diversification score and high similarity with the original queries are likely to achieve high ranking scores (for λ > 0). Next, we discuss how the functions D and S are defined. Since it is difficult to directly measure the diversification between two queries, we instead resort to post-ranking features, i.e., SERP features returned by search engines. Our assumption is similar to the traditional pseudo-relevance feedback strategy [11, 24] which treats all top results as relevant to the user queries. Specifically, the diversification of two queries is defined as the aggregated score over top N returned search results (SR): D(Qo , Qs ) = D(SRQo , SRQs ),
(2)
where SRQo indicates the ordered search results list for query Qo . Furthermore, a set of features f is defined, where an adoption of a linear function for D that combines the scores from features is assumed. X wk fk (SRQo , SRQs ), (3) D(SRQo , SRQs ) = k
with wk measuring the weight of the kth feature. In Table 1, we list several features used in this paper. The first feature f1 measures the similarity of the ODP categories between two URL sets SRQo and SRQs , which aggregates the similarity over each individual pairs of URLs. Specifically, the Open Directory Project (ODP) contains a repository of human-labeled URL categories with over 4 million URLs. A tree-based taxonomy is specified in ODP where lower levels indicate more specific categories, e.g., /Sports/Baseball/International/. To determine the category of URLs, we leverage a sophisticated content-based hierarchical classifier [4]. Algorithm 1 sketches the method to calculate the similarity between two hierarchical labels. Basically, two labels are more similar if their lowest common ancestor (LCA) is located at lower level. For example, as illustrated in Figure 3, label /Sports/F ootball/N F L/ has lower similarity with /Sports/Baseball/International/ than /Sports/Baseball/Amateur/. Features f2 and f3 check the similarity between URL strings and domain names. The indicator function I equals to 1 if the two strings are the same and 0 otherwise. A discounted denominator is applied to address the importance of the URL position. Similar to the DCG [10] measurement, if U RLi and U RLj are the same with very high SERP positions (smaller values of i and j), they will be penalized a lot by the denominator.
Figure 3: An example of calculating similarities between ODP categories. The left figure shows the subtree under node Sports. Tree L1 and L2 has higher similarity than L3 since their lowest common ancestor Football is closer to the leaf node. Here the similarity is calculated using m = 2. Algorithm 1 URL Similarity Calculation 1: Input two URLs {U RL1 , U RL2 }, labels {lb1 , lb2 }, weight m 2: 3: 4: 5: 6: 7: 8: 9: 10: 11:
(m > 1) Initialize base = 1, sim = 0, denominator = 0 for each level i in the tree if lb1 (i) = lb2 (i) sim = sim + base end if denominator = denominator + base base = base ∗ m end for sim sim = denominator Output sim
Algorithm 2 Query Similarity Calculation 1: Input two queries Qo , Qs , a list of stop words 2: max length = max(len(Qo ), len(Qs )) 3: word distance = LevenshteinDistance(RemoveStopWords(Qo ), RemoveStopWOrds(Qs ))
4: query similarity = word distance / max length 5: output query similarity
pairs. Similar to the learning-to-rank [14] framework, we use a supervised learning approach in our paper.
3.3.1 Training Labels Feature f4 uses Kendall τ rank correlation coefficient [12] to compute the correlation between two ordered SERP lists. A pair is said to be concordant if and only if both URLs are identical and ranked at the same position. Otherwise, they are discordant. On the other hand, the second term S(Qo , Qs ) in eq.(1) measures the string similarity between the query and a suggestion. A standard Levenshtein distance-based algorithm is applied here, with λ a free parameter controlling its relative weight. Algorithm 2 sketches the process. Note that there are lots of more sophisticated methods to calculate query similarity and arguably ours is an oversimplified one. However, since the focus of this paper is primarily on the diversification part, we leave this part for improvement in the future. Besides, as we shall see in the experiments, the query string similarity in general decreases with the increase of suggestion relevance. Nevertheless, even this oversimplified function leads to significant performance improvement when combined with several diversification features.
3.3 Learning The Ranking Function Combining eq.(2) and eq.(3) into eq.(1), we have R(Qo , Qs ) =
X
wk fk (SRQo , SRQs ) + λS(Qo , Qs ),
(4)
k
which contains parameters λ and w = {w1 , ..., wk }. We rename λ = w0 and expand w = {w0 , w1 , ..., wk } to be the feature weights to learn. The objective is therefore to optimize these parameters given a set of labeled query-suggestion
We use human assessors to evaluate the relevance between query and suggestions. For each pair of query suggestions, the assessors are given the queries, their corresponding search result pages side-by-side, and asked to make a binary decision of whether these two queries are related. Every pair is given to three independent assessors. The final score is the number of assessors who labeled that pair as related. Therefore, the label is always between 0 and 3 with 3 being the most related and 0 unrelated. It is important to notice that in the judgment guidelines, the assessors are only asked to label the pairs as related or not based on their impressions on the SERP. Because if the assessors are asked to judge the diversification of the page or the similarity between queries, then the judgment labels may not reflect the true relevance of the suggested query. The weight of the diversification function should be learnt from the labels rather than being used as a guideline for judgment, since diversifying the SERP may or may not lead to a higher click through rate (CTR) on the suggested queries, before we have the true relevance labels. Besides the “related” label, we also ask assessors to judge if the two SERPs are totally identical on their top K (K = 3 in our guideline) results. If so, a “Duplicate” label becomes positive which overrides the related label to be zero.
3.4 Learning Algorithms The general ranking function in eq. (4) presents us with opportunity to apply more than one categories of learning algorithms to the training data. Specifically, we learn the ranking function by using classification, linear regression, ordinal regression and learning-to-rank frameworks.
3.4.1 Classification With four classes of labels ranging from 0 to 3, a multiclass Support Vector Machines (SVMs) classifier [21, 7] is applied to classify instances into one of the four classes. The objective of SVMs is to maximize the margin of the separation hyper plane while subject to minimizing the classification error rate. The output of SVMs is a probability distribution over the classes. Therefore, the final ranking of an instance is calculated as follows: Rank(Qt ) =
3 X
cP (c).
(5)
c=0
For example, the instance with probability distribution of {0.1, 0.3, 0.2, 0.4} has a higher rank (1.9) than the instance of {0.3, 0.1, 0.1, 0.5} which has a rank of 1.8, even though both instances are classified into class 3. This approach has shown very effective ranking results in previous models [13].
3.4.2 Linear Regression A linear regression model estimates the label (response) yi as a continuous variable given a set of C independent variables xi = {xi1 , ...xiC }: yi = β0 +
C X
βc xic + ǫi ,
(6)
with ǫi being the error term. Linear regression optimizes by minimizing the sum-of-squared residuals (SSE). The output is directly used as the final ranking of the queries.
3.4.3 Ordinal Regression Ordinal regression is essentially an extension of the multinomial logistic regression, which is a regression model but generalizes logistic regression to discrete outputs. The shortcoming of logistic regression is due to its ignorance of the orders of categories. Instead, ordinal regression considers this situation by using a logit function in the model:
where
Z(x) 1 − Z(x) P (Y ≤ yi |X) = log P (Y > yi |X) = αi + βX, i = 1, ..., k − 1
= log
Z(x) =
L = # of leaf nodes, v = the shrinkage parameter for i = 1 to N Initialize F0 (xi ) to be the base model end for for m = 1 to M for i = 1 to N yi ← λi i wi ← ∂F∂y (xi ) end for Create L−terminal node tree {Rlm }L l=1 for l = 0 P to L x ∈R y rlm ← P i lm i xi ∈Rlm wi
13: end for 14: for i = 0 to N P 15: Fm (xi ) ← Fm−1 (xi ) + v l rlm I(xi ∈ Rlm ) 16: end for 17: end for
where the DCG score is calculated by dividing the relevance score with the position of the ranking,
e(αi +βX) , 1 + e(αi +βX)
(7)
3.4.4 Learning To Rank Unlike all aforementioned algorithms, the learning-to-rank framework directly optimizes the ranking loss, i.e., it focuses on the relative order between two list items. Therefore, the objective of learning is to directly minimize the number of misclassified pairs. Out of all loss functions used in learningto-rank, Normalized Discounted Cumulated Gain (NDCG) is most commonly used. Specifically, NDCG is defined as the DCG score of a ranking result, divided by the ideal DCG, DCG , IDCG
M X 2s(i) − 1 , log(1 + i) i=1
(9)
where s(i) is the relevance score assigned by human assessors. The higher the NDCG score is, the better the ranking result is assumed. We choose the LambdaSMART [23] algorithm as our framework due to its superior ranking performance. The algorithm leverages the MART (multiple additive regression trees) boosting framework [9] to perform gradient descent at each iteration. Algorithm 3 sketches the framework.
4. EMPIRICAL ANALYSIS This section presents experimental results on real-world data mined from a commercial Web search engine. We discuss how the diversification function affects the relevance of related queries, as well as the importance of individual features and their combinations.
4.1 Data Acquisition
The model is usually estimated using maximum likelihood method. Previous results have indicated its superiority over logistic regression [6].
N DCG =
2: 3: 4: 5: 6: 7: 8: 9: 10: 11: 12:
DCG =
c=1
f (Z(x)
Algorithm 3 The LambdaSMART algorithm 1: Input: N = # of queries, M = # of iterations,
From search engine server logs, we randomly sampled 13,421 queries between September 2010 and November 2010. These are queries that trigger at least one related search on the search result page. The search engine we use generates related queries from a combination of different resources, including but not limited to: random walk on the query-click graph, similar queries from the same user session, collaborative filtering from similar users and so on. Since generating query candidates is not the focus of this paper, we won’t discuss in detail about this part. However, we will show the improvement of our approach by comparing to one of the techniques in later sections. As mentioned above, the query-suggestion pairs are given to assessors for evaluation and assigned with a score between 0 and 3. Table 2 summarizes the statistics of the data set. In Table 3, we show several query-suggestion pairs and their judgment labels.
4.2 Parameter Initialization (8)
We pre-define the following parameters in our experiments.
Label Unrelated (0) Somewhat related (1) Related (2) Closely related (3) Duplicate (0)
Count 1597 2099 2471 7254 1875
Table 2: Statistics of data used in our experiment.
For comparing SERP difference, we choose the top-10 (N = 10) blue links returned by a major search engine. For the LambdaSMART algorithm, we choose M = 500 iterations and v = 0.1 the shrinkage parameter. These parameters are fixed since the algorithms are relatively robust to their changes, as shown in previous researches [23]. We show the sensitivity of the remaining parameters in later sections.
4.3 Feature Correlation Figure 4 plots the boxplots of feature values vs. the human assigned labels. The first plot shows the query similarity vs. the labels, where the query similarity is used as a regularization factor in eq.(1). It can be observed that with the increase of relevance (from 0 to 3), the similarities between queries and suggestions generally decrease. This finding is contradictory to many existing researches that leveraged query similarity to find related queries, which strongly supports our introduction of the diversification metric. The second figure shows the ODP category similarity scores with the change of labels. We show that the most related query suggestions have higher category similarity than unrelated suggestions, which indicates that users are still interested in seeing more results from similar topics (categories), rather than switching to other intents. The third and fourth figures plot the URL and domain similarity scores vs. labels. Both results demonstrate that the increase of relevance demands a decrease in result similarity. Comparatively, the decrease of URL similarity is more drastic than domain similarity, which makes sense since URLs within the same domain might still exhibit different topics which are potentially of interests to the users. The Kendall τ rank shows similar results as the domain similarity in Figure 5. We further use Pearson’s χ2 test [18] to test the correlation significance between features and labels. Table 4 depicts the results of χ2 as well as their corresponding p-values, where in general high χ2 values with low p-value indicates higher significance (for a fixed degree of freedom). It can be observed that all five features have strong correlation with the labels, with statistically significance given p-values < 0.05.
4.4 Performance Analysis In this section, we present the detailed results of the four learning algorithms. We separate the data into 60% training, 10% validation and 30% testing for tuning the parameters. For multi-class SVM, we use the linear kernel since it performed better than sigmoid and polynomial kernels for our data. The best balancing factor c is tuned using cross validation and found to be 0.85. For the LambdaSMART algorithm, we specify L the number of nodes in the leaf to be 2 (stump) and 20, respectively. The weight of a feature from LambdaSMART is calculated according to the number
of times that feature is used to split the decision tree. Table 5 lists the feature weights learnt from all models. In general, the URL similarity and ODP category similarity features demonstrate the highest weights. The query similarity feature ranks second to the last, which indicates the importance of diversification features in overall performance. Next, we compare the ranking performance of these algorithms. As illustrated in eq.(8) and eq.(9), NDCG is the most popular metric for retrieval performance which addresses both relevance and the position of the returned results. Since most of the time search engines return no more than six suggested queries, we will measure NDCG@5 and NDCG@1 in our experiments. For regression, the output is used directly to rank the suggestions. For SVM, eq. (5) is used to calculate the ranking based on the classification output. Figure 5 summarizes the results of NDCG@1 and NDCG@5. While linear regression shows the worst performance, the LambdaSMART algorithm significantly outperforms all others. In general, LambdaSMART achieves 0.79 and 0.74 for NDCG@1, with 20 and 2 leaf nodes respectively. For NDCG@5, it also performs well with 0.63 and 0.59 NDCG scores. Furthermore, we illustrate the importance of individual features in retrieval performance. Specifically, we calculate the NDCG scores by using only one feature at a time, versus combining the only similarity feature (Query) with each individual diversification features. Since in our previous experiment, LambdaSMART demonstrated significantly better performance than all others, we will only use LambdaSMART for all our remaining experiments. Table 6 tabulates the results. In general, for individual feature comparison, ODP and URL similarity yield the highest NDCG scores. With the combination of similarity measurement and diversification criteria, we observe that Query+URL yields the best performance among all, whereas Query+ODP also shows competitive performance. Both combinations are very close to the optimal performance of LambdaSMART that uses all features, which suggests the usefulness of the similarity and diversification mixtures in real-world applications.
4.5 Performance for Different Query Types Furthermore, we slice and dice the results to see how the proposed diversification measurement affects different types of queries. Statistically, in our data set, the average length of queries is 2.51, whereas the average length of suggestions Query priceline.com jet blue sign up for hotmail inception youtube broadcast broan dessert yahoo maps fun school swa
Suggestion IMS Health Blue Jet Lightning Create Free Hotmail Account Dictionary Inception YouTube Videos Home Depot Dessert Recipes MapQuest Driving Directions fun school kaboose Southwest Airlines
Label 0 0 1 1 2 2 3 3 Dup Dup
Table 3: Examples of query-suggestion pairs with their labels. Dup = 0 in our definition.
Query Similarity vs. Label
URL Similarity vs. Label
ODP Category Similarity vs. Label
2.5 0.25 2 0.2
0.1
1.5
0.15 1
0.1
0.05 0.5
0.05
0
0
0 0
1
2
3
0
1
2
3
0
1
2
3
Kendall τ Rank vs. Label
Domain Similarity vs. Label 0.4
3 2.5
0.3 2 1.5
0.2
1 0.1 0.5 0
0 0
1
2
3
0
1
2
3
Figure 4: Boxplot of feature values vs. human-judged labels. Query similarity decreases with the increase of label relevance. The ODP category similarity increases when suggested queries are more related. All other diversification features indicate negative correlations with the labels. Feature Query Similarity ODP Category Similarity URL Similarity Domain Similarity Kendall τ rank
χ2 22.0454 27.4349 24.5443 10.1814 18.5849
p-value 0.009098 0.003289 0.005405 0.012545 0.008500
Table 4: Pearson’s χ2 Test result with df = 13, 420 and corresponding p-values.
is 3.02. We break down the queries into Long (length > 4), Medium (2 ≤ length ≤ 4) and Short (length < 2). In total, there are 1350 long queries, 7551 medium queries, and 4283 short queries. On the other hand, we split queries into frequent queries and infrequent queries. Arguably, most frequent queries can be treated as navigational queries such as “facebook”, while infrequent queries are mostly informational queries. Figure 6 shows the log-log plot of query length vs. query frequency. In our experiment, we specify the top 1% most frequent queries to be navigational, and the bottom 50% to be informational1 . Table 7 summarizes the statistics. In Figure 7, we report the comparison for different query types in terms of NDCG values, where the overall NDCG of all queries (the top bar) is measured against all query types. It is evident to observe that informational queries gain higher NDCG scores than navigational queries, whereas short queries gain lower NDCG scores than medium and long queries. As shown in Table 7, the average suggestion lengths for short and navigational queries are much higher than the queries themselves. In our opinion, users who issue 1
Note that our cut-off threshold is not very strict, since the definition of navigational and informational are quite vague and varies from different data sets.
Type Short Medium Long Navigational Informational Overall
Query Length 1 2.76 4.87 1.62 2.26 2.51
Suggestion Length 2.47 3.2 3.7 2.46 2.73 3.02
Table 7: Statistics of average query-suggestion lengths in several query types.
navigational or short queries to search engines often have a quite clear intent in mind, and thus don’t click on suggested queries very often. On the other hand, users who issue longer queries are less clear about their intent, and more likely to use related queries to reformulate their intent.
4.6 Comparison to Random Walk Recall that our framework is essentially a ranking (or reranking) algorithm based on an existing set of query candidates. As discussed in Section 3.1, random walk techniques have shown noticeable performance on related search area. It is therefore important to see how much NDCG gain our framework can achieve by comparing to the results from random walks. The underlying algorithm is quite straightforward which iteratively performs random walk on query-click bipartite graph until convergence. For details of using random walk on click graphs, we refer interested users to [20]. After random walk, each query and its related queries are represented in a vector, where each entry is a float point number indicating how close the suggestion is to the query. This number is naturally used to rank related queries.
1 (Linear) SVM Linear Regression Ordinal Regression LambdaSMART (2) LambdaSMART (20)
0.8
0.6
0.4
0.2
0
NDCG@1
NDCG@5
Figure 5: NDCG comparison of the four algorithms. Both NDCG@1 and NDCG@5 are shown. LambdaSMART demonstrates the best overall performance. 5
10
Overall 4
10 Query Frequency
Informational 3
10
Navigational Long
2
10
Medium 1
10
Short
0
10 0 10
1
2
10
10
0
0.1
0.2
0.3
0.4
0.5
0.6
0.7
Query Length
Figure 6: Log-log plot of query frequency vs. query length in our data set. In addition, we also compare with the method (DQS) in [15] which essentially used random walk to find related queries and leveraged hitting time to measure their diversification qualities. All the parameters are set default as described in their paper. Figure 8 compares the NDCG scores among four models. It is clearly that both our algorithms improve retrieval quality on the basis of random walk results. While linear regression gains 2.3% NDCG gain at position 1, LambdaSMART achieves more than 20% improvement against random walks. Both LambdaSMART and linear regression have relatively small standard deviation across all queries. On the other hand, the DQS algorithm has an overall performance close to the baseline algorithm. Although achieved a better NDCG score than baseline and linear regression for position 1 (0.5037), DQS exhibits the highest standard deviation among all algorithms and gradually loses the advantage over the baseline. Table 8 shows several examples of query-suggestion pairs, which demonstrates the effectiveness of re-ordering the related queries from random walk results.
5.
CONCLUSION AND FUTURE WORK
In this work, we presented a novel way of improving the relevance of query suggestion by diversifying search engine results page. Specifically, our framework first gathered a set
Figure 7: NDCG@5 performance on different query types. The overall performance is from LambdaSMART (20).
of suggestion candidates, and then ranked these suggestions in the descending order of their diversification scores. Our diversification function considered both the query similarity as well as several diversification features, including URL difference, domain difference, ODP category difference and Kendall τ coefficient rank. We randomly sampled a large set (over 10,000) of query-suggestion pairs from a commercial search engine, and asked human assessors to label their level of relevance. Given these labeled training data, we proposed to leverage different kinds of learning algorithms to optimize the ranking function, including SVM classifier, linear regression, ordinal regression and learning-to-rank algorithms. Experimental results indicated that the learningto-rank algorithm – LambdaSMART – was able to achieve outstanding performance by outperforming all other learning algorithms, as well as two random walk-based algorithms, significantly. Our framework was able to improve the NDCG score from 0.45 to 0.79, for position 1 by comparing to random walk framework. Experimental results also demonstrated the importance of the diversification features which significantly improved the relevance of the suggested queries when combining with the query similarity feature. An important discovery of this paper was that, with the increase of the suggestion relevance, the similarity between queries and suggested queries indeed drops. This is contra-
1 Random Walk (Baseline) DQS Linear Regression LambdaSMART
0.9 0.8
[8]
0.7 0.6
[9]
0.5 0.4
[10]
0.3 0.2
NDCG@1
NDCG@2
NDCG@3
NDCG@4
NDCG@5
Figure 8: Comparison of NDCG between random walk results and two of our models: linear gression and LambdaSMART. dictory to many existing researches with aimed at making suggestions based on query similarity solely. The humanjudged labels indicated that users of search engines are more willing to click on suggestions that could potentially lead to more diversified search results, but still within the same user search intent. This fact is especially obvious for medium and long queries, as well as informational queries. As a preliminary research towards the direction of using post-ranking features, there exists lots of room for improvement. In the future, we plan to explore more features and signals on the search result pages to improve the power of the diversification function. Another direction is to incorporate user behaviors into real-time suggestion re-ranking, including but not limited to, user clicked URLs, skipped URLs as well as behaviors from similar users.
6.
[11]
[12] [13]
[14] [15] [16]
[17]
[18]
REFERENCES
[1] R. Agrawal, S. Gollapudi, A. Halverson, and S. Ieong. Diversifying search results. In Proceedings of WSDM ’09, pages 5–14, New York, NY, USA, 2009. ACM. [2] R. Baeza-yates, C. Hurtado, and M. Mendoza. Query recommendation using query logs in search engines. In In International Workshop on Clustering Information over the Web (ClustWeb, in conjunction with EDBT), Creete, pages 588–596. Springer, 2004. [3] R. Baeza-Yates and A. Tiberi. Extracting semantic relations from query logs. In Proceedings of KDD ’07, pages 76–85, New York, NY, USA, 2007. ACM. [4] P. N. Bennett and N. Nguyen. Refined experts: improving classification in large taxonomies. In SIGIR ’09, pages 11–18, New York, NY, USA, 2009. ACM. [5] J. Carbonell and J. Goldstein. The use of mmr, diversity-based reranking for reordering documents and producing summaries. In Proceedings of SIGIR ’98, pages 335–336, New York, NY, USA, 1998. ACM. [6] W. Chu and S. S. Keerthi. New approaches to support vector ordinal regression. In Proceedings of ICML ’05, pages 145–152, New York, NY, USA, 2005. ACM. [7] K. Crammer, Y. Singer, N. Cristianini, J. Shawe-taylor, and B. Williamson. On the algorithmic implementation of multiclass kernel-based
[19]
[20]
[21]
[22]
[23]
[24]
[25]
vector machines. Journal of Machine Learning Research, 2:2001, 2001. H. Deng, I. King, and M. R. Lyu. Entropy-biased models for query representation on the click graph. In SIGIR ’09, pages 339–346, New York, NY, USA, 2009. ACM. J. H. Friedman. Greedy function approximation: A gradient boosting machine. Annals of Statistics, 29:1189–1232, 2000. K. J¨ arvelin and J. Kek¨ al¨ ainen. Cumulated gain-based evaluation of ir techniques. ACM Trans. Inf. Syst., 20:422–446, October 2002. T. Joachims, L. Granka, B. Pan, H. Hembrooke, and G. Gay. Accurately interpreting clickthrough data as implicit feedback. In SIGIR ’05, pages 154–161, New York, NY, USA, 2005. ACM. M. G. Kendall. A New Measure of Rank Correlation. Biometrika, 30(1/2):81–93, June 1938. P. Li, C. J. C. Burges, and Q. Wu. Mcrank: Learning to rank using multiple classification and gradient boosting. In J. C. Platt, D. Koller, Y. Singer, and S. T. Roweis, editors, NIPS. MIT Press, 2007. T.-Y. Liu. Learning to rank for information retrieval. Found. Trends Inf. Retr., 3:225–331, March 2009. H. Ma, M. R. Lyu, and I. King. Diversifying query suggestion results. In AAAI, 2010. H. Ma, H. Yang, I. King, and M. R. Lyu. Learning latent semantic relations from clickthrough data for query suggestion. In CIKM ’08, pages 709–718, New York, NY, USA, 2008. ACM. Q. Mei, D. Zhou, and K. Church. Query suggestion using hitting time. In CIKM ’08, pages 469–478, New York, NY, USA, 2008. ACM. K. Pearson. On the criterion that a given system of deviations from the probable in the case of a correlated system of variables is such that it can be reasonably supposed to have arisen from random sampling. Philosophical Magazine, 302:157–175, 1900. Y. Song and L. He. Optimal rare query suggestion with implicit user feedback. In WWW ’10, pages 901–910, New York, NY, USA, 2010. ACM. H. Tong, C. Faloutsos, and J.-Y. Pan. Random walk with restart: fast solutions and applications. Knowl. Inf. Syst., 14:327–346, March 2008. I. Tsochantaridis. Support vector machine learning for interdependent and structured output spaces. PhD thesis, Providence, RI, USA, 2005. AAI3174684. X. Wang, H. Fang, and C. Zhai. Improve retrieval accuracy for difficult queries using negative feedback. In CIKM ’07, pages 991–994, New York, NY, USA, 2007. ACM. Q. Wu, C. J. Burges, K. M. Svore, and J. Gao. Adapting boosting for information retrieval measures. Inf. Retr., 13:254–270, June 2010. C. Zhai and J. Lafferty. Model-based feedback in the language modeling approach to information retrieval. In CIKM ’01, pages 403–410, New York, NY, USA, 2001. ACM. C. Zhai and J. Lafferty. A risk minimization framework for information retrieval. Inf. Process. Manage., 42:31–55, January 2006.
Feature f1 (SRQo , SRQs ) = Sim(ODP (SRQo ), ODP (SRQs )) P P j i )) ), ODP (SRQ = i j Sim(ODP (SRQ o o f2 (SRQo , SRQs ) = Sim(U RL(SRQo ), U RL(SRQs )) P P j i ))/ log2 (i + j) ) = U RL(SRQ = i j I(U RL(SRQ o o f3 (SRQo , SRQs ) = Sim(DM (SRQo ), DM (SRQs )) P P j i ))/ log 2 (i + j) ) = DM (SRQ = i j I(DM (SRQ o o f4 (SRQo , SRQs ) = τ (SRQo , SRQs ) = {(# concordant pairs) - (# discordant pairs)} /0.5n(n − 1)
Description The similarity of the ODP category between two URL sets check if U RLi is the same as U RLj , discounted by the position of U RLi check if the domain of U RLi is the same as U RLj , discounted by its position Kendall τ rank correlation coefficient for two ordered URL lists
Table 1: Features used to calculated diversification between two queries.
(Linear) SVM Linear Regression Ordinal Regression LambdaSMART (2) LambdaSMART (20) Average
Query Sim 0.0145 0.1341 0.1758 0.8391 0.8214 0.39698
ODP Sim 0.0230 0.1613 0.2390 0.8305 0.9676 0.44428
URL Sim 0.0783 0.2935 0.2406 0.9512 0.9827 0.50926
Domain Sim 0.0092 0.2540 0.1973 0.9336 0.7382 0.42646
Kendall τ Rank 0.0110 0.1755 0.2055 0.7795 0.5882 0.35194
Table 5: The weights of features from four learning algorithms. For SVM, linear kernel is applied. For LambdaSMART, we try both L = 2 and 20 for the number of leaf nodes.
NDCG@1 NDCG@5 Average
Query 0.6466 0.5728 0.6097
ODP 0.6997 0.6433 0.6365
URL 0.6606 0.6082 0.6694
Domain 0.5925 0.5218 0.5572
Kendall 0.5641 0.5039 0.5340
Query+ODP 0.7284 0.6489 0.6686
Query+URL 0.7245 0.6407 0.6826
Query+Domain 0.6933 0.6284 0.6608
Query+Kendall 0.6873 0.6177 0.6525
Table 6: The NDCG scores of using individual features alone vs. combining similarity feature (Query) with individual diversification features. Results are measured using LambdaSMART algorithm.
Query
delta airline
sierra trading post
old cars
Random Walk Result Delta Air Lines SkyMiles Alaska Airlines Delta Air Lines Credit Union Delta Airline Flight Delta Air Lines Reservations Sierra Equipment Sierra Trading Post Jobs Sierra Traders sierra club reviews Lands’ End cool cars Police Student oldsmobile cars antique cars old houses
LambdaSMART Result Delta Airline Flight Delta Air Lines Reservations Delta Air Lines SkyMiles Alaska Airlines Delta Air Lines Credit Union Sierra Trading Post Jobs Lands’ End Sierra Traders Sierra Equipment sierra club reviews antique cars cool cars oldsmobile cars old houses Police Student
DCG RW
DCG Lambda
DCG Gain
7.81
10.82
+3.01
6.10
10.39
+4.29
6.51
9.39
+2.88
Table 8: Examples of query-suggestion pairs from random walk and re-ordered by LambdaSMART algorithm. DCG RW is the DCG score achieved by random walk. DCG Lambda is the score from LambdaSMART.