Postabsorptive Respiratory Quotient and Insulin-stimulated Glucose Storage Rate in Nondiabetic Pima Indians Are Related To Glycogen Synthase Fractional Activity in Cultured Myoblasts David M. Mott, Richard E. Pratley, and Clifton Bogardus Clinical Diabetes & Nutrition Section, National Institutes of Health, Phoenix, Arizona 85016
Abstract A decreased ratio of fat to carbohydrate oxidation rate (an elevated respiratory quotient) predicts the development of obesity. Skeletal muscle accounts for a major fraction of total body lipid oxidation and is the principle site for reduced glucose storage in insulin-resistant subjects. The potentially important role that muscle has in promoting obesity or insulin resistance may be based on metabolic control intrinsic to skeletal muscle. Cultured skeletal muscle provides a system to examine the importance of inherent metabolic traits in muscle biopsies from obese and insulin-resistant subjects. Glycogen synthase fractional activity (GSFA) was measured in cultured myoblasts from 21 Pima Indians characterized in vivo using indirect calorimetry and a euglycemic hyperinsulinemic clamp. Basal GSFA in cultured muscle cells is inversely correlated with postabsorptive respiratory quotient of the muscle donors (r 5 20.66, P 5 0.001) and with in vivo high dose insulin-stimulated glucose storage rates (r 5 0.47, P 5 0.04). These results indicate that the postabsorptive respiratory quotients and insulin-mediated glucose storage rates in vivo share a common regulatory mechanism with GSFA in cultured myoblasts. Abnormal regulation of glycogen synthase phosphorylation state may be an intrinsic defect in skeletal muscle associated with obesity and insulin resistance. (J. Clin. Invest. 1998. 101:2251– 2256.) Key words: glycogen synthase • skeletal muscle • cell culture • insulin action • obesity
Introduction Both obesity and insulin resistance increase the risk for developing type II diabetes mellitus (1, 2). Resistance to insulinmediated glucose disposal in vivo primarily involves abnormal glucose storage in skeletal muscle (1). Recent investigations indicate that the ratio of glucose to lipid oxidation rate predicts an increase in body fat (3–5). Skeletal muscle, as the largest single tissue mass, has been suggested to have a principle role in determining in vivo rates of lipid oxidation (6). These observations suggest that primary origins and interactions of obesity and insulin resistance could reside in skeletal muscle. To understand the potential contribution of inherent skeletal muscle metabolism to obesity and insulin resistance, we
Address correspondence to Dr. David M. Mott, Clinical Diabetes & Nutrition Section, National Institutes of Health, 4212 North 16th Street, Room 541, Phoenix, AZ 85016. Phone: 602-200-5300; FAX: 602-200-5335; E-mail:
[email protected] Received for publication 19 September 1997 and accepted in revised form 16 March 1998. The Journal of Clinical Investigation Volume 101, Number 10, May 1998, 2251–2256 http://www.jci.org
have examined the glycogen synthase activity in cultured muscle cells from subjects over a range of obesity. Glycogen synthase was selected for analysis in cultured muscle because subjects with reduced insulin-mediated uptake of glucose into skeletal muscle glycogen in vivo (7) also have reduced insulinstimulated glycogen synthase activity measured in skeletal muscle biopsies at the end of a euglycemic hyperinsulinemic clamp. The primary mechanism leading to abnormal glycogen synthase activity has been difficult to identify in studies of biopsied muscle because of the potential effects of the hormonal and nutritional state of the muscle donor at the time of the tissue biopsy. In this study, the muscle from all subjects is cultured for a minimum of one month in the same environment before analysis of myoblast glycogen synthase activity. This system allows expression of possible individual metabolic differences inherent to muscle cells from different subjects, independent of the unique regulatory environment provided by each individual’s circulating hormonal and nutrient composition. The data for glycogen synthase activity in cultured cells are compared with clinical parameters of obesity and insulin resistance of the muscle donors.
Methods 21 Pima Indians were admitted to the metabolic ward of the Clinical Diabetes and Nutrition Section of the National Institutes of Health (NIH, Phoenix, AZ). They gave informed consent for the studies that were approved by the Ethics Committees of the NIH and the Tribal Council of the Gila River Indian Community. Fitness for the study was determined by medical history, physical examination, electrocardiography, and routine biochemical, hematological, and urine testing. None of the subjects were taking any medication, and no subject had any clinically significant abnormalities on these examinations. The subjects’ characteristics are shown in Table I. Subjects were studied after 5–7 d on a weight-maintaining diet (20% protein, 50% carbohydrate, and 30% fat). Body composition was determined by dualenergy x-ray absorptiometry (8), and fat-free mass and percent body fat were calculated. Diabetics were excluded after an oral glucose tolerance test. After an overnight fast, in vivo glucose disposal and substrate oxidation rates were measured using ventilated hood indirect calorimetry before (basal) and during a hyperinsulinemic euglycemic clamp (9). Postabsorptive or basal appearance rate of glucose in plasma was calculated from (3-H3) glucose-specific activities using Steele’s steady state equation (10). Two insulin infusion rates of 40 and 400 mU/m2 per minute were used to reach steady state plasma insulin concentrations of 1070660 (low dose) and 1750461002 (high dose) pM. Substrate disposal and oxidation rates are normalized to kilograms of metabolic body size 5 KGMBS (1). Nonoxidative glucose disposal is referred to as glucose storage; postabsorptive respiratory quotient is referred to as basal respiratory quotient (RQ).1
1. Abbreviations used in this paper: DPBS, Dulbecco’s phosphate buffered saline; G6P, glucose-6-phosphate; GSFA, glycogen synthase fractional activity; LCFACoA, long chain fatty acid coenzyme A; PP1G, heterodimer of type-1 protein phosphatase catalytic and glycogen binding regulatory subunit; RQ, respiratory quotient. Respiratory Quotient and Myoblast Glycogen Synthase
2251
Table I. Subject Characteristics
M/F Age (yr) Fasting insulin (pM) Fasting glucose (mM) 2-h glucose (mM) Body fat (%)
Mean6SD
Range
12/9 3066 2856176 4.860.6 7.061.8 3468
— 19–47 82–765 3.7–6.2 3.9–10.6 19–50
After an overnight fast, percutaneous muscle biopsies were obtained from the quadriceps femoris muscle after local anesthesia of skin and fascia with lidocaine (11). Primary myoblast cultures were established from human muscle using a previously reported method from this laboratory (12). Up to 300 mg of skeletal muscle was collected in cold DME and finely minced. The cells were dissociated by incubation with 0.25% (wt/vol) trypsin, 0.1% (wt/vol) type IV collagenase, and 0.1% (wt/vol) BSA at 378C for 30 min with agitation. The cells were collected by centrifugation at 350 g. Cells were plated in uncoated 60-mm dishes for 1 h at 378C to remove fibroblasts. The residual cellular material was transferred to 25 cm2 rat tail collagen– coated flasks (Biocoat; Becton Dickinson, Bedford, MA). All subsequent culture ware was collagen coated. Myoblasts were allowed to grow until 100% confluent in DME supplemented with 25 mM Hepes, 17% FCS, 2 mM glutamine, 0.5% chick embryo extract, 100 U/ml penicillin, 10 mg/ml streptomycin, 0.25 mg/ml amphotericin B. The immunoreactivity of skeletal muscle proteins myosin and actinin, and the activity of creatinine kinase in these muscle cultures was reported previously by this laboratory (12). Primary cultures were trypsinized and subcultured in the above media with 10% FCS. Cells between three and six cell population doublings (primary cell monolayers are designated as one cell population doubling) were plated at 105 cells per 60-mm dish and allowed to reach 80–90% confluence. These cells were used for measures of glycogen synthase activity after preincubation conditions modified from a previously described method (13). Monolayers were washed twice with Dulbecco’s phosphate buffered saline (DPBS) and cultured for 24 h in IM media (DPBS supplemented with 21 mM NaHCO3, 2 mM glutamine, 1 mg/ ml BSA, basal media eagle amino acids and vitamins) containing 25 mM glucose. After two washes with DPBS, monolayers were incubated 17 h in IM media (no glucose) and one additional hour in fresh IM media (no glucose) 61027 M insulin. The cells at this point remain preconfluent and contain , 2.0% multinucleated myotubes. After 1-h incubation6insulin, cell monolayers for assay of glycogen synthase activity were washed at 48C with 0.3 mM phloretin in DPBS and with DPBS. Cell monolayers were covered with 200 ml per dish 30% glycerol, 10 mM EDTA, and 50 mM KF, pH 7.0, and frozen by floating the 60 mm dish on liquid N2. Frozen monolayers were stored at 2708C. Monolayer cells were collected by scraping the dish at 48C, homogenized (Omni International, Waterbury, CT), and the 48C, 10,000 g supernatant was diluted 2.3-fold with 50 mM Tris, 130 mM KF, 20 mM EDTA, pH 7.8, for enzyme assay as described previously (11). The active forms of glycogen synthase were assayed at 0.17 mM glucose-6-phosphate (G6P) and maximum glycogen synthase activity was assayed at 7.2 mM G6P. Fractional activity is expressed as the activity ratio of active form to maximum glycogen synthase measured at 0.13 mM UDP-glucose. Three subjects each had two cultures collected and were assayed on separate days for glycogen synthase activity. The intra-individual coefficients of variation were 14, 12, and 1% for glycogen synthase fractional activities, and 8, 6, and 2% for maximum activities, respectively. Intra-assay coefficient of variation on four replicate frozen monolayers was 9 and 4% for fractional and maximum activity, respectively. Protein was assayed (Bio-Rad Laboratories, Richmond, CA) on 40-ml aliquots of the undiluted superna2252
Mott et al.
tant. Statistical significance of differences between groups was calculated using the unpaired, two tailed t test. Data are expressed as means6SEM unless otherwise indicated. Statistical analyses were calculated using Statistical Analysis System (SAS Institute, Inc., Cary, NC).
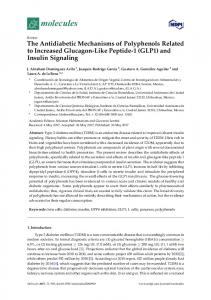
Results Basal glycogen synthase fractional activity (GSFA) in cultured muscle cells is inversely correlated with the basal RQ of the muscle donors (r 5 20.66, P 5 0.001; Fig. 1 A). This relationship includes a negative correlation with in vivo basal glucose oxidation (r 5 20.61, P 5 0.003; Fig. 1 B) and a positive association with in vivo basal lipid oxidation (r 5 0.55, P 5 0.01; Fig. 1 C) rates. Of these three variables associated with basal GSFA, insulin-stimulated GSFA is only correlated with basal glucose oxidation (r 5 20.56, P 5 0.01) and basal RQ (r 5 20.52, P 5 0.02); data not shown. Maximum glycogen synthase activity measured with or without insulin treatment is not associated with measures of in vivo glucose or lipid metabolism (data not shown).
Figure 1. Relationship between basal GSFA in cultured muscle cells and (A) basal RQ, basal carbohydrate oxidation rates (B), and (C) basal lipid oxidation rates measured on muscle donors using indirect calorimetry in the postabsorptive state.
Table II. Characteristics of Subjects at the Extremes of Basal RQ High and low basal RQ groups*
M/F Age (yr) Weight (kg) Body fat (%) Fasting glucose (mM) 2-h glucose (mM) Fasting insulin (pM) Basal RQ Glycogen synthase: 2 insulin‡ Low G6P High G6P Fractional activity Glycogen synthase: 1 insulin‡ Low G6P High G6P Fractional activity
High
Low
P§
4/2 3262 108614 3662 4.660.2 6.760.8 3606102 0.84560.005
4/2 3263 95610 3364 4.960.3 7.360.7 204654 0.77060.004
NS NS NS NS NS NS 0.0001
1.460.2 3.460.5 0.4160.04
2.660.4 4.660.6 0.5760.02
0.02 NS 0.01
2.560.5 3.960.8 0.6760.06
3.760.5 4.660.6 0.8060.02
NS NS 0.06
*Subjects are equally divided between groups at extremes for basal RQ, matched for age and sex. ‡ Low (0.17 mM) and high (7.2 mM) G6P activity units are nmole/min.mg protein. § NS 5 not significant.
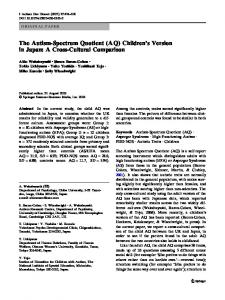
The results in Table II compare the characteristics of subjects matched for age and sex at the high and low extremes of basal RQ. These two groups differ in basal glycogen synthase activity and have similar percent total body fat and fasting glucose. Although the fasting insulins are not statistically different between the two groups, the high basal RQ group tends to have elevated fasting insulin in order to maintain their fasting glucose concentrations in the normal range. Maximum glycogen synthase (7.2 mM G6P) is not significantly different between the two groups. Using 0.17 mM G6P, insulin stimulated the glycogen synthase activity 1.1 nmol/min mg protein for both basal RQ groups. Basal and insulin-stimulated GSFA in cultured muscle cells are correlated with glucose storage rates measured during a high dose insulin infusion step of the euglycemic hyperinsulinemic clamp (r 5 0.47, P 5 0.04; and r 5 0.47, P 5 0.03; Fig. 2). During a low dose insulin infusion these relationships are not significant. These relationships are significant only after omitting two outliers that exceed 2 SD in storage rate from the group mean (r 5 0.57, P 5 0.01, basal; and r 5 0.51, P 5 0.02, insulin stimulated). Percent fat, insulin-stimulated glucose, and lipid oxidation rates or insulin-stimulated glucose disposal rates are not correlated with GSFA (data not shown).
Discussion Skeletal muscle has been identified as the principle site for reduced insulin-mediated glucose incorporation into glycogen in insulin resistant subjects (14). Insulin-stimulated glycogen synthase activity, a rate-limiting step for glycogen synthesis, is reduced in muscle from insulin resistant subjects (15). Recent investigations have demonstrated a reduction in insulin-stimulated skeletal muscle glucose storage rates and GSFA as a result of increased plasma lipid or free fatty acid concentrations
(16–18). An increase in fat mass is predicted by an elevated RQ (3), but may result from abnormal fat storage, reduced fat mobilization, or inhibition of lipid oxidation. These results indicate that both obesity and insulin resistance could be initiated by abnormalities of lipid metabolism which originate outside of skeletal muscle cells. It is not clear that skeletal muscle has inherent metabolic defects that contribute to either obesity or insulin resistance. Cultured muscle cells from subjects over a range of obesity and insulin resistance provide a system to identify intrinsic metabolic characteristics of skeletal muscle that are expressed independent of the host environment. The purpose of this study was to examine how carbohydrate and lipid metabolism measured on muscle cell donors, in vivo, relate to the glycogen synthase activity of their cultured muscle cells. The results in Fig. 1 show that basal myoblast GSFA is reduced in subjects with elevated basal RQ. A variety of mechanisms could explain this apparent link between metabolic regulation in the whole body and in cultured muscle cells. Cultured muscle cells may retain cytoplasmic metabolic regulators from the in vivo muscle environment of the muscle donor. This explanation is unlikely considering that the cells used in these experiments are the result of cell population doublings occurring over one month or more of culture and that each doubling dilutes the original cell cytoplasm by one half. It is also possible that each muscle donor’s muscle cell metabolic characteristics are retained in the replicating nucleic acids which control early steps in myoblast differentiation. These metabolic characteristics could be the result of the pre-biopsy environment of the myoblast or the genotype of each individual’s muscle tissue. All of these explanations share the concept that the cause(s) of low GSFA in cell culture and elevated basal RQ in vivo have a common mechanism in the subjects studied here. The basal correlations in Fig. 1 A do not necessarily indicate that noncultured skeletal muscle biopsies from fasted subjects would have GSFA that is inversely related to their basal RQ values. We cannot be certain that the metabolic control of GSFA expressed in myoblasts reflects the regulation of GSFA in fully differentiated muscle fibers in vivo. The correlation in Fig. 1 A does suggest that the differences between subjects in the regulation of myoblast GSFA reflect differences in regulation of oxidative metabolism in vivo either for skeletal muscle or other tissues that contribute to the basal RQ. In a previous study, obese compared with lean subjects had elevated RQ values and reduced glycogen synthase fractional activities in noncultured muscle biopsies obtained after hyperglycemia and basal insulin replacement (19). Regardless of which tissues make the most significant contribution to basal RQ, the cultured myoblast may be a system to define differences between subjects in regulation of their oxidative metabolism. Evidence has been published (20) supporting an important role for skeletal muscle in explaining individual differences in metabolic rate. Results on resting measures of forearm O2 uptake per gram muscle corrected for the 40–50% of body weight accounted for by skeletal muscle indicated that 40–50% of the interindividual variability in systemic metabolic rate (adjusted for differences in fat free mass, fat mass, age, and sex) was explained by the variability in resting forearm metabolism. This variability is likely due to differences in individual resting skeletal muscle metabolic rate (20). The contribution that skeletal muscle makes to individual differences in basal substrate oxiRespiratory Quotient and Myoblast Glycogen Synthase
2253
Figure 2. Relationship between low (A and B) or high (C and D) dose insulin-stimulated glucose storage rates of muscle cell donors in vivo and GSFA determined in basal (A and C) and 1027 M insulin-stimulated (B and D) cultured muscle cells. Correlation coefficients for low dose insulin infusion in vivo were not significant (ns). Omitting two outliers that are . 2 SD beyond the group mean for storage rate in A and B, the correlation coefficients are: r 5 0.57, P 5 0.01; and r 5 0.51, P 5 0.02.
dation may depend on the same regulatory mechanisms that produce differences in cultured muscle GSFA. A high RQ, indicating a low ratio of lipid to glucose oxidation rates, predicts subsequent weight gain in Pima Indians (3) and in nonobese Caucasian men (4). Percent fat has been positively correlated with respiratory exchange ratios determined during low intensity exercise (6), and led to the contention that skeletal muscle fatty acid oxidation has an important role in human obesity. This is further supported by the observation of an inverse correlation between 24-h RQ and skeletal muscle mitochondrial beta-hydroxyacyl-coenzyme A dehydrogenase in a group of Caucasian subjects (21). These observations suggest that the subjects with a high basal RQ also have low GSFA in their cultured myoblasts and are at increased risk for weight gain. Previous studies have demonstrated abnormal glycogen synthase activity in muscle biopsies associated with reduced insulin-mediated glucose storage and incorporation into muscle glycogen (7). The studies in Fig. 2 show that low GSFA in cultured cells is observed for subjects with reduced insulin-medi2254
Mott et al.
ated glucose storage rates in vivo. These observations indicate that the previously described reduced GSFA in cultured muscle from type II diabetics (22) is also present in insulin-resistant nondiabetic subjects, supporting the inherent nature of this defect in cultured muscle for subjects at risk for NIDDM. Previous studies on cultured muscle have also demonstrated reduced glucose transport (23) for NIDDM subjects and reduced insulin-stimulated glucose uptake into glycogen for nondiabetic subjects with reduced insulin-mediated glucose disposal rates (12). These studies support the concept that the principal elements leading to reduced insulin action for glucose storage in vivo are expressed in cultured skeletal muscle from nondiabetic insulin resistant subjects. Investigations of denervated rodent muscle indicate alterations in both glucose and lipid metabolism similar to those observed in insulin resistance and obesity. Denervation reduces basal and insulin stimulated glycogen synthase activity in hemidiaphrams (24) and reduces glucose uptake in soleus muscle in conjunction with increased diacyglycerol concentrations and insulin stimulated glucose carbon incorporation into
lipid (25). Investigations studying insulin resistant obese mice have recently generated a hypothesis for co-ordinate regulation of glucose and lipid metabolism in muscle tissue (26). These investigators suggest a potentially critical role for elevated malonyl CoA and long chain fatty acid CoA (LCFACoA) in association with reduced lipid oxidation rates in skeletal muscle, leading to increased fat mass and inhibition of insulin action. Malonyl CoA previously has been shown to inhibit lipid oxidation (27) and recent investigations have demonstrated the potential effect of elevated muscle triglycerides on insulin action (28, 29). The apparent co-ordinate regulation between basal in vitro GSFA and in vivo basal substrate oxidation rates reported here, is compatible with the potentially central role of malonyl CoA and LCFACoA concentrations in regulation of both muscle glucose and lipid metabolism. The decrease in fractional glycogen synthase activity is assumed to represent an increase in phosphorylation of glycogen synthase (30). An increase of in vivo basal RQ may also result from a phosphorylation/dephosphorylation step that regulates lipid and carbohydrate oxidation rates (Fig. 3). Type-1 protein phosphatase bound to a glycogen targeting subunit (PP-1G) dephosphorylates glycogen synthase (31) and increased the enzyme fractional activity. Previous studies on noncultured human muscle biopsies have indicated a significantly reduced fasting PP-1G activity in insulin resistant subjects (11, 32). The putative target for PP-1G action leading to altered lipid or carbohydrate oxidation rates has not been identified. This target would reduce lipid oxidation rates leading to reduced insulin action secondary to increased muscle LCFACoA concentrations as suggested above (26). The reduced basal GSFA in cultured muscle from subjects with reduced high dose insulin-mediated carbohydrate storage rates (Fig. 2) appears to conflict with previous studies (11, 32)
on noncultured muscle biopsies where similar fasting GSFA was observed for insulin-sensitive and -resistant subjects. Unlike the noncultured fully differentiated muscle, the myoblasts are both glucose and serum starved resulting in identical environments for comparison of different subjects in the basal state. Fasting muscle biopsies that are not cultured can reflect differences in both the plasma glucose and insulin which characterize insulin-resistant and diabetic subjects. The failure of previous studies to detect abnormal glycogen synthase activity in noncultured biopsies from fasting insulin-resistant subjects may be explained, in part, by the fasting hyperinsulinemia in these subjects. After a 42-h incubation in serum-free media, reduced basal glycogen synthase fractional activities in cultured muscle cells are associated with low insulin-stimulated carbohydrate storage rate in vivo. These low enzyme activities, which also relate to high basal RQ, occur in the apparent absence of abnormal short term insulin signal transduction. It is possible that non– insulin-dependent regulation of basal GSFA in cultured cells involves regulatory elements that would also lead to elevated LCFACoA and triglyceride. Resistance to insulin action for glucose disposal may only occur when sufficient lipid and free fatty acids accumulate to inhibit insulin signal transduction. Glycogen synthase fractional activities in these cultured muscle cells are elevated compared with an earlier report for cultured fibroblasts (33). A direct comparison of cultured myoblast and fibroblast fractional activities is difficult because the activity in the numerator for the two cell types was assayed with 0.17 mM G6P (34) and no G6P (35), respectively. G6P is an allosteric activator of glycogen synthase and produces an apparent increase in cultured muscle compared with cultured fibroblast fractional activities. These studies indicate that elements for regulation of basal RQ and insulin-mediated glucose storage, in vivo, regulate the
Figure 3. Hypothetical mechanisms relating reduced basal GSFA with reduced basal RQ leading to reduced insulin action and increased obesity. Respiratory Quotient and Myoblast Glycogen Synthase
2255
phosphorylation state of glycogen synthase in cultured muscle cells. Identification of these control mechanisms may explain, in part, the close relationship between obesity and insulin resistance for glucose disposal.
Acknowledgments This study is a product of constant precision and attention to detail in the laboratory for which we thank Karen Stone. We also thank the clinical staff for their professional assistance. Most of all we are grateful to the volunteers for their cooperation during this study.
References 1. Lillioja, S., and C. Bogardus. 1988. Obesity and insulin resistance: lessons learned from the Pima Indians. Diabetes Metab. Rev. 4:517–540. 2. Bogardus, C., S. Lillioja, and P.H. Bennett. 1991. Pathogenesis of NIDDM in Pima Indians. Diabetes Care. 14:685–690. 3. Zurlo, F., S. Lillioja, A.E. Del Puente, B.L. Nyomba, I. Raz, M.F. Saad, B.A. Swinburn, W.C. Knowler, C. Bogardus, and E. Ravussin. 1990. Low rates of fat to carbohydrate oxidation as a predictor of weight gain: study of 24-hr RQ. Am. J. Physiol. 259:E650–E657. 4. Seidell, J.C., D.C. Muller, J.D. Sorkin, and R. Andres. 1992. Fasting respiratory exchange ratio and resting metabolic rate as predictors of weight gain: the Baltimore longitudinal study on aging. Int. J. Obes. 16:667–674. 5. Froidevaux, F., Y. Schutz, L. Christin, and E. Jequier. 1993. Energy expenditure in obese women before and during weight loss, after refeeding and in the weight-relapse period. Am. J. Clin. Nutr. 57:35–42. 6. Wade, A.J., M.M. Marbut, and J.M. Round. 1990. Muscle fibre type and aetiology of obesity. Lancet (N. Am. Ed.). 335:805–808. 7. Young, A.A., C. Bogardus, D. Wolfe-Lopez, and D.M. Mott. 1988. Muscle glycogen synthesis and disposition of infused glucose in humans with reduced rates of insulin-mediated carbohydrate storage. Diabetes. 37:303–308. 8. Tataranni, P.A., and E. Ravussin. 1995. Use of dual-energy X-ray absorptiometry in obese individuals. Am. J. Clin. Nutr. 62:730–734. 9. Lillioja, S., D.M. Mott, J.K. Zawadski, A.A. Young, W.G.H. Abbott, W.C. Knowler, P.H. Bennett, P. Moll, and C. Bogardus. 1987. In vivo insulin action is familial characteristic in non-diabetic Pima Indians. Diabetes. 36:1329– 1335. 10. Steele, R. 1959. Influences of glucose loading and of injected insulin on hepatic glucose output. Ann. NY Acad. Sci. 82:420–430. 11. Kida, Y., A.E. Puente, C. Bogardus, and D.M. Mott. 1990. Insulin resistance is associated with reduced fasting and insulin-stimulated glycogen synthase phosphatase activity in human skeletal muscle. J. Clin. Invest. 85:476–481. 12. Thompson, D.B., R. Pratley, and V. Ossowski. 1996. Human primary myoblast cultures from non-diabetic insulin resistant subjects retain defects in insulin action. J. Clin. Invest. 98:2346–2350. 13. Howard, B.V., H. Hidaka, F. Ishibashi, R. Fields, and P.H. Bennett. 1981. Type II diabetes, and insulin resistance; evidence for lack of inherent cellular defect in insulin sensitivity. Diabetes. 30:562–567. 14. Shulman, G.I., D.L. Rothman, T. Jue, P. Stein, R.A. DeFronzo, and R.G. Shulman. 1990. Quantitation of muscle glycogen synthesis in normal subjects and subjects with non-insulin dependent diabetes by 13C nuclear magnetic reasonance spectroscopy. N. Engl. J. Med. 322:223–228. 15. Bogardus, C., S. Lillioja, K. Stone, and D. Mott. 1984. Correlation between muscle glycogen synthase activity and in vivo insulin action in man. J. Clin. Invest. 73:1185–1190. 16. Boden, G., F. Jadali, J. White, Y. Liang, M. Mozzoli, Z. Chen, E. Coleman, and C. Smith. 1991. Effects of fat on insulin-stimulated carbohydrate me-
2256
Mott et al.
tabolism in normal men. J. Clin. Invest. 88:960–966. 17. Kelly, D.E., M. Mokan, J.A. Simoneau, and L.J. Mandarino. 1993. Interaction between glucose and free fatty acid metabolism in human skeletal muscle. J. Clin. Invest. 92:91–98. 18. Felley, C.P., E.M. Felley, G.D. vanMelle, P. Frascarolo, E. Jequier, and J.P. Felber. 1989. Impairment of glucose disposal by infusion of triglyceride in humans: role of glycemia. Am. J. Physiol. 256:E747–E752. 19. Mandarino, L.J., A. Consoli, A. Jain, and D.E. Kelly. 1996. Interaction of carbohydrate and fat fuels in human skeletol muscle: impact of obesity and NIDDM. Am. J. Physiol. 270:E463–E470. 20. Zurlo, F., K. Larson, C. Bogardus, and E. Ravussin. 1990. Skeletal muscle metabolism is a major determinant of resting energy expenditure. J. Clin. Invest. 86:1423–1427. 21. Zurlo, F., P.M. Nemeth, R.M. Choksi, S. Sesodia, and E. Ravussin. 1994. Whole body energy metabolism and skeletal muscle biochemical characteristic. Metabolism. 43:481–486. 22. Henry, R.R., T.P. Ciaraldi, L. Abrams-Carter, S. Mudaliar, K.S. Park, and S.E. Nikoulina. 1996. Glycogen synthase activity is reduced in cultured skeletal muscle of non-insulin dependent diabetes mellitus subjects. Biochemical and molecular mechanisms. J. Clin. Invest. 98:1231–1236. 23. Henry, R.R., L. Abrams, S. Nikoulina, and T.P. Ciaraldi. 1995. Insulin action and glucose metabolism in non-diabetic control and NIDDM subjects. Comparison using human skeletal muscle cell cultures. Diabetes. 44:936–946. 24. Smith, R.L., and J.C. Lawrence, Jr. 1984. Insulin action in denervated rat hemidiaphragms. Decreased hormonal stimulation of glycogen synthesis involves both glycogen synthase and glucose transport. J. Biol. Chem. 259:2201– 2207. 25. Heydrick, S.J., N.B. Ruderman, T.G. Kurowski, H.B. Adams, and K.S. Chen. 1991. Enhanced stimulation of diacylglycerol and lipid synthesis by insulin in denervated muscle. Altered protein Kinase C activity and possible link to insulin resistance. Diabetes. 40:1707–1711. 26. Saha, A.K., T.G. Kurowski, J.R. Colca, and N.B. Ruderman. 1994. Lipid abnormalities in tissues of the KKAY mouse: effects of pioglitazone on malonyCoA and diacylglycerol. Am. J. Physiol. 267:E95–E101. 27. Chen, S., A. Ogawa, M. Ohneda, R.H. Unger, D.W. Foster, and J.D. McGarry. 1994. More direct evidence for a malonyl-CoA-carnitine palmitoyltransferase I interaction as a key event in pancreatic b-cell signaling. Diabetes. 43:878–883. 28. Phillips, D.I.W, S. Caddy, V. Llic, B.A. Fielding, K.N. Frayn, A.C. Borthwick, and R. Taylor. 1996. Intramuscular triglyceride and muscle insulin sensitivity: evidence for a relationship in non-diabetic subjects. Metabolism. 45: 947–950. 29. Pan, D.A., S. Lillioja, A.D. Kriketos, M.R. Milner, L.A. Baur, C. Bogardus, A.B. Jenkins, and L.H. Storlien. 1997. Skeletal muscle triglyceride levels are inversely related to insulin action. Diabetes. 46:983–988. 30. Roach, P.J., and J. Larner. 1976. Rabbit skeletal muscle glycogen synthase. II. Enzyme phosphorylation state and effector concentrations as interacting control parameters. J. Biol. Chem. 251:1920–1925. 31. Dent, P., A. Lavoinne, S. Nakielny, P.W. Caudwell, and P. Cohen. 1990. The molecular mechanism by which insulin stimulates glycogen synthesis in mammalian skeletal muscle. Nature. 348:302–308. 32. Kida, Y.I., I. Raz, R. Maeda, B.L. Nyomba, K. Stone, C. Bogardus, J. Sommercorn, and D.M. Mott. 1992. Defective insulin response of phosphorylase phosphatase in insulin-resistant humans. J. Clin. Invest. 89:610–617. 33. Hidaka, H., B.V. Howard, F.C. Kosmakos, R.M. Fields, J.W. Criag, P.H. Bennett, and J. Larner. 1980. Insulin stimulation of glycogen synthase in cultured human diploid fibroblasts. Diabetes. 29:806–810. 34. Guinovart, J.J., A. Salavert, J. Massague, C.J. Ciudad, E. Salsas, and E. Itarte. 1979. Glycogen synthase: a new activity ratio assay expressing a high sensitivity to the phosphorylation state. FEBS Lett. 106:284–288. 35. Thomas, J.A., K.K. Schlender, and J. Larner. 1968. A rapid filter paper assay for UDP glucose-glycogen glucosyltransferase, including an improved biosynthesis of UDP-14C-glucose. Anal. Biochem. 25:486–499.