In press for the journal Mitigation and Adaptation Strategies for Global Change, as part of the special issue entitled: “Northeast United States Climate Impact Assessment” guest edited by: Dr. Cameron P. Wake, University of New Hampshire; Dr. Peter Frumhoff, Union of Concerned Scientists; Dr. James McCarthy, Harvard University; Dr. Jerry Melillo, Marine Biological Laboratory; Dr. Susanne Moser, National Center for Atmospheric Research; and Dr. Don Wuebbles, University of Illinois. July 2007
Potential Effects of Climate Change and Rising CO2 on Ecosystem Processes in Northeastern U.S. Forests S.V. Ollinger1, C.L. Goodale2, K. Hayhoe3 and J.P Jenkins1 Submitted to Mitigation and Adaptation Strategies for Global Change
1. Institute for the Study of Earth, Oceans, and Space, University of New Hampshire, Durham, NH, USA. Phone: 1-603-862-2926. Fax: 1-603-862-0188. email:
[email protected] 2. Department of Ecology & Evolutionary Biology, Cornell University, Ithaca, NY, USA 3. Department of Geosciences, Texas Tech University, Lubbock, TX, USA. Running Head: Climate change effects on forest ecosystems
NECIA • 1
In press for the journal Mitigation and Adaptation Strategies for Global Change, as part of the special issue entitled: "Mitigation and Adaptation Strategies in the Northeast U.S.” guest edited by "Dr. Cameron P. Wake"
Abstract. Forest ecosystems represent the dominant form of land cover in the northeastern United States and are heavily relied upon by the region’s residents as a source of fuel, fiber, structural materials, clean water, economic vitality, and recreational opportunities. Although predicted changes in climate have important implications for a number of ecosystem processes, our present understanding of their long-term effects is poor. In this study, we used the PnET-CN model of forest carbon (C), nitrogen (N) and water cycling to evaluate the effects of predicted changes in climate and atmospheric carbon dioxide (CO2) on forest growth, C exchange, water runoff, and nitrate (NO3-) leaching at five forest research sites across the northeastern U.S. We used four sets of statistically downscaled climate predictions from two general circulation models (the Hadley Centre Coupled Model, version 3 and the Parallel Climate Model) and two scenarios of future CO2 concentrations. A series of model experiments was conducted to examine the effects of future temperature, precipitation, CO2, and various assumptions regarding the physiological response of forests to these changes. Results indicate a wide range of predicted future growth rates. Increased growth was predicted across deciduous sites under most future conditions, while growth declines were predicted for spruce forests under the warmest scenarios and in some deciduous forests when CO2 fertilization effects were absent. Both climate and rising CO2 contributed to predicted changes, but their relative importance shifted from CO2-dominated to climate-dominated from the first to second half of the 21st century. Predicted runoff ranged from no change to a slight decrease, depending on future precipitation and assumptions about stomatal response to CO2. Nitrate leaching exhibited variable responses, but was highest under conditions that imposed plant stress with no physiological effects of CO2. Although there are considerable uncertainties surrounding predicted responses to climate change, these results provide a range of possible outcomes and highlight interactions among processes that are likely to be important. Such information can be useful to scientists and land managers as they plan on means of examining and responding to the effects of climate change. Key words: climate change, CO2, forest ecosystems, carbon cycling, NPP, NEP, nitrogen, nitrate, runoff 1. Introduction There is broad scientific consensus that human alteration of the global carbon (C) cycle has induced a change in climate that is expected to continue into the foreseeable future (Intergovernmental Panel on Climate Change [IPCC] 2001). A growing body of literature has begun documenting the consequences of this change, which include accelerated melting of Arctic and Antarctic ice sheets (Alley et al. 2005), increased Arctic river discharge (Peterson et al. 2002), altered vegetation phenology (Schwartz et al. 2006), and shifts in the distributions of plant and animal species (Root et al. 2003). Across the northeastern U.S., mean annual temperatures have increased 0.7º C over the past 30 years (0.26o C per decade), and are expected to increase another 2-6o C over the next century. Our understanding of what climate change and rising carbon dioxide (CO2) will mean for the health and function of northeastern U.S. forests is presently limited. Although insights can be gained from retrospective studies and present-day climate gradients, the expected rates of change for both CO2 and climate are unprecedented in recent geological history and can only be
NECIA • 2
In press for the journal Mitigation and Adaptation Strategies for Global Change, as part of the special issue entitled: "Mitigation and Adaptation Strategies in the Northeast U.S.” guest edited by "Dr. Cameron P. Wake"
addressed using costly experiments or ecosystem models. To date, whole ecosystem warming experiments have not been undertaken in mature forests. There have been only a handful of fieldscale forest CO2-enrichment experiments; most of these are in young plantations, and none are in the Northeast. Concurrent exposure to multiple environmental change factors complicate predictions further due to interactions that can either accentuate or offset the effects of individual stressors. For instance, although forests may grow faster in a warmer, CO2-rich world, increased growth could also lead to higher evapotranspiration and reduced runoff to streams (Huntington 2003). Rising temperatures may cause increased drought stress, even under increased precipitation, although the effect of rising CO2 on leaf stomatal conductance should at least partially offset this effect (Medlyn et al. 2001). Limits on soil nitrogen (N) availability may constrain growth in forests that would otherwise stimulated by rising CO2 or temperature (e.g., Luo et al. 2006), unless offset by atmospheric N deposition or warming-driven increases in soil N cycling. Multi-factor manipulation experiments can provide valuable tests of certain combinations of these changes, but ecosystem models are needed to predict interactive effects across the full range of conditions likely to be experienced by native northeastern forests. The purpose of this study is to apply a widely-used ecosystem model representing our current understanding of relevant biogeochemical and physiological processes with a new set of high resolution climate predictions for the northeastern U.S. To date, model analyses designed to assess climate change effects on northeastern forests have used now-outdated and coarse-scale climate scenarios, and have had limited treatment of historical N deposition and forest disturbance (e.g., Bolker et al. 1995; Aber et al. 1995; Jenkins et al. 2000). Climate change can be expected to bring a variety of consequences to the region’s forests, including shifts in the composition of dominant trees and in the composition of forest pests and pathogens favored under warmer conditions (see Iverson et al. and Paradis et al. in this issue). Here, we focus on projected effects of changes in climate and CO2 on ecosystem processes, including forest growth (net primary production; NPP), C exchange (net ecosystem production; NEP), water runoff, and leaching of nitrate (NO3-) from soils to surface waters. 2. Methods 2.1 Study Sites Five northeastern U.S. forest research sites were chosen to represent a range of conditions across the region (Table 1). All sites have long histories of ecosystem research, providing sufficient information to parameterize models for vegetation type and disturbance history. Sites used for model simulations were: Huntington Forest, Adirondacks, NY (Hunt); Biscuit Brook, Catskills, NY (Bisc); Hubbard Brook, White Mountains, NH (HB); Harvard Forest, Petersham, MA (HF); and Howland Forest, Howland, ME (How). Four of the sites are dominated by deciduous tree species (yellow birch, Betula alleghaniensis; red maple, Acer rubrum; sugar maple, Acer saccharum; American beech, Fagus grandifolia; and red oak, Quercus rubrum) and one site (Howland, ME) is dominated by evergreens (red spruce, Picea rubens; and eastern hemlock, Tsuga canadensis). Although northward shifts in the distributions of some tree species are predicted to occur by 2100 (Iverson et al. this issue), consideration of species migration effects was beyond the scope of the model simulations presented here.
NECIA • 3
In press for the journal Mitigation and Adaptation Strategies for Global Change, as part of the special issue entitled: "Mitigation and Adaptation Strategies in the Northeast U.S.” guest edited by "Dr. Cameron P. Wake"
Table 1. Site and disturbance history parameters for the five study sites used in the analysis. Location coordinates are latitude and longitude, respectively, in decimal degrees. Soil water holding capacity (WHC) is in cm. Nitrogen deposition (N Dep.) values are contemporary annual averages in gN m-2 yr-1. Site
Disturbance history typeyearmortalityremoved
Location
Forest type
WHC
N Dep.
Biscuit Brook, NY
41.99 -74.50
Oak, red maple
12
0.96
harvest harvest
1859 1916
90% 90%
80% 80%
Murdoch and Stoddard 1992
Huntington Forest, NY
43.98 -74.23
Northern hardwood
12
0.61
harvest harvest
1859 1916
90% 90%
80% 80%
Mitchell et al. 2001
Harvard Forest, MA
42.5 -72.2
Oak, red maple
18
0.80
Agric.
17501850
100%
5%/yr
Foster and Aber 2004
Hubbard Brook, NH
43.94 -71.75
Northern hardwood
12
0.64
harvest harvest wind
1904 1919 1938
20% 80% 20%
80% 80% 40%
Likens and Bormann 1992
Howland Forest, ME
45.25 -68.73
Spruce
18
0.39
uncut and unmanaged
Reference
Hollinger et al. 1999
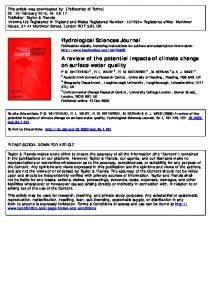
2.2 PnET-CN Model Description PnET-CN is a monthly time-step forest ecosystem model that combines algorithms for processes such as photosynthesis, evapotranspiration, litter production, decomposition, and N mineralization along with monthly climate inputs to estimate complete fluxes of C, N, and water (See schematic in Aber et al. 1997; Ollinger et al. 2002). The model uses a multi-layered submodel of photosynthesis and phenology developed by Aber et al. (1995, 1996) and modified by Ollinger et al. (1997, 2002) to account for the effects of rising CO2 and tropospheric ozone. The productive potential of forest canopies is dependent on canopy N content (Reich et al. 1999) and on vertical gradients in light and leaf structure through the canopy. Stomatal conductance varies with photosynthesis such that water use efficiency is a function of CO2 gain and is inversely related to atmospheric vapor pressure deficit. Actual evapotranspiration and moisture stress are calculated as functions of plant water demand and available soil water. Photosynthetic response curves for light and temperature were derived by Aber and Federer (1992). The temperature effect on gross photosynthesis is represented using a multiplier which varies between 0 and 1, determined as a parabolic function with minimum and optimum temperature values parameterized from the literature (Figure 1). Temperature optima for northern hardwoods and spruce-fir were set at 24 o C and 20o C, respectively (Aber et al. 1995). Foliar respiration is a function of gross photosynthesis and increases with temperature using a Q10 factor of 2 (Aber and Federer 1992). The model’s CO2 response builds on findings from C enrichment experiments indicating that plants maintain relatively constant ratios of internal to ambient CO2 concentrations (Ci/Ca ratios) in response to varying atmospheric CO2 (e.g., Drake and Gonzàlez-Meler 1996) and that leaf photosynthetic rates at varying CO2 concentrations scale along stable A-Ci curves (Ellsworth 1999; Nowack et al. 2004). In PnET, these responses are captured using a Michaelis-Menten equation fit to normalized A-Ci curves. Internal leaf CO2 concentrations (Ci) are estimated from Ci/Ca ratios, which are unaffected by ambient CO2, but vary slightly as a function of foliar N. This reflects greater internal CO2 assimilation, and greater draw-down of Ci, in foliage with higher N concentrations. The effect of CO2 on stomatal conductance (Medlyn et al. 2001) is handled by treating photosynthesis and conductance as coupled processes such that changes in conductance are proportional to the change in CO2 concentrations across the stomatal boundary as ambient CO2 is altered (Ollinger et al. 2002).
NECIA • 4
In press for the journal Mitigation and Adaptation Strategies for Global Change, as part of the special issue entitled: "Mitigation and Adaptation Strategies in the Northeast U.S.” guest edited by "Dr. Cameron P. Wake"
Figure 1. Temperature effect on gross photosynthesis (psn.) (left) and foliar respiration (center) for northern hardwoods (solid line) and spruce-fir (dotted line). Temperature effect on soil decomposition rate and gross nitrogen mineralization (right).
Added to these canopy processes in PnET-CN are allocation and accumulation of C and N in live biomass, dead wood, and soil organic matter, as well as algorithms for N mineralization and nitrification, plant N uptake, and leaching losses (Aber et al. 1997). At present, PnET-CN includes only two detrital organic matter pools: dead wood, and a single soil organic matter pool with a base mean residence time of 13 years (k = 0.075 y-1). The soil decomposition rate decreases linearly with decreasing soil moisture, and increases exponentially with temperature (Figure 1). Gross N mineralization occurs with decomposition, and the fraction of N reimmobilized increases with soil C/N ratio. Tissue N concentrations change from year-to-year as a function of the availability of C and N in plants and soils. When plants have high internal N pools, the efficiency of N uptake from the soil is reduced. Increased foliar N increases net photosynthesis and hence plant demand for N in the production of new tissues, which completes a negative feedback. C to N ratios in biomass are translated to litter and soil pools. Nitrogen deposition and land use history act through their effects on soil C and N pools, which in turn affect plant and soil C/N ratios, rates of N supply to vegetation, and N losses to drainage water. Historical disturbance effects can persist for several hundred years, depending on disturbance severity and rates of N deposition. Model structure and vegetation parameters used here follow Ollinger et al. (1998, 2002). Site parameters for the sites used in this study are given in Table 1. 2.3 Prior Model Application and Validation in the Northeast Region The PnET models have been used in numerous applications in northeastern U.S. forests and elsewhere, including several of the sites in the present study. These analyses have included a considerable body of validation exercises which have established the model’s suitability for simulating C, N, and water cycles and have also highlighted limitations and sources of error. Because the primary goal of the present study is to examine the model’s response to specific projections of future climate change, we rely here on synthesis of previous validation rather than repeating validation exercises for the sites used in this study. Predicted NPP and biomass accumulation have been evaluated for northeastern forests by Ollinger et al. (1998), Ollinger and Smith (2005) and Goodale et al. (2002) and at Hubbard Brook and Harvard Forest by Aber et al. (1995). Rates of gross and net ecosystem production
NECIA • 5
In press for the journal Mitigation and Adaptation Strategies for Global Change, as part of the special issue entitled: "Mitigation and Adaptation Strategies in the Northeast U.S.” guest edited by "Dr. Cameron P. Wake"
have been tested against eddy covariance CO2 flux data at Harvard Forest by Aber et al. (1996) and Braswell et al. (2005) and at Howland by Richardson et al. (In Press). Ollinger et al. (1998) tested predicted runoff against measured United States Geological Survey (USGS) stream gauge data from a large number of northeastern watersheds, while Aber et al. (1997, 2002) and Aber and Driscoll (1997) examined predictions of seasonal and interannual variation in runoff and NO3- export at Hubbard Brook. Although there is no standard metric for establishing the success of a validation exercise, the collection of PnET analyses carried out thus far have generally yielded a high degree of correspondence between predicted and observed C, N, and water fluxes. Sources of error typically involve inaccuracies in input parameters or a lack of understanding of specific processes. Errors associated with input parameters can often be quantified and occasionally corrected through a combination of sensitivity analyses and investigation into alternative data sources (e.g., Ollinger and Smith 2005). Errors associated with poorly understood mechanisms are more difficult to address and often require additional research. 2.4 Climate and Environmental Inputs PnET-CN requires monthly inputs of average maximum and minimum daily temperature, precipitation, photosynthetically active radiation (PAR), N deposition and atmospheric CO2 concentrations. Temperature and precipitation estimates going back to 1900 were available from the National Oceanic and Atmospheric Administration’s (NOAA) historic climate data network. This data was used in the model up to the point when measurements from on-site or nearby weather station data became available. Climate values for the initialization period from 1700 to 1900 were derived by repeating the 1900—1950 climate record backwards through time, which provided a means of imposing a realistic range of variation while maintaining the appropriate long-term average. PAR measurements are not widely available and are not part of the NOAA historical climate network. However, PAR data has been collected at three of the five study sites (HF, HB, and How) over a period of 10 or more years and solar radiation estimates were available for all five sites from a model described by Ollinger et al. (1995, 1998) and scaled to PAR by Aber et al. (1996). Monthly and annual wet + dry N deposition was estimated for each site from a regional deposition model that was derived by combining gradients in air and precipitation N concentrations with precipitation amounts and deposition velocity estimates (Ollinger et al. 1993, 2002). After Aber and Driscoll (1997), N deposition was held at 20% of its contemporary level prior to 1930 and increased deposition linearly to their present values. Atmospheric CO2 concentrations for 1700 to 2000 were estimated using a nonlinear function that mirrors patterns seen in ice core data and in the Mauna Loa CO2 record (Ollinger et al. 2002). 2.5 Future Climate Scenarios Climate projections for 2000 to 2099 at each of the five sites were generated by Hayhoe et al. (2006) using the PCM (Parallel Climate Model) and HadCM3 (Hadley Centre Coupled Model, version 3) general circulation models (GCMs), statistically downscaled to one-eighth degree or ~10 km spatial resolution. Projections were generated using two scenarios of CO2 and other greenhouse gas emissions (the IPCC Special Report on Emission Scenarios [SRES] higher [A1fi] and lower [B1] scenarios, Nakićenović et al. 2000), yielding four climate scenarios per site (HADA1, HADB1, PCMA1, PCMB1; Table 2). Among these scenarios, the HADA1 projections had the greatest degree of warming, with an average increase of 6.3o C across the five sites for
NECIA • 6
In press for the journal Mitigation and Adaptation Strategies for Global Change, as part of the special issue entitled: "Mitigation and Adaptation Strategies in the Northeast U.S.” guest edited by "Dr. Cameron P. Wake"
the period of 2070-2099. The least amount of warming occurred under the PCMB1 scenario, which simulated a 1.5o C increase over the same time period. The PCMA1 and HADB1 scenarios were intermediate, producing mean annual temperature increases of 3.3o C and 3.2o C, respectively. Annual precipitation increased under all scenarios, ranging from a 14% rise under the PCMB1 scenario to a 34% rise under HADA1. Table 2. Summary of climate predictions at the five study sites for 2070-2099 under four climate model scenarios in contrast to observed means for 1990-1999. Temperature values in oC and precipitation values are in cm yr-1. Year Mean Annual Temperature 1990-1999 Obs. 2070-2099
PCMA1 PCMB1 HADA1 HADB1 Mean Annual Precipitation Obs. 1990-1999 2070-2099
PCMA1 PCMB1 HADA1 HADB1
HB
HF
Bisc
Hunt
How
Mean
4.5
7.5
9.0
5.1
6.4
6.5
7.9 6.2 10.9 8.5
10.7 9.0 14.0 10.6
12.0 10.4 15.2 11.9
8.4 6.7 11.5 8.1
9.8 7.9 12.6 9.2
9.8 8.0 12.8 9.7
146.7
98.4
132.7
102.2
91.7
114.4
146.4 152.3 170.9 161.0
134.5 142.5 156.5 148.4
144.1 149.1 157.8 154.6
115.0 120.3 131.4 125.3
114.0 124.3 148.6 136.5
130.8 137.7 153.0 145.2
To identify potential biases in the climate predictions, model-based climate outputs were begun in 1960, providing more than 40 years of overlap with measured data (Hayhoe et al. 2006). Detailed comparison of predicted and observed values were given by Hayhoe et al. (2006). A general conclusion was that predicted temperature trends closely matched the measured record, albeit with a lesser amount of predicted winter warming than had actually occurred. Although the models successfully captured mean rates of precipitation, agreement was poor on an interannual basis as a result of the much greater degree of interannual variability in precipitation than temperature. For one of the sites used here (HB), simulated precipitation from both PCM and HadCM3 was 20% lower than measured values for the 1960-2000 period, likely due to local effects of mountainous topography. All GCM precipitation estimates for HB were scaled upwards by 20%, effectively imposing a topographic effect on the climate projections. No other bias was observed between GCM-predicted and measured values for temperature or precipitation across the study sites. Because GCM output includes shortwave radiation (SWRad) but not photosynthetically active radiation, future radiation projections were converted from SWRad to PAR using an empiricallybased relationship obtained by comparing predicted and measured values for the period of overlap. This comparison was possible at HB, How, and HF, which all have measured PAR data, and yielded a nonlinear pattern that was consistent across sites and was fit with a logarithmic relationship [PAR = a Ln(SWRad) – b where a and b are derived coefficients]. Because PAR data was not available at Bisc or Hunt, equations used were obtained at HF and HB, respectively, which are the most climatically and physiographically similar.
NECIA • 7
In press for the journal Mitigation and Adaptation Strategies for Global Change, as part of the special issue entitled: "Mitigation and Adaptation Strategies in the Northeast U.S.” guest edited by "Dr. Cameron P. Wake"
Future rates of N deposition in the region are highly uncertain and will depend on the potentially antagonistic effects of growing population densities and more stringent N emissions regulations. As a result, we assumed no change in future N deposition and held each site at its present rate into the future. Future CO2 concentrations were set using the same scenarios (A1fi and B1) as were used to drive the GCM simulations. These scenarios produced CO2 concentrations that increase to 970 ppm (A1fi) and 548 ppm by 2099. 2.6 Model Scenarios For each site, PnET-CN was allowed to equilibrate and run transiently from 1700 to 2100 using the historical climate inputs and future climate projections described above. Historical disturbances related to agriculture and timber harvesting were treated in a similar fashion to that of Ollinger et al. (2002), with harvest scenarios imposed by parameters defining the proportion of biomass killed and the fraction which was removed, and agriculture represented as a fractional annual harvest of vegetation (Table 1). For each of the four climate scenarios, PnET-CN were run using two scenarios of forest response to elevated CO2: the full effects of CO2 on photosynthesis and stomatal conductance described above, and no CO2 fertilization effects on either process. Although CO2 effects on short-term physiology are becoming increasingly well-resolved through CO2 fertilization experiments, there are considerable uncertainties regarding how these processes will play out over decades to centuries. Additionally, although CO2 fertilization studies have shown substantial enhancement of leaf-level photosynthesis, effects on stand-level growth rates have been more moderate (Nowack et al. 2004). Evidence for enhancement of NPP in response to the CO2 rise that has occurred thus far has yet to emerge. Because most ecosystem models, PnET-CN included, use leaf-level responses to scale CO2 effects to whole ecosystems, we view the two scenarios imposed here as an upper and lower bound to the range of responses forests are likely to exhibit. In this study, no assumptions were made about future disturbance patterns or changes in forest composition. Although shifts in species distribution are considered by Iverson et al. (accompanying report in this issue), future patterns of disturbance and human land use are exceedingly difficult to predict and will likely be highly variable. 3. Results and Discussion 3.1 Predicted Forest Growth Predicted NPP under the four climate scenarios and two CO2 fertilization scenarios is shown in Figure 2 and summarized in Table 3. Most scenarios produced increased growth rates as a result of warmer temperatures and an increase in growing season length. When CO2 fertilization effects were included, the mean growth increase for the period from 1990-2000 to 2070-2099 ranged from 25% at Howland to 75% at Biscuit Brook and Hubbard Brook across the four climate scenarios (Table 3). Under the warmest scenario (HADA1), predicted growth at Howland declined throughout the later half of the 21st century. This occurred because the spruce forests at Howland have a lower temperature optimum for photosynthesis (Figure 1) and began to experience temperature stress that was not offset by CO2 fertilization. This result is significant given the prevalence of spruce forests across northern New England and the importance of the pulp and paper industry to the region’s economy.
NECIA • 8
In press for the journal Mitigation and Adaptation Strategies for Global Change, as part of the special issue entitled: "Mitigation and Adaptation Strategies in the Northeast U.S.” guest edited by "Dr. Cameron P. Wake"
Figure 2. Predicted net primary productivity (NPP) (gC m-2 yr-1) for the five study sites in the USA (Biscuit Brook, New York; Hubbard Brook, New Hampshire; Harvard Forest, Massachusetts; Huntington Forest, New York; and Howland, Maine) under four climate scenarios, with and without CO2 enhancement effects. The four climate scenarios result from two climate models (Parallel Climate Model [PCM] and Hadley Center Coupled Model [HAD]), each run with a high (A1) and low (B1) scenario of future CO2. NECIA • 9
In press for the journal Mitigation and Adaptation Strategies for Global Change, as part of the special issue entitled: "Mitigation and Adaptation Strategies in the Northeast U.S.” guest edited by "Dr. Cameron P. Wake"
Table 3. Summary of predicted NPP under contemporary and future climate and CO2 at the five study sites, generated with and without CO2 fertilization effects included in the model. Values are averages (gC m-2 yr-1) of the four climate scenarios over the periods indicated. Year
CO2 effect
Bisc
HB
Hunt
How
HF
1990-2000
Contemporary
606
510
434
334
581
2010-2039
Yes No
813 743
598 526
567 493
357 334
693 555
2040-2069
Yes No
943 742
746 544
688 497
413 335
825 546
2070-2099
Yes No
1065 752
894 575
815 523
417 308
961 543
When CO2 fertilization effects were absent, changes in growth were more modest and ranged from a 24% increase at Biscuit Brook to a 9% decline at Howland. Without CO2 fertilization, growth rates at the four deciduous-dominated sites began to decline by 2099 under the HADA1 scenario as mid-summer temperatures exceeded optima for net photosynthesis. The other three climate scenarios produced no change to moderate increases in growth by the century’s end (Figure 2). Although rising CO2 generally had a greater effect than did changes in climate, most of the CO2 effect was realized during the first half of the 21st century, while changes occurring beyond 2050 were dominated by climate (Figure 3). This pattern stems from the nonlinear nature of the photosynthetic response to CO2, which caused the rate of CO2 enhancement to decrease over time and eventually become saturated. Although projections cannot be made beyond 2099 in this study, the implication of this result is that the beneficial effects of rising CO2 will be transient and will be replaced by increasing temperature stress if warming continues over longer time scales.
Figure 3. Predicted net primary productivity (NPP) (gC m-2 yr-1) for Hubbard Brook, New Hampshire with a rise in CO2, but no change in climate (green lines), in contrast to predictions that include rising CO2 along with the four climate scenarios from two climate models (Parallel Climate Model [PCM] and Hadley Center Coupled Model [HAD]), each run with a high (A1) and low (B1) scenario of future CO2. In the no-climate-change scenarios, climate values for the period from 2000-2099 were generated by reproducing the 1900-1999 record.
NECIA • 10
In press for the journal Mitigation and Adaptation Strategies for Global Change, as part of the special issue entitled: "Mitigation and Adaptation Strategies in the Northeast U.S.” guest edited by "Dr. Cameron P. Wake"
3.2 Net Carbon Exchange Net ecosystem production (NEP), or net C exchange, is the balance between C uptake through photosynthesis and C losses by respiration from living plants and decomposition of dead organic matter. Net ecosystem production is usually equivalent to the whole-ecosystem rate of net C sequestration or loss. Because young, aggrading forests actively accumulate biomass, NEP is often related to forest age and disturbance history to an equal or greater extent than to climate. Nevertheless, changes in climate have potentially important effects on NEP through their effects on both growth and decomposition. The overall pattern of NEP across all model runs was similar in nature to patterns of NPP and the effects of rising CO2 were greater than those of climate (Table 4). Modeled effects of rising CO2 on photosynthesis and biomass accumulation were greater than temperature effects on plant respiration and detrital decomposition. As a result, most scenarios that included CO2 fertilization showed enhanced C uptake over the whole ecosystem. The exception to this pattern was the HADA1 scenario where the effects of increasing temperature stress caused NEP to decline toward the end of the simulations. This was particularly true for Howland, but was also evident at the other four sites (Figure 4).
Table 4. Summary of predicted NEP under contemporary and future climate and CO2 at the five study sites, generated with and without CO2 fertilization effects. Values are averages (gC m-2 yr-1) of the four climate scenarios over the periods indicated. Year
CO2 effect
Bisc
HB
Hunt
How
HF
1990-2000
Contemporary
69.0
35.0
38.2
13.7
150.2
2010-2039
Yes No
220.3 122.5
118.0 35.6
125.5 41.5
29.6 2.1
177.2 97.7
2040-2069
Yes No
245.4 79.2
188.4 36.0
183.8 40.3
63.6 -2.9
213.7 35.1
2070-2099
Yes No
238.1 46.3
210.5 36.0
188.8 38.6
43.1 -14.4
206.6 3.4
In contrast, simulations that lacked CO2 fertilization showed either little change or modest declines in NEP over time (Figure 4). These results indicate that rising temperatures had a relatively small effect on biomass accumulation, either directly through effects on photosynthesis balance, or indirectly through increased N mineralization in soils. Furthermore, interpretation is confounded by the natural process of stand development, which causes NEP to drift towards zero over time as ecosystems recover from past disturbances. Because the Howland site has not been effected by historical agriculture or logging, it had the lowest NEP values going into the study and had become a net C source by the end of the century under several scenarios.
NECIA • 11
In press for the journal Mitigation and Adaptation Strategies for Global Change, as part of the special issue entitled: "Mitigation and Adaptation Strategies in the Northeast U.S.” guest edited by "Dr. Cameron P. Wake"
Figure 4. Predicted net ecosystem production (NEP) (gC m-2 yr-1) for the five study sites in the USA (Biscuit Brook, New York; Hubbard Brook, New Hampshire; Harvard Forest, Massachusetts; Huntington Forest, New York; and Howland, Maine) under four climate scenarios, with and without CO2 enhancement effects. The four climate scenarios result from two climate models (Parallel Climate Model [PCM] and Hadley Center Coupled Model [HAD]), each run with a high (A1) and low (B1) scenario of future CO2. NECIA • 12
In press for the journal Mitigation and Adaptation Strategies for Global Change, as part of the special issue entitled: "Mitigation and Adaptation Strategies in the Northeast U.S.” guest edited by "Dr. Cameron P. Wake"
3.3 Water Yield Under scenarios that included CO2 enhancement effects, predicted annual runoff at the end of the 21st century ranged from relatively little change at Hubbard Brook and Harvard Forest, to modest increases (~10%) at Biscuit Brook and Huntington, and a substantial increase (53%) at Howland (Table 5, Figure 5). The larger response at Howland reflects the predicted decline in spruce forest NPP—and hence water demand—under the warmer climate scenarios, while the more moderate response at the other sites resulted from the tradeoffs between higher temperatures, increased precipitation and greater plant water use efficiency. When CO2 enhancement effects were absent, predictions ranged from no change to a 12% decrease at the deciduous sites and a 33% increase at Howland (Table 5, Figure 5). These lower runoff values reflect the lack of a CO2 effect on stomatal conductance, which prevented the potential for reduced canopy transpiration to offset the greater evaporative demand brought by higher temperatures.
Table 5. Summary of predicted runoff under contemporary and future climate and CO2 at the five study sites, generated with and without CO2 fertilization effects. Values are averages (cm yr-1) of the four climate scenarios over the periods indicated. Year
CO2 effect
Bisc
HB
Hunt
How
HF
1990-2000
Contemporary
72.4
88.7
54.3
46.4
65.2
2010-2039
Yes No
76.9 73.5
84.9 81.1
60.2 59.1
62.9 59.0
62.2 66.3
2040-2069
Yes No
76.9 69.3
83.6 76.9
59.2 55.8
64.1 56.5
61.7 61.8
2070-2099
Yes No
80.7 70.0
87.4 78.2
61.2 56.4
70.8 61.9
63.8 61.1
In addition to changes in annual runoff, the seasonality of runoff is important because it can influence both the potential for altered frequency of flooding events and mid-summer drought. Although the monthly time step of the PnET-CN runs does not allow examination of individual events, all four climate scenarios resulted in a shortening of the spring high flow period and a lengthening of the summer low flow period (data not shown). This resulted from a reduction in, and earlier melting of, the winter snowpack and an earlier onset of water demand by plants. 3.4 Nitrate Leaching Export of NO3- from forest soils to surface waters has been a concern for decades in light of elevated atmospheric N inputs and the deleterious effects associated with base cation removal and acidification of soils and streams (Driscoll et al. 2003). However, predicting N losses from soils has proven difficult, both because N cycling mechanisms associated with immobilization and denitrification remain poorly understood (e.g., Dail et al. 2001; Venterea et al. 2004) and because observations that show declines in stream NO3- over the past several decades do not match expectations based on theories of nutrient retention with ecosystem development (Goodale et al. 2003). Retention of N by ecosystems is also sensitive to a variety of stress factors and the effects of land use and disturbance can persist for decades or centuries (Aber et al. 2002). NECIA • 13
In press for the journal Mitigation and Adaptation Strategies for Global Change, as part of the special issue entitled: "Mitigation and Adaptation Strategies in the Northeast U.S.” guest edited by "Dr. Cameron P. Wake"
Figure 5. Predicted annual runoff (cm yr-1) for the five study sites under four climate scenarios, with and without CO2 enhancement effects. The four climate scenarios result from two climate models (Parallel Climate Model [PCM] and Hadley Center Coupled Model [HAD]), each run with a high (A1) and low (B1) scenario of future CO2.
NECIA • 14
In press for the journal Mitigation and Adaptation Strategies for Global Change, as part of the special issue entitled: "Mitigation and Adaptation Strategies in the Northeast U.S.” guest edited by "Dr. Cameron P. Wake"
Despite these caveats, examining the effects of climate change on N losses predicted by PnETCN can be instructive because climate and CO2 can both have a potentially strong influence on N turnover in soils and N demand by vegetation. Under contemporary conditions (1990-2000), predicted N losses were low across all sites, ranging from 0.05 g m-2 yr-1 at Harvard Forest to 0.32 g m-2 yr-1 at Biscuit Brook, or 6.3% and 33.1% of the annual inputs from N deposition, respectively (Table 6). The differences among sites correspond to differences in rates of N deposition as well as the severity of soil N depletion caused by past disturbance. For example, although Harvard Forest has the second highest rate of N deposition (Table 1), its history of agriculture and timber harvesting result in a high capacity for present-day soil N retention (Aber et al. 1997).
-
Table 6. Summary of predicted NO3 leaching under contemporary and future climate and CO2, generated with and without CO2 fertilization effects at the five study sites. Values are averages (gN m-2 yr-1) of the four climate scenarios over the time periods indicated. Also shown is N leaching as a percent of N inputs from atmospheric deposition. Year
CO2 effect
1990-2000
2010-2039
Yes No
2040-2069
Yes No
2070-2099
Yes No
Bisc
HB
Hunt
How
HF
0.32 33.1%
0.15 23.7%
0.09 15.4%
0.14 35.5%
0.05 6.3%
0.19 19.8% 0.32 33.0%
0.20 31.9% 0.46 72.1%
0.11 18.6% 0.12 19.1%
0.23 60.1% 0.47 121.1%
0.09 11.5% 0.02 3.1%
0.18 18.4% 0.65 67.9%
0.23 35.4% 0.92 143.5%
0.20 32.3% 0.58 94.7%
0.49 124.4% 0.81 207.0%
0.15 18.5% 0.08 10.4%
0.20 21.0% 0.90 94.2%
0.30 46.4% 1.26 197.4%
0.28 46.1% 1.07 174.6%
0.88 224.9% 1.21 311.3%
0.26 32.4% 0.45 56.5%
Under the four climate scenario simulations that included CO2 growth enhancement effects, mean predicted N losses for 2070-2099 increased slightly in the four deciduous stands—to between 21% and 46% of N deposition inputs—whereas N losses at Howland increased to more than twice the input from deposition (Figure 6, Table 6; note that because simulated N inputs remained constant through the 21st century, leaching losses can be compared through time as a fraction of atmospheric inputs). These increases in N loss occurred despite increased plant demand for N by more quickly growing trees, indicating that plant demand for N did not keep pace with increased N availability from accumulated N deposition and from faster N mineralization associated with increasing temperature. The greatest effect at Howland occurred under the HADA1 scenario (Figure 6). The high temperatures of this scenario produced the greatest decline in growth for spruce, which translated to reduced plant N demand, increased N mineralization, and increased potential for elevated nitrification and N leaching.
NECIA • 15
In press for the journal Mitigation and Adaptation Strategies for Global Change, as part of the special issue entitled: "Mitigation and Adaptation Strategies in the Northeast U.S.” guest edited by "Dr. Cameron P. Wake"
Figure 6. Predicted NO3- leaching (gN m-2 yr-1) for the five study sites under four climate scenarios, with and without CO2 enhancement effects. The four climate scenarios result from two climate models (Parallel Climate Model [PCM] and Hadley Center Coupled Model [HAD]), each run with a high (A1) and low (B1) scenario of future CO2.
NECIA • 16
In press for the journal Mitigation and Adaptation Strategies for Global Change, as part of the special issue entitled: "Mitigation and Adaptation Strategies in the Northeast U.S.” guest edited by "Dr. Cameron P. Wake"
Under climate change scenarios that lacked CO2 enhancement effects, mean N losses for the 2070-2099 period increased more markedly and ranged from 57% of atmospheric inputs at Harvard Forest to over three times the atmospheric inputs at Howland (Figure 6). These higher N loss values stem from the lower plant demand for N that occurs in the absence of CO2 fertilization. N leaching losses of the magnitude predicted under the HADA1 scenario and by scenarios that lacked CO2 fertilization effects would likely raise significant concerns for the health of aquatic ecosystems. However, several sources of uncertainty should be considered when interpreting these results. First, if scenarios leading to the decline of spruce at Howland are borne out, it is likely that the growth of other forest types—most likely deciduous forests with higher temperature tolerance—will increase as a result, imposing a higher plant demand for N than predicted by PnET-CN. Secondly, simulations assume constant N inputs and no disturbance throughout the 21st century, would produce increasing soil N pools that would eventually reach saturation. Actual N loss rates could be lower than those predicted here if reductions in N pollution emissions are imposed or if other mechanisms of N removal from ecosystems occur (e.g. loss from denitrification or harvesting). Conversely, an increase in future N deposition could result in N losses that are higher than those predicted here. 4. Conclusions In this study, the potential effects of predicted changes in climate and CO2 on growth rates and C, N, and water balances at five northeastern forest research sites were examined. Although the four climate scenarios and two CO2 response scenarios produced a wide range of results, several generalizations can be made. First, whereas the three moderate climate warmings all produced increased growth rates over the 21st century, the hottest scenario (HADA1) induced significant growth declines at the Howland spruce forest site and began to induce declines at deciduous sites when CO2 growth enhancement effects were absent. Across all climate scenarios, the effects of CO2 fertilization were equal to or greater than the effects of climate alone. Assumptions about CO2 fertilization also had a large influence on predicted ecosystem C balances, with large increases occurring in scenarios that included CO2 enhancement, but saw either small increases or declines in scenarios where CO2 enhancement was absent. Predicted runoff increased across most scenarios, although the degree of increase was generally less than the increase in precipitation, due to the effects of higher temperatures and extended growing season length on evapotranspiration. Predicted N export from NO3- leaching showed little change to moderate increases under most scenarios, reflecting a tradeoff between continued atmospheric N loading and rising plant N demand. However, in climate scenarios that induced declines in growth or lacked CO2 enhancement, the lower N demand by vegetation led to substantial N loss rates, rising to more than three times atmospheric inputs in some circumstances. Predictions generated in this study should be interpreted with consideration of several sources of uncertainty. First, although in viewing the scenarios that either included or lacked CO2 growth enhancement effects as an upper and lower bound to actual CO2 effects, the large differences produced by these assumptions emphasizes the need to improve understanding of long-term ecosystem CO2 response. Major uncertainties remain in understanding plant physiology on the extent to which CO2-driven enhancements in leaf-level photosynthesis would translate into
NECIA • 17
In press for the journal Mitigation and Adaptation Strategies for Global Change, as part of the special issue entitled: "Mitigation and Adaptation Strategies in the Northeast U.S.” guest edited by "Dr. Cameron P. Wake"
enhancements of leaf- and wood production, or would instead be balanced by increased respiration above- or below-ground (Körner et al. 2005; Albani et al. 2006). Secondly, given uncertainties in future N deposition rates, N deposition was held constant through the 21st century. Additional sensitivity analyses can be performed to examine the influence of this assumption, but increasing the level of certainty in PnET-CN predictions will depend on improved N deposition forecasts becoming available. Similarly, other stress factors such as ozone pollution, which are likely to become increasingly important into the future, have not been addressed. Whereas the focus has been on the response of ecosystem processes to changes in climate and CO2, changes in ecosystem composition and distribution will also be important. Although it can be expected that such changes will be small over the course of 100 years or less (due to limitations in tree migration imposed by seed dispersal and the long life spans of trees), they may still be important, particularly in areas that represent ecotones between different forest community types (e.g., the transition between deciduous and evergreen communities along elevation gradients). The potential effects of such species shifts on ecosystem processes should be addressed and will require a coupling between models like PnET-CN with those designed to predict the dynamics and dispersal of forest communities. Finally, although the impacts of high and low future emissions scenarios was examined, there is a possibility of emissions exceeding those projected in the higher A1fi scenario or, through concerted action to reduce greenhouse gas emissions, remaining below those of the lower B1 scenario. Furthermore, the climate models used in this analysis span only the lower two-thirds of the likely range of climate sensitivity (IPCC 2001; Hegerl 2006). Hence, there is also the possibility for changes in temperature or precipitation to fall beyond the range of future conditions examined here.
Acknowledgements: Support for this work was provided by the Northeastern States Research Cooperative, the National Institute of Climate Change Research and the NASA Carbon Cycle Science Program.
NECIA • 18
In press for the journal Mitigation and Adaptation Strategies for Global Change, as part of the special issue entitled: "Mitigation and Adaptation Strategies in the Northeast U.S.” guest edited by "Dr. Cameron P. Wake"
References Aber JD, Federer CA (1992) A generalized, lumped-parameter model of photosynthesis, evapotranspiration and net primary production in temperate and boreal forest ecosystems. Oecologia 92: 463-474 Aber JD, Ollinger SV, Federer CA, Reich PB, Goulden ML, Kicklighter DW, Melillo JM, Lathrop RG (1995) Predicting the effects of climate change on water yield and forest production in the northeastern United States. Climate Research. 5: 207-222. Aber JD, Reich PB, Goulden ML (1996) Extrapolating leaf CO2 exchange to the canopy: a generalized model of forest photosynthesis validated by eddy correlation. Oecologia 106:257-265. Aber JD, Ollinger SV, Driscoll CT (1997) Modeling nitrogen saturation in forest ecosystems in response to land use and atmospheric deposition. Ecological Modeling. 101:61-78. Aber JD, Driscoll CT (1997) Effects of land use, climate variation, and N deposition on N cycling and C storage in northern hardwood forests. Global Biogeochemical Cycles. 11:639648 Aber JD, Ollinger SV, Driscoll CT, Likens GE, Holmes TR, Freuder RJ, Goodale CL (2002) Inorganic N losses from a forested ecosystem in response to physical, chemical, biotic and climatic perturbations. Ecosystems 5:648-658 Albani M, Medvigy D, Hurtt GC, Moorcroft PR (2006) The contributions of land-use change, CO2 fertilization, and climate variability to the eastern US carbon sink. Global Change Biology 12:1-21 Alley RB, Clark PU, Huybrechts P, Joughin I (2005) Ice-sheet and sea-level changes. Science. 310(5747): 456-460 Bolker BM, Pacala SW, Bazzaz FA, Canham CD, Levin SA (1995) Species-Diversity and Ecosystem Response to Carbon-Dioxide Fertilization - Conclusions from a Temperate Forest Model. Global Change Biology 1(5):373-381 Braswell BH, Sacks WJ, Linder E, Schimel DS (2005) Estimating diurnal to annual ecosystem parameters by synthesis of a carbon flux model with eddy covariance net ecosystem exchange observations. Global Change Biology 11:335-355 Dail, DB, Davidson EA, Chorover J (2001) Rapid abiotic transformation of nitrate in an acid forest soil. Biogeochem. 54:131–146 Drake BG, Gonzalez-Meler MA (1996) More efficient plants: a consequence of rising atmospheric CO2? Annual Review of Plant Physiology and Plant Molecular Biology. 48:609-639 Driscoll CT, Whitall D, Aber JD, Boyer E, Castro M, Cronan C, Goodale C, Groffman P, Hopkinson C, Lambert K, Lawrence G, Ollinger S. (2003) Nitrogen Pollution in the Northeastern United States: Sources, Effects and Management Options. BioScience 53:357– 374 Ellsworth DS. (1999) CO2 enrichment in a maturing pine forest: are CO2 exchange and water status in the canopy affected? Plant, Cell and Environment. 22:461-472 Foster DR, Aber JD (eds) (2004) Forests in Time: the environmental consequences of 1000 years of change in New England. Yale University Press, New Haven.
NECIA • 19
In press for the journal Mitigation and Adaptation Strategies for Global Change, as part of the special issue entitled: "Mitigation and Adaptation Strategies in the Northeast U.S.” guest edited by "Dr. Cameron P. Wake"
Goodale CL, Lajtha K, Nadelhoffer KJ, Boyer EW, Jaworski NA (2002) Forest nitrogen sinks in large eastern U.S. watersheds: Estimates from forest inventory and an ecosystem model. Biogeochemistry 57/58:239-266 Goodale CL, Aber JD, Vitousek PM (2003) An unexpected nitrate decline in New Hampshire streams. Ecosystems 6(1):75-86 Hayhoe K, Wake CP, Huntington TG, Luo L, Schwartz MD, Sheffield J, Wood E, Anderson B, Bradbury J, DeGaetano A, Troy TJ, Wolfe D (2006) Past and future changes in climate and hydrological indicators in the US Northeast. Climate Dynamics. DOI 10.1007/s00382-0060187-8 Hegerl, GC, Crowley TJ, Hyde WT, Frame DJ (2006) Climate sensitivity constrained by temperature reconstructions over the past seven centuries. Nature, 440:1029-1032 Hollinger DY, Goltz SM, Davidson EA, Lee JT, Tu K, Valentine HT (1999) Seasonal patterns and environmental control of carbon dioxide and water vapour exchange in an ecotonal boreal forest. Global Change Biology 5:891-902 Huntington TG (2003) Climate warming could reduce runoff significantly in New England. Agricultural and Forest Meteorology 117:193-201 Intergovernmental Panel on Climate Change (IPCC) (2001) Climate Change 2001: The Scientific Basis. Houghton JT, Ding Y, Griggs DJ, Noguer M, van der Linden PJ, Xiaosu D (eds) University Press, Cambridge, UK Iverson L, Prasad A, and Matthews S (this issue) Potential Changes in Suitable Habitat for 134 Tree Species in the Northeastern United States. Mitigation and Adaptation Strategies Jenkins JC, Kicklighter DW, Aber JD (2000) Regional impacts of climate change and elevated carbon dioxide on forest productivity. In: Mickler R, Birdsey R, Hom J (eds) Responses of northern U.S. forests to environmental change. Springer, NY Likens GE, Bormann FH (1995) Biogeochemistry of a Forested Ecosystem, 2nd edition. Springer-Verlag NY Luo Y, Field CB, Jackson RB (2006) Does nitrogen constrain carbon cycling, or does carbon input stimulate nitrogen cycling? Ecology 87:1-2 Medlyn BE, Barton CVM, Broadmeadow MSJ, Ceulemans R, De Angelis P, Forstreuter M, Freeman M, Jackson SB, Kellomaki S, Laitat E, Rey A, Roberntz P, Sigurdsson BD, Strassemeyer J, Wang K, Curtis PS, Jarvis PG (2001) Stomatal conductance of forest species after long-term exposure to elevated CO2 concentration: a synthesis. New Phytologist 149(2): 247-264 Mitchell MJ, McHale PJ, Inamdar S, Raynal DJ (2001) Role of within lake processes and hydrobiogeochemical changes over 16 yr in a watershed in the Adirondack Mountains of New York State, U.S.A. Hydrological Processes 15:1951-1965. Murdoch PS, Stoddard JL (1992) The role of nitrate in the acidification of streams in the Catskill Mountains of New York. Water Resources Research 28:2707-2720 Nakienovi N, et al (2000): IPCC Special Report on Emissions Scenarios. Cambridge University Press, UK Nowak RS, Ellsworth DS, Smith SD (2004) Functional responses of plants to elevated atmospheric CO2–do photosynthetic and productivity data from FACE experiments support early predictions? New Phytologist 162(2):253-280 Ollinger SV, Aber JD, Lovett GM, Millham SE, Lathrop RG, Ellis JM (1993) A spatial model of atmospheric deposition for the northeastern U.S. Ecological Applications 3:459-472
NECIA • 20
In press for the journal Mitigation and Adaptation Strategies for Global Change, as part of the special issue entitled: "Mitigation and Adaptation Strategies in the Northeast U.S.” guest edited by "Dr. Cameron P. Wake"
Ollinger SV, Aber JD, Federer CA, Lovett GM, Ellis JM (1995) Modeling physical and chemical climate of the northeastern U.S. for a geographic information system. USDA Forest Service GTR NE-191 Ollinger SV, Aber JD, Reich PB (1997) Simulating ozone effects on forest productivity. Ecological Applications 7:1237-1251 Ollinger SV, Aber JD, Federer CA (1998) Estimating regional forest productivity and water balances using an ecosystem model linked to a GIS. Landscape Ecology 13:323-334 Ollinger SV, Aber JD, Reich PB, Freuder R (2002) Interactive effects of nitrogen deposition, tropospheric ozone, elevated CO2 and land use history on the carbon dynamics of northern hardwood forests. Global Change Biology. 8:545-562 Ollinger SV, Smith ML (2005) Net Primary Production and Canopy Nitrogen in a temperate forest landscape: an analysis using imaging spectrometry, modeling and field data. Ecosystems 8:760-778 Paradis A, Elkinton J, Hayhoe K, and Buonaccorsi J (this issue) Effect of winter temperatures on the survival of hemlock woolly adelgid, Adelges tsugae, and the potential impact of global warming on its future range in eastern North America. Mitigation and Adaptation Strategies. Peterson BP, Holmes RM, McClelland JW, Vörösmarty CJ, Lammers RB, Shiklomanov AI, Shiklomanov IA, Rahmstorf S (2002) Increasing River Discharge to the Arctic Ocean. Science 298(5601):2171–2173 Reich PB, Ellsworth DS, Walters MB, Vose JM, Gresham C, Volin JC, Bowman WD (1999) Generality of leaf traits relationships: a test across six biomes. Ecology 80:1955-1969 Richardson AD, Hollinger DY, Aber JD, Ollinger SV, Braswell BH. In Press. Environmental variation is responsible for short- but not long-term variation in forest-atmosphere carbon exchange. Global Change Biology Root TL, Price JT, Hall KR, Schneider SH, Rosenzweig C, Pounds JA (2003) Fingerprints of global warming on wild animals and plants. Nature 421:57-60 Schwartz MD, Ahas R, Aasa A (2006) Onset of spring starting earlier across the Northern Hemisphere. Global Change Biology 12(2):343-351 Venterea RT, Groffman PM, Castro MS, Verchot LV, Fernandez IJ, Adams MB (2004) Soil emissions of nitric oxide in two forest watersheds subjected to elevated inputs. For Ecol Manage 196:335-349
NECIA • 21