Powder diffraction studies on proteins: An overview of ... - Infoscience
Recommend Documents
ciently, so production and consumption have to be main- tained in a .... (g H2/L). Tdec. (K). Ref. TiFeH$2. $105.73. $1.86. $101.7. 265. Reilly and Wiswall, 1974.
Apr 30, 2012 - Crystal structure and powder diffraction reference pattern of type I clathrate ... Powder Diffraction is a journal of practical technique, publishing ...
Jan 14, 1997 - measured experimentally (see e.g. Bish and Post, 1989; Jenkins and ..... often these inhomogeneities are in the order of magnitude of the X-ray.
Apr 30, 2012 - sillenite-type structure possess other extraordinary character- istics: they are ...... Table IV lists three possible hydrogen bonds in addition to the water ...... included the chair David K. Matlock (Colorado School of. Mines, Golden
Jul 13, 2017 - Gustafsson & Thomas, 1998) through the addition of an attachment ...... Rodriguez, M. A., Ingersoll, D., Vogel, S. C. & Williams, D. (2004).
Dec 14, 2011 - Synchrotron X-Ray Powder Diffraction Studies of Structural. Phase Transitions in Perovskite Oxides. Brendan J. Kennedy,. A,B. Ilyas Qasim,. A.
Cu3(btc)2 equilibrium system show the localization of CD4, and Rietveld ..... Na1.86Fe3(PO4)3 with a sodium counter-electrode at C/10 and. C/20 rates, and ...
Yoshida,. X-Ray Research Laboratory, Rigaku. Corporation, Japan. ... Lisa Knighta, Irene Margiolakia, Andy Fitcha, Jon. Wrighta, Mathias Norrmanb, Gerd ...
Jan 27, 2014 - Tamilnadu Water Investment Company Limited. www.twic.co.in ..... continuously to a dedicated website / CETP Server. ..... advice. In some cases instead of applying standards based on 'Best Available. Technologyâ, the ...
Jan 27, 2014 - Tamilnadu Pollution Control Board. OCD. Optionally Convertible Debentures. MEE. Multiple Effect Evaporator. MEE. Multiple Effect Evaporator.
both odd and even chain NAAEs exhibits single sharp transitions ..... Thompson E L, Masuda K, Cravatt B F, Burstein S,. Vasko M R ... Chem. B 117 9900. 24.
JOURNAL DE PHYSIQUE. Colloque Cl, suppl6ment au no 3, Tome 48, mars 1987. HIGH-RESOLUTION NEUTRON POWDER DIFFRACTION STUDY OF ICE Ic.
Universiti Sains Malaysia, 14300 Nibong Tebal, Pulau Pinang, Malaysia. *Corresponding author: ... tanpa tetulang (0 peratus berat). Kesesuaian antara matriks.
Links between the bent diphosphate anions and the Cr3+ cations result in a ... angles O1âP1ÐÐÐP2âO4, O2âP1ÐÐÐP2âO6 and O3â. P1ÐÐÐP2âO5 is 9.1 ...
City / State / ZIP-Code. Date. Signature. Country. Telephone / Email. Methods of Payment. Check/Money Order enclosed. AmEx. MasterCard. VISA. Card No.
A special procedure generates in a list of reflections hkl. ... relative intensities, e.g. to compare with PDF lists .... powder patterns show differences both in reflex.
Dec 1, 1993 - and, particularly, for amorphous iron are highly desir- able. Recently .... 1.6ttB at 20 kOe and a corrected value of 1.7,uB for the true saturation ...
Hence, poorly ordered and pedogenicaUy modified vermiculite or vermiculite/ montmorillonite interstratifications became "weathered" by H + attack and AP ...
556 plant-sorbed and NH4OAc extractable Cd and Zn concentrations were ...... 888 effective for a limited depth to the extent the roots can reach, and the heavy ..... 1193. Cd-tainted rice from China: Results from a cross-site field experiment.
Aug 13, 2003 - Journal ofBiogeography is published by Blackwell Science, Inc.. ... JSTOR and the JSTOR logo are trademarks of JSTOR, and are Registered ...
EDITORIAL. Computer Software, Powder Diffraction, and Science. Diffraction seems to be ahead of the curve so often. ... of this Journal, this is routine practice.
success ratio, based on tests with reference crystal structures. The speed and success of the solution process depends on the overall complexity of the structure, ...
A Laboratory Manual for X-Ray Powder Diffraction ...... diffraction techniques, to detect amorphous materials or minerals present in trace amounts, to identify.
Powder diffraction studies on proteins: An overview of ... - Infoscience
Keywords: powder diffraction, synchrotron radiation, protein crystallography ...
powder diffraction methods to study proteins [1-5], and several more are in ...
Powder diffraction studies on proteins: An overview of data collection approaches I. Margiolaki1,*, J. P. Wright1, A. N. Fitch1, G. C. Fox1, A. Labrador1, R. B. Von Dreele2, K. Miura3, F. Gozzo4, M. Schiltz5, C. Besnard5, F. Camus5, P. Pattison1,5, D. Beckers6, T. Degen6 1
European Synchrotron Radiation Facility (ESRF), Grenoble, France Advanced Photon Source, Argonne, USA 3 Japan Synchrotron Radiation Research Institute (JASRI/SPring-8), Hyogo, Japan 4 Swiss Light Source, Paul Scherrer Institute, Villigen PSI, Switzerland 5 Ecole Polytechnique Fédérale de Lausanne (EPFL), Lausanne, Switzerland 6 PANalytical, Almelo, The Netherlands * Contact author; e-mail: [email protected] 2
Keywords: powder diffraction, synchrotron radiation, protein crystallography Abstract. Following the seminal work of Von Dreele, high quality powder X-ray diffraction studies on proteins are being established as a valuable complementary technique to singlecrystal measurements. Several studies using a variety of experiments approaches have been reported in the literature, including high-resolution studies employing parallel beam geometry and high intensity measurements using position sensitive detectors. The choice of the optimum instrumental configuration depends on a number of competing factors such as the amount of sample available, its radiation sensitivity, and the quality of the data required for data analysis, e.g. angular resolution, the extent of the data in d-spacing, or the number of patterns required to explore the protein’s behaviour at different temperatures, or under different crystallisation conditions, etc. Here we discuss several advantages and disadvantages of different data collection methods followed for selected examples of small proteins.
Introduction The investigation of protein crystal structures by high-resolution powder X-ray diffraction using synchrotron radiation is being established as a valuable complementary tool to traditional single-crystal techniques. There have already been several pioneering studies using powder diffraction methods to study proteins [1-5], and several more are in progress. The number of groups working in this area is growing and different instrumental configurations find applicability, including the instruments traditionally used for single crystal studies [3].
2
European Powder Diffraction Conference, EPDIC 10
While most of the early studies were limited to dedicated powder diffraction instruments it is becoming increasingly clear that a wider range of instrumental configurations can give more useful information. A typical single crystal synchrotron beam line should also give a good quality powder pattern from a very small sample, if the X-ray beam is focused at the detector surface. Once a sample is found to be microcrystalline it is worthwhile to pursue an improved powder pattern. So far the majority of the successful powder examples have been well known proteins, used as test cases, but the time has come to attempt to expand the application of powder diffraction into new territories. One of the main barriers appears to be obtaining a useful powder pattern from a protein sample, as the unit cell volumes can be three orders of magnitude larger than those traditionally studied by powder methods. In this overview we describe a variety of instruments which are used at several major facilities and show useful information that can be obtained on a powdered protein sample in each case.
Synergistic use of parallel beam geometry and area detector instruments One particularly important question that we want to address is the comparison of data collection schemes with high resolution analyser crystals on the one hand and multichannel position sensitive detectors (1 and 2-dimension) on the other. Whereas the former configuration offers maximum angular resolution, the latter provides substantially higher data collection rates, therefore, faster acquisition allowing for studies of particularly radiation sensitive systems. Data collection strategies and data quality from different instruments of four main synchrotron sources (ESRF, APS, SPring8 and SLS) as well as laboratory instrumentation (PANalytical) are discussed in the following sections. High angular resolution beam lines: Parallel beam geometry The high resolution powder diffraction beam line at ESRF based on an undulator source, ID31, has been extensively used in the last few years for structural studies of small proteins. This parallel beam geometry instrument is equipped with nine Si(111) analyser crystals. ID31 provides data with very high angular resolution, with a minimum instrumental contribution to the FWHM of around 0.003° 2θ [6]. On the time scale of a few minutes, data suitable for extracting structural information and microstructural details can be obtained. Our experience is that this beam line is most effective for protein crystallography when operated with a wavelength above 1 Å. This strategy allows the very-low-angle (large-d-spacing) reflections to be measured accurately by moving them to higher diffraction angles, away from the beam stop, and to where the effect of low-angle asymmetry due to axial divergence is smaller. A bank of nine avalanche photodiode (APD) detectors (Si based) is commonly used at this energy range. Because of the rapid data collection, high-speed spinning (3000rpm) of the samples is necessary in order to ensure adequate powder averaging. In order to deal with the particularly high sensitivity of proteins to radiation, ID31 is equipped with a fast capillary spinner that allows for sample translation along the axis of the diffractometer. Furthermore, high resolution instruments similar to ID31 are installed respectively at the X16C beam line at the National Synchrotron Light Source (NSLS) - Brookhaven National Laboratory, the Swiss-Norwegian beam line- BM01B (ESRF) and the materials science beam line at Swiss Light Source (SLS). X16C is installed on a bending magnet and equipped with a Ge(111) analyser crystal and was employed for the pioneering powder dif-
Z. Kristallogr. Suppl. 26 (2007)
3
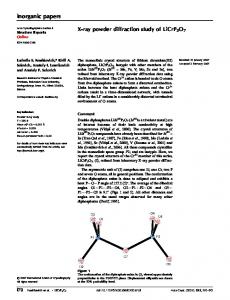
fraction studies of sperm whale myoglobin [1a] and human insulin [1b]. BM01B is also set up on a bending magnet and is equipped with six Si(111) analyser crystals. The materials science beamline at SLS is based on a “minigap-wiggler” and has a three-coaxial axes diffractometer equipped with two detection systems that can be simultaneously operated: a high-resolution multicrystal analyser detector and a solid-state silicon microstrip detector [7]. The use of a bending magnet (BM01B/X16C) instead of an undulator (ID31) or a wiggler device (SLS) results in significantly reduced photon flux. Under comparable conditions, samples of protein PPE could be exposed at room temperature for several hours on BM01B before significant radiation damage occurred, whereas on ID31 their lifetime was limited to a few minutes. According to recent studies on macromolecular single crystals, radiation damage is distinctively correlated with the absorbed dose which can be expressed as a function of a number of parameters: the absorption coefficients of the atoms of the crystal, the number of molecules per asymmetric unit, the beam energy, flux, size and profile, the crystal size, and the total irradiation time [8]. Therefore, the lower photon flux can be advantageous. Moreover, in the case of PPE anisotropic lattice changes induced by radiation could be employed for distinguishing between neighbouring diffraction peaks which accidentally overlap resulting in better extracted intensities and detection of heavy atoms in protein derivatives [9]. Until now, proteins that have been successfully characterised using data collected at ID31 include, insulin, lysozyme from different sources, myoglobin, apoferritin, trypsin, elastase, thaumatin, thermolysin, glucose isomerase as well as small domains of muscle proteins (eg. SH3 domain of ponsin). The samples are usually slurries of polycrystalline proteins in saturated solvent packed in glass capillaries. The capillaries are centrifuged in order to achieve better packing of precipitate. Excess mother liquor is removed and the capillaries are sealed with wax to prevent protein dehydration. This approach for data collection requires at least 510 μl of protein precipitant for each experiment. Figure 1 (upper) illustrates a Pawley fit [10], using the TOPAS software suite [11], to the ID31 data collected for a good quality sample of tetragonal hen egg white lysozyme (HEWL). In this case, the sample was loaded into a 1.5 mm glass capillary and centrifuged prior to data collection. Data were obtained at a wavelength of 1.250845(23) Å and room temperature. In order to improve the counting statistics without compromising data quality, the capillary was translated to give a fresh region of sample as soon as radiation damage effects were evident in the peak positions and widths. Another interesting case corresponds to cubic insulin from bovine pancreas. Due to the high crystal symmetry the exact peak overlap of the powder diffraction data is quite severe and there are two molecules to be found in the asymmetric unit. Figure 1 (lower) shows a Pawley fit to the data collected at room temperature ( = 1.250845(23) Å). The fitted peak width for these data is about 0.01º in 2θ, including the low angle asymmetry due to axial divergence. In most of the cases of proteins studied up to now, indexing, intensity extraction via the Pawley approach, molecular replacement for determining the position and orientation of the molecule in the unit cell and structure refinements are performed using a single or multiple diffraction profiles depending on the data resolution (d-spacing) as well as the information
4
European Powder Diffraction Conference, EPDIC 10 6,200
Figure 1: Pawley refinements of ID31 data ( = 1.25 Å, RT) of: (Upper) Tetragonal HEWL (sp. Group: P43212, a= 79.2688(3)Å, c= 37.9573(2)Å). In total, 2956 intensities were extracted up to 3Å resolution and (Lower) Cubic insulin from bovine pancreas (sp. group: I213, a= 79.0015(3)Å). In total, 1957 intensities were extracted up to 3Å resolution. Insets: Magnifications of the high angle regions of the data.
24.5
Z. Kristallogr. Suppl. 26 (2007)
5
content of the powder profiles rulled by the crystal symmetry, sample crystallinity, the average size of the molecule and the lattice dimensions [2b]. The microstrip detector (MYTHEN) at SLS The MYTHEN detector has been designed at the Paul Scherrer Institute detector group [7]. MYTHEN is a modular 1D detector, whose modules covers each approximately 5° in 2 and collects, in its present version, 60° full diffraction patterns in times ranging between 1 and 10 seconds with the assembling of 12 modules. The MYTHEN intrinsic FWHM-resolution is 0.004° and depends on the sample-to-detector distance (760 mm) and the silicon microstrip pitch (50 μm). However, as in the case of an area detector described in the next section, the FWHM-resolution is influenced by the sample size although an improvement can be achieved at low 2 angles by focusing the beam vertically on the detector instead of on the sample. The new generation microstrip detector, with reduced acquisition times by more than a factor of three, will allow for full diffraction patterns to be simultaneously acquired over 120° in 2 . Preliminary measurements on HEWL have already been performed with particularly interesting results, no evidence of radiation damage was found: the high MYTHEN counting efficiency permitted the data to be acquired with a minimal radiation dose. High intensity beam lines: Area detectors
220
obs calc diff back
200
(a)
Intensity (Arb. Units)
180 160 140 120 100
d=4.15 Angstrom
80 60 40 20 0.5
1
1.5
2
2.5
3
Two Theta (degrees)
(b)
Figure 2: Left: (a) ID11 image of tetragonal HEWL collected with a CCD camera and (b) zoom of the low angle region. Upper: Pawley fit of the ID11 data up to 4.15Å resolution.
Area detectors allow for full powder rings to be recorded and integrated to yield gains of detection efficiency of more than 103, leading to a drastic reduction in exposure times and radiation damage, thus making measurements on much smaller samples possible. The greatest advantage of using area detectors is that the solid angle for intensity integration increases
6
European Powder Diffraction Conference, EPDIC 10
with scattering angle resulting in improved intensity statistics in the high angle region of the powder data. This region suffers from significant decrease of the X-ray scattering amplitude (rate of intensity decrease ∝ sinθ/ ) and requires longer data collection times for compensating the loss of information and achieving improved counting statistics. In collecting data with an area detector the main contributions to the peak widths come from the detector pixel size, the beam size at the detector and the sample dimensions. At any given instrument the detector pixel size is fixed and Figure 3: Low-angle region of powder diffraccannot be optimised for protein powder tion patterns from lysozyme samples. The lower and upper patterns correspond to analyser diffraction. The beam size at the detector crystal (ID31) and area detector (BM01A) data can be minimised by arranging focused respectively. In these experiments, the intensioptics so that the beam is focused at the ties of certain low angle reflections are modudetector surface, as in a Guinier camera. lated by varying the mean electron density of the Finally the contribution of the sample size solvent surrounding the protein molecules in the increases with sample thickness and scatcrystal lattice via variations in the solvent comtering angle (tan(2θ)). In order to minimise position. The red and blue spectra correspond the term due to sample size we have colrespectively to samples soaked in low and high lected data at very high energies, ~50keV electron-dense solvents. (0.25Å wavelength) at the materials science beam line, ID11, at the ESRF. A 0.8 mm2 X-ray beam was vertically focused using a bent Laue crystal to give a beam size of ~5 μm2 at the surface of a Fast-Read-out-Low-Noise (FReLoN) 2Kx2K CCD camera [12], developed at ESRF, with 50μm2 pixel size. A 1 mm diameter sample of tetragonal HEWL was mounted at approximately 1.5 m in front of the detector. Figure 2 shows the CCD image and a zoom of the low angle region where the effects of X-ray beam focusing are particularly pronounced. A Pawley refinement, following integration of the data taking into account the middle 10° and applying a median filter using the fit2d package [13], is also presented in figure 2. The fitted peak width for these data is about 0.0042º in 2θ, equivalent to ~ 0.021° in 2θ at 1.25 Å, which is approximately two times larger with respect to the analyser crystal data. The peak shape function is Lorentzian in character and arises mainly from the point spread function of the detector. Due to the limited size of the area detector, the data only reach a minimum d-spacing of 4.15 Å. In order to improve these data, it will be necessary either to translate the area detector towards the sample at the expense of the FWHM-resolution or to employ a larger area detector. In addition, measurements on a variety of model proteins have been performed at the SwissNorwegian beam line (BM01A). This station was initially designed for measurements on single crystals and features two different diffractometers with large-size area detectors. One is a multi-axis goniometer from Oxford Diffraction Ltd. equipped with a 165 mm diameter CCD detector. The second diffractometer consists of a single-axis goniometer combined with a 345 mm diameter image plate scanner from MAR-Research. The optical configuration of BM01A is a conventional arrangement of vertically collimating mirror, followed by a double crystal Si(111) monochromator and vertically focusing mirror. Sagittal bending of the second
Z. Kristallogr. Suppl. 26 (2007)
7
monochromator crystal provides focusing in the horizontal plane. The angular resolution is typically a factor of 10 or worse in comparison with data collected on high-resolution instruments. However, many individual diffraction lines are still observable in protein powder diffraction patterns, especially in the low-angle region, and the indexing of such patterns is usually successful. Thus, areadetector data collection on protein powder samples is ideally suited for various qualitative and semi-quantitative measurements such as sample screening (i.e. checking for crystallinity), phase identification, time-resolved measurements, monitoring of phase transitions etc. As an example, in figure 3, we present solvent Figure 4: MAR345 image of HEWL cryscontrast variation data recorded on powder tallized from 1.25M NaCl pH 4.0 0.05M samples of lysozyme, using both a highphthalate buffer taken at 20keV as a 30s resolution diffractometer (ESRF-ID31) and an exposure on beamline 1-BM at the Adimage-plate area detector (SNBL-BM01A). vanced Photon Source, Argonne National While the angular resolution from the area Laboratory; background from air, Kapton detector data is significantly worse, many lowand solvent have been subtracted. Innerangle diffraction lines are still identifiable and most ring is tetragonal HEWL (110) at d the effect of contrast variation is clearly visi=55.66Å, and the upper edge of the image corresponds to d~1.85Å. ble in both pairs of powder patterns. It should be noted that the high-resolution powder patterns were recorded by irradiating a sample volume of approximately 3.5 mm3 for 15 minutes on an undulator beamline, whereas the area detector data were obtained by irradiating a sample volume of less than 0.5 mm3 for 6 minutes on a bending-magnet beamline. Similarly, experiments at beam line 1-BM at the Advanced Photon Source (APS) take advantage of the full pattern recording capability of an image plate (MAR345) to collect rapidly protein powder diffraction data. In this case, the X-ray beam had energy of 20 keV ( ~0.62 Å) and was focused to the surface of the detector which was placed ~700 mm from the sample position. [14]. The size of this focus spot (~300 μm) matches well with the MAR345 point spread function (~300 μm); the detector was then displaced vertically by ~60mm to enhance the accessible range of d-spacings to