green electricity. The so-called photovoltaic (PV) cell. (commonly referred to as solar cell) makes use of sun's energy to generate a voltage which can derive the ...
MATEC Web of Conferences 70, 12003 (2016)
DOI: 10.1051/ matecconf/20167012003
ICMIT 2016
Power and Frequency Fluctuations of MPPT Algorithms in Variable Irradiance Environments 1
2
2
Syed Ali A. Kazmi , Debraj Basu , Syed Faraz Hasan and Dong-Ryeol Shin
1
1
College of Information and Communication Engineering, Sungkyunkwan University, South Korea School of Engineering and Advanced Technology, Massey University, New Zealand
2
Abstract. Solar cells use the natural sunlight for a variety of purposes including electrical power generation. In order to maximize the power obtained from a solar cell, it has to operate at what is known as the Maximum Power Point (MPP). Intelligent algorithms that can track MPP for a given cell are crucial for the success of a large scale deployment of solar panels. This paper investigates the performance of two well-known Maximum Power Point Tracking (MPPT) algorithms. A variable irradiance environment has been considered in this work, where sunlight varies significantly during the day. Towards the end, frequency stability analysis is conducted to evaluate the relevant impact of MPPT algorithms on frequency stability of system.
1 Introduction One of the most important uses of solar energy technology has been in generating renewable or so called green electricity. The so-called photovoltaic (PV) cell (commonly referred to as solar cell) makes use of sun’s energy to generate a voltage which can derive the load. Solar cells inherently produce DC power, which can be converted into AC power using appropriate inverters. A solar panel is a combination of a number of solar cells, each of which produces a modest amount of electrical power [1]. Recently, an increasing number of rooftop panels are being considered for connection to the main grid’s distribution network. Since these small-scale solarpowered generators are connected directly onto the distribution network, they are referred to as distributed generation (DG) units or more specifically renewable energy generation (REG) [2]. The DG units are different from the traditional generators in several ways. First, they are connected to the grid at distribution network, which is closer to the load and operates at low voltage level. Second, these generators are connected to the grid through inverters because the main power grid is AC in nature. In the conventional power grids, the balance between the supply and the demand of the power is achieved by controlling rotating inertia (e.g. using torque, etc) [3]. In solar-powered DG units, inertial components do not exist so they cannot use the conventional droop control methods [4]. While there are a number of other open research issues in relation with using solar panels as DG units, we focus on optimizing their power output in this paper.
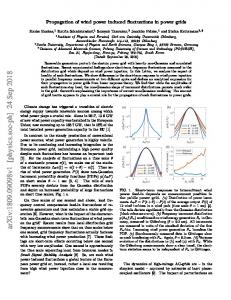
The power output of a solar panel depends on the amount of exposure it receives from the sun. Better the line of sight it maintains with the sun, the better its power output gets. A number of approaches have been proposed and adopted that physically change the orientation of solar panels so they remain aligned with the sun all the times [5]. This ensures higher received electromagnetic radiation from the sun, which is often expressed as irradiance [6]. Even while the panel is well-aligned with the sun, it cannot extract maximum output until it is operated at Maximum Power Point (MPP). MPP is an electrical operating point which enables all modules of a solar panel to produce the maximum output power. Since it is not a physical point in space, no inertial movement is required to reach MPP [7]. In order to understand the notion of MPP, let’s consider the diagram shown in Figure 1. As shown in the figure, a solar panel (SP) is connected to a battery via a DC-DC controller. The battery ensures smooth and regulated delivery of power to the AC and DC loads.
Figure 1. A general block diagram illustrating the use of solar panels for supporting AC and DC loads.
© The Authors, published by EDP Sciences. This is an open access article distributed under the terms of the Creative Commons Attribution License 4.0 (http://creativecommons.org/licenses/by/4.0/).
MATEC Web of Conferences 70, 12003 (2016)
DOI: 10.1051/ matecconf/20167012003
ICMIT 2016
Figure 3. A 200-sec interval has been selected as irradiance pattern from [8].
Figure 2. Typical PV curves for different values of irradiance.
The controller maintains the operating conditions so that the extracted power can be maximized in a 305W PV panel capable of supplying 3050Wh load. This PV system is further supported with 2×100 AH Li-ion battery of 12V each in series resulting in 24V. The depth of discharge is 70%. At inverter, PV system is capable of supplying 220V AC at 60Hz besides DC. This system can-be used in both off-grid and on-grid applications. The Power-Voltage graphs for different values of irradiance are shown in Figure 2. The variable irradiance pattern is taken from [8] and is shown in Figure 3. Note that in order to extract maximum power from the solar cells, voltage level is maximize and thus the optimum voltage is called MPP voltage. A number of maximum power point tracking (MPPT) algorithms have been proposed to ensure that a solar panel operates at its MPP. The main objective of this research work is to examine the performance of two common MPPT algorithms in environments where the solar energy does not remain constant. This study is motivated by the fact that all countries across the world do not get a consistent source of power from the sun.
However under highly variable and shady irradiation conditions, P&O do-not perform well due to causing oscillation between two voltage levels close to MPP. Several notable works on MPPT algorithms have been done over the past some time. For example, Sera et al [12] have introduced the dP-P&O technique, which drives actual change in the power due to the perturbation. Likewise, Jiang et al [13] have proposed an MPPT method with an adaptive step-size and adaptiveperturbation-frequency algorithm. Their method continuously modulates the perturbation step size and the interval between any two perturbations while observing the load current. A faster convergence speed has been observed as a consequence. As a new paradigm to track the maximum power points in multiple maxima conditions that arises due to variable irradiation, artificially intelligent techniques for MPPT have been proposed in literature [14]. Artificial neural network (ANN) has ability to recognize and estimate unknown parameters. Thus ANN is an ideal tool to use in MPP tracking especially in variable radiation conditions [15]. Lian et al [16] have proposed hybrid method based on particle swarm optimization (PSO) and P&O algorithms. An improved PSO method to reduce steady state oscillation in proposed in [17]. A novel PSO algorithm based on voltage window limits has been proposed in [18].
2 Legacy MPPT algorithms The Perturb and Observe (P&O) algorithm is an MPPT method that searches for MPP by changing the battery voltage [9]. As shown in Figure 1, once connected, the load shall assume the same voltage level as that asserted by the battery. The current drawn by the load, or conversely power extracted from the solar panel, shall therefore depend on the battery voltage. P&O algorithm keeps increasing the battery voltage until the power starts to decrease (see Figure 2). Once a decrease in output power is noticed, the P&O algorithm reduces the battery voltage so as to reach MPP. The other commonly used MPPT algorithm is the incremental Conductance (IC) algorithm [10]. The IC of a solar panel is defined by the ratio dI/dV. The IC makes changes in dI/dV and observes another ratio dP/dV. The ratio dP/dV represents the slope. The IC continues to increase dI/dV as long as a positive change in dP/dV is observed. It decreases dI/dV when the slope dP/dV becomes negative. Thus, the IC method determines the MPP using successive iterations. A comparative study on various MPPT techniques is done by Subudhi and Pradhan [11]. Among various techniques, P&O and IC methods are widely used in commercial sectors.
3 Analyses and discussion This section first describes the PV models used in the simulations and then explains the performance of P&O and IC algorithms. 3.1. PV models MATLAB based PV models for P&O and IC have been used in study and are given in [19, 20] for different system capacities. The irradiation pattern in Figure 3 is used to determine the fluctuations in power output of the two MPPT algorithms. 3.2 Output power Figure 4 shows the power output from the solar panel of 100KW and 200KW capacity when IC and P&O algorithms are used.
2
MATEC Web of Conferences 70, 12003 (2016)
DOI: 10.1051/ matecconf/20167012003
ICMIT 2016
Figure 5. Frequency response of IC method when load is increased.
Figure 4. Fluctuations in power output for IC and P&O algorithms.
It is obvious that the fluctuations in the power output relate directly with the variations in the irradiation pattern (see Figure 3). Note that the magnitude of 100KW power output from IC and P&O algorithms is not quite different. It is interesting to note from Figure 4 that the response time of IC is slightly quicker than P&O. Table 1 shows the standard deviation (Std) and variance (Var) of the power output fluctuations shown in Figure 4. The performance of P&O and IC in 200KW system is also tabulated in Table 1. Regardless of the system capacity, P&O exhibits a much larger Std and Var in the output power. More specifically, the Std in P&O is twice that in IC for both 100KW and 200KW systems. The difference between P&O and IC in-terms of Var is much larger. Table I suggests that the variance in power output in P&O is four times more than the same in IC under 100KW and 200KW systems respectively. Also the power difference for 200KW system is more in P&O than IC. This assessment makes IC more sensible choice interms of power regulation.
Figure 6. Frequency response of P&O method when load is increased.
Both figures also show a magnified image of the time instants during which the load change is applied. It can be seen from the figures that both IC and P&O methods respond to increase in load in similar fashion. However note that unlike the IC method, P&O increases the grid frequency beyond the tolerable range (±0.5Hz) at the time the load is increased (t=5.5sec). On the other hand, the fluctuation in frequency dies out slightly sooner in P&O in comparison with the IC method. Figures 7 and 8 show the changes in frequency when the main supply is suspended at t=5.5sec for IC and P&O methods respectively. The frequency spike in both methods is well beyond the tolerable range at the time a deliberate fault is introduced. Again, P&O algorithm exhibits a higher rise in the frequency. It is interesting to note that unlike figures 5 and 6, the frequency fluctuations in the IC method die out sooner than P&O method.
3.3 Frequency response The frequency response of a distribution network has been analysed here at a node which houses a DG (REG) unit of 200KW. The DG unit connected here is PV generator that feeds power into the distribution network. This section examines the changes in system frequency (i) when load increases, and (ii) when the main supply is suspended momentarily. The changes in the load and the main supply are made at t=5.5sec. The frequency response of the network under these conditions is observed based on IC and P&O algorithms. Figures 5 and 6 show the changes in frequency when the load is increased by 10%, 20% and 30% using IC and P&O methods respectively.
4 Conclusions The paper examines two common MPPT algorithms in-terms of output power and operating frequency. Power and frequency are important parameters within a power system that can significantly affect its performance. It has been observed in the paper that the IC and P&O methods respond the same way to the fluctuations in the irradiance pattern. It has been shown that IC method can result in slightly increased power output. We have also shown that the IC method performs better than the P&O method in keeping the grid frequency under the tolerable threshold.
Table 1. Std and Var values of PV systems (100KW / 200KW). Algorithm
Capacity
Std
Var
100KW
8.234
67.807
200KW
10.068
101.366
100KW
16.469
271.225
200KW
20.136
405.464
IC
P&O
3
MATEC Web of Conferences 70, 12003 (2016)
DOI: 10.1051/ matecconf/20167012003
ICMIT 2016
8.
9.
10.
Figure 7. Frequency response of IC method under loss of mains condition.
11.
12.
13. Figure 8. Frequency response of P&O method under loss of mains condition.
14.
Acknowledgement Funded through Massey University Research Fund 2016.
15.
References 1.
S. A. Rahman, R. K. Varma and T. Vanderheide, “Generalised model of a photovoltaic panel”, IET Renewable Power Generation, 8(3), (2014) 2. S. A. Kazmi, S. T. Shah, D. R. Shin and S. F. Hasan, “Circuit Analysis Approach for determining Voltage Stability Index”, IEEE PEDS, (2015) 3. T. L. Vandoorn, J. D. M. De Kooning, B. Meersman, J. M. Guerrero and L. Vandevelde, “Automatic Power-Sharing Modification of P/V Droop Controllers in Low-Voltage Resistive Microgrids”, IEEE Transactions on Power Delivery, 27(4), (2012) 4. H. Han, Y. Liu, Y. Sun, M. Su and J. M. Guerrero, “An Improved Droop Control Strategy for Reactive Power Sharing in Islanded Microgrid”, IEEE Transactions on Power Electronics, 30(6), (2015) 5. G. M. Dousoky, A. -H. M. El-Sayed and M. Shoyama, “Increasing energy efficiency in solar radiation trackers for photovoltaic arrays”, IEEE Energy Conversion Congress and Exposition, (2012) 6. Y. S. Khoo, A. Nobre, R. Malhotra, Y. Dazhi, R. Ruther, T. Reindl and A. G. Aberle, “Optimal Orientation and Tilt Angle for Maximizing in- Plane Solar Irradiation for PV Applications in Singapore”, IEEE Journal of Photovoltaics, 4(2), (2014) 7. C. Konstantopoulos and E. Koutroulis, “Global Maximum Power Point Tracking of Flexible
16.
17.
18.
19.
20.
4
Photovoltaic Modules”, IEEE Transactions on Power Electronics, 29(6), (2014) M.Datta, T.Senjyu, A.Yona, T.Funabashi and C.H Kim,”A Frequency-Control Approach by Photovoltaic Generator in a PV-Diesel Hybrid Power System”, IEEE Trans on Energy Conversion, (2011) B. Bendib, H. Belmili and F. Krim, “A survey of the most used MPPT methods: Conventional and advanced algorithms applied for photovoltaics systems”, Elsevier, Renewable and Sustainable Energy Reviews 45(1), (2015) T. Esram, and P. L. Chapman, “Comparison of Photovoltaic Array Maximum Power Point Tracking Techniques”, IEEE Transactions on Energy Conversion, 22( 2), (2007). B. Subudhi and R. Pradhaan, “A Comparative study on Maximum Power Point Tracking Techniques for Photovoltaic Power Systems”, IEEE Transactions on Sustainable Energy, 4(1), (2013) D. Sera, T. Kerekes, R. Teodorescu and F. Blaabjerg, “Improved MPPT Algorithms for Rapidly Changing Environmental Conditions”, 12th International on Power Electronics and Motion Control Conférence, (2006) Y. Jiang and J. A. A. Qahouq, “Adaptive Step Size with Adaptive-Perturbation Frequency Digital MPPT Controller for a Single-Sensor Photovoltaic Solar System”, IEEE Transactions on Power Electronics, 28(7), (2013) L. M. Elobaid, A. K. Abdelsalam and E. E. Zakzouk, “Artificial neural network-based photovoltaic maximum power point tracking techniques: a survey”, IET Renewable Power Generation, (2015). K. Ishaque and Z. Salam, “A review of maximum power point tracking techniques of PV system for uniform insolation and partial shading condition”, Renewable and Sustainable Energy, Elsevier, 19(1), (2013) K. L. Lian, J. H. Jhang and I. S. Tian, “A Maximum Power Point Tracking Method Based on Perturb-andObserve Combined With Particle Swarm Optimization”, IEEE Journal Of Photovoltaics, 4(2), (2014) K. Ishaque, Z. Salam, M. Amjad and S. Mekhilef, “An Improved Particle Swarm Optimization (PSO)– Based MPPT for PV With Reduced Steady-State Oscillation”, IEEE Transactions On Power Electronics, 27(8), (2012) Z. Qing, Z. Xing, L. Chun, L. S. Shou and C. Xiaojing, “An Improved Particle Swarm Optimization MPPT algorithm Based on Voltage Window Restrictions”, 17th International Conference on Electrical Machines and Systems (ICEMS), (2014) Simulink-based PV model in MATLAB. Available online:http://au.mathworks.com/help/physmod/sps/e xamples/average-model-of-a-100-kw-gridconnected-pv-array.html. P. Giroux, “Grid-Connected PV Array'', MATLAB Central”, avalable online: http://kr.mathworks.com/matlabcentral/fileexchange/ 34752-grid-connected-pv-array.