© IEEE (2013). This is an authors’ copy of the work. It is posted here by permission of IEEE for your personal use. Not for redistribution. The definitive version will be published in the 7th IEEE, IET International Symposium on Communication Systems, Networks and Digital Processing (CSNDSP 2010), Newcastle, UK, July 2010.
Power Consumption of Wired Access Network Technologies Slaviša Aleksić, Member of IEEE, and Ana Lovrić Vienna University of Technology, Institute of Broadband Communications, Vienna, Austria
[email protected],
[email protected]
Abstract—Wired broadband access can be realized using various technologies, configurations and protocols. It is widely deployed and able to provide both high data rates and high reliability. These features are of strong importance for many advanced applications. Since the number of broadband subscribers worldwide grows exponentially, the power efficiency of access networks becomes an important issue. The main goal of this paper is to study the power consumption of different wired broadband access technologies including both those already widely used and those which are state-of-the art, but not yet widely deployed. Thus, results on power efficiency of different access networks such as hybrid fiber coax (HFC), digital subscriber line (DSL), 1 Gbit/s and 10 Gbit/s point-to-point Ethernet and passive optical networks (1G-PON and 10GPON) are shown.
I. INTRODUCTION Nowadays, the majority of broadband access subscribers have either a wired access over telephone lines, in most cases a version of digital subscriber line (DSL), or a wireless access such as WiMAX ,WiFi, GSM or UMTS. Another widely deployed access technology is the hybrid fiber coax (HFC) solution that uses fiber running from the central office of a network provider to a remote node (RN) and coaxial cable from the node to subscribers. An adequate converter in the RN adapts the signal from one to the other transmission medium. HFC systems reuse the widely deployed Cable TV (CATV) network infrastructure. Recently, there have been a large number of projects concentrating on fiber-based optical access networks for broadband transmission of data generally named fiber-tothe-x (FTTx). There are different options for FTTx depending on how near to the subscriber the fiber reaches. A typical example is the fiber-to-the-home (FTTH), which means that optical signal reaches the end user’s equipment situated in the subscriber home. Other examples are FTTB (fiber-to-the-building), FTTC (fiber-to-the-curb), FTTN (fiber-to-the-node). When looking at the topology of the access network, it can be either ring or tree or a combination of those two topologies. Additionally, interconnections can be based on unidirectional or bidirectional fibers in a point-to-point (P-t-P) or point-tomultipoint (P-t-MP) arrangement. The number of broadband subscribers worldwide has grown exponentially during the last decade. Since recently, also the number of FTTH connections has been remarkably growing. For example, in the United States, the annual growth rate was 112% between 2006 and 2007
[1]. In Japan, the number of FTTH connections exceeded that of ADSL in January 2007 [2]. More subscribers and higher data rates per subscriber mean higher total power consumption of the entire access network infrastructure. Different Internet access options provide different bandwidth per user and consume more or less power. Although there has been a lot of research effort put in the investigation of technological aspects of access networks, there are only a few works concentrating on power consumption issues [3,4]. This paper aims to evaluate power consumption of different wired access technologies and to compare them by means of power efficiency. The paper is organized as follows: Section II describes the considered technologies and the model used to evaluate their power consumption. The obtained results are shown and discussed in Section III. Finally, Section IV summarizes and concludes the paper. II. DESCRIPTION OF THE MODEL A.
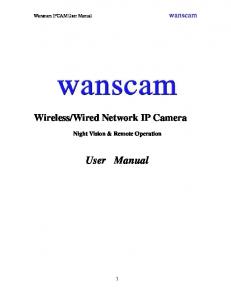
Considered Access Technologies The access network technologies that we took into consideration in our study are depicted in Figure 1. First we considered the conventional and very widely deployed copper-based access technologies such as xDSL and HFC. Here, we chose two options for xDSL access that are currently being deployed, namely ADSL+ and VDSL2, because they are the most recent DSL specifications that are able to provide high data rates and to support current triple play services. Hybrid fiber coax (HFC) is considered because it is widely used and also supports high data rates and triple-play services within its latest version DOCSIS 3.0. For both xDSL and HFC we assume the fiber-to-thenode (FTTN) scenario, in which the DSL access multiplexer (DSLAM) is situated in a remote node that is connected via an optical fiber to the central office (CO) equipment, while DSL is then applicable on copper wires reaching from the remote node’s DSLAM to the customer premises equipment (CPE). For optical access we considered two different topologies, namely point-to-point (P-t-P) and point to multipoint (P-t-MP). P-t-P systems are implemented using direct connections between CPEs and COs through 1 Gbit/s or 10 Gbit/s Ethernet links. In the case of P-t-MP systems, we considered Gigabit passive optical network (GPON), Ethernet PON (1G-EPON) and 10 Gbit/s Ethernet PON (10G-EPON). The considered optical access technologies are referred to as fiber-to-the-home (FTTH) networks.
Copper-based access xDSL: ADSL2+, VDSL2 HFC Fiber-based access P-t-MP topology GPON, EPON, 10GEPON
TN FT
Active remote node (RN)
FTTH Passive splitter Central Office Central Equipment Office Central Equipment Office Central Equipment Office Equipment
FTTH
Fiber-based access P-t-P topology 1 Gbit/s and 10 Gbit/s, Ethernet
Copper Optical fiber
Figure 1. Considered Access Network Technologies
B.
Access Network Model Different access solutions provide different data rates per user and allow unequal distances between the CO and end users. Additionally, typical configurations vary from case to case. Therefore, it is not easy to fairly compare different access technologies with each other. In our study, we decided to look at the maximum achievable data rates for each technology and to neglect differences in maximum reach, i.e., not to take into account the effect of reducing the data rate with increasing the transmission distance. Since both xDSL and HFC are assumed to be implemented in the FTTN configuration, we assume that copper cables are not longer than few hundreds of meters. The main parameters that we considered in our model for each access technology are listed in Table 1. Network elements of optical access options are modeled at the chip level. That means that we fist specified a generic structure for both network-side and user-side elements and then calculated their total power consumption by summing up values for consumption of individual functional blocks, i.e., integrated circuits (ICs). For instance, the generic structures of 1G and 10G EPON elements are shown in Figure 2 and those of 1G and 10G P-t-P Ethernet are depicted in Figure 3.
a)
TABLE I. MAIN PARAMETERS OF THE CONSIDERED ACCESS SOLUTIONS Number of channels FTTN
HFC DOCSIS 3.0
US [Mbit/s]
Max. reach [km]
DS
US
DS [Mbit/s]
4
4
152
108
N/A
ADSL2+
N/A
24*
1.4*
5.5
VDSL2 asymmetric
N/A
100*
50*
2
VDSL2 symmetric
N/A
100*
100*
2
FTTH
Splitting ratio
1G-EPON
Maximum data rates
Max. reach [km]
DS [Mbit/s]
US [Mbit/s]
1:32
1000
1000
20
GPON
1:32
2300
1000
20
10G-EPON symmetric
1:32
10000
10000
20
10G-EPON 1:32 10000 1000 asymmetric * For short distances of up to few hundreds of meters.
1G-EPON / 10G-EPON
µP
Maximum data rates
TDM OLT Tx
to Metro/ Aggregation Switch
OLT MAC
PHY SER/ DES PCS
Laser Driver
DFB /EAM
to ONUs Rx
Burst Mode CDR LA
APD
TIA
b) 1G-EPON / 10G-EPON
µP PHY …
to subscriber
PHY
Ethernet Switch
ONU MAC
PHY SERDES PCS
Burst Mode Contr Driver
TDM ONU Tx DFB-LD to OLT Rx Rx
CDR
LA
TIA
APD
Figure 2. Generic structures of 1G-EPON and 10G-EPON: a) optical line terminal (OLT) and b) optical network unit (ONU)
20
a)
P-t-P Aggregation Switch Card
µP
Tx
to Metro/ Aggregation Switch
PHY SER/DES PCS
MAC
Laser Driver
DFB /EAM Rx
CDR
LA
b)
TIA
to subscriber
APD
P-t-P Ethernet CPE µP
PHY …
to subscriber
Tx
Ethernet Switch
MAC
PHY SER/DES PCS
PHY
Laser Driver
DFB /EAM Rx
CDR
LA
TIA
to network
APD
Figure 3. Generic structures of P-t-P 1G and 10G Ethernet a) aggregation switch and b) customer premises equipment (CPE)
TABLE II. OBTAINED VALUES OF POWER CONSUMPTION FOR DIFFERENT ACCESS NETWORK ELEMENTS
Network element
Max. number of ports/users
Max. data rate per port/line
Power consumption [W]
DS
US
DS [Gbit/s]
US [Gbit/s]
HFC CMTS
72
1
10
10
1350
HFC DOCSIS 3.0 Modem
1
1
0.152
0.108
9
ADSL2+ DSLAM
48
1
1
1
83
ADSL2+ modem
1
1
0.024
0.0014
8
VDSL2 DSLAM
16
1
2
2
64
VDSL modem
1
1
0.1
0.1
7
Ethernet aggregation switch (P-t-P)
24
2
20
20
114
Ethernet CPE (P-t-P)
1
1
1
1
7
Ethernet aggregation switch (P-t-P)
12
1
10
120
121
Ethernet CPE (P-t-P)
1
1
10
10
28
1G-EPON OLT
32
1
10
10
45
1G-EPON ONU
1
1
1
1
13
32
1
10
10
47
1
1
2.3
1
17
10-EPON OLT
32
1
10
10
111
10G EPON ONU
1
1
10
10
29
GPON B+ OLT GPON B+ ONU
The power consumption of a functional block is obtained by averaging the consumption values of a number of components currently available on the market.
In order to validate our model of network elements, the obtained values for their total power consumption are compared to those given in technical specifications of some commercially available systems. In the case of the widely deployed HFC and xDSL systems, we created a data base of network elements, i.e., cable modem termination systems (CMTSs), DSLAMs, and DSL/HFC modems, and calculated mean values that are used for the calculation of power efficiency.
N user SR , (1) Ruser = RDS , max + RUS , max N user where RDS,max and RUS,max are the maximum downstream and upstream data rates, respectively, Nuser is the total number of active users connected to a CO, and SR denotes the splitting ratio. For P-t-P networks we assume that all users can achieve the maximum data rate unless there is another limiting factor. The data rate per user in P-t-P options is only limited by the maximum capacity of the aggregation switch to which they are connected and by the maximum uplink capacity of the corresponding CO. III. RESULTS We calculated the power efficiency for the access technologies described above by considering two scenarios. The first one does not include any limitation of the uplink in central offices of network providers. It gives the theoretically highest possible efficiency that can be achieved by each technology. The second scenario is a more realistic one because it foresees that there are not unlimited resources available in the central office, i.e., in the metropolitan area network. For this case we assume a 10-hop, 80-channel WDM metro ring providing 40 Gbit/s per wavelength channel and 1000 users per CO. The total capacity of the ring is then 40 Gbit/s × 80 wavelengths = 3.2 Tbit/s. Thus, if the available capacity is equally divided among all nodes, than each CO would have a maximum uplink capacity of 320 Gbit/s. To compare different technologies by means of power efficiency we decided to look at the average power consumed by each user for transmitting a data volume of one Gbit/s. Thus, the total power consumed within the CO and at the user side is divided by the number of users and the data rate per user. We assume realistic parameters for the concentration equipment located in the CO as shown in Table 2. The access network is populated step by step. That means that if there is only one user connected to the
CO, then only one concentration element is used. As soon as the number of users per CO exceeds of number of lines that one concentration element can provide, a new concentration element is added. Figure 4 shows the results of power efficiency for the considered access technologies when the number of users connected to a CO increases form 1 to 1000. The results presented in Figure 4 are obtained without considering any bandwidth limitation in the CO. The fiber-to-the-node options are generally less power efficient (see Figure 4a). Because they provide a relatively low data rate per user and a large number of users per concentration element, they tend to be very power inefficient for a small number of users. When the number of users increases and the capacity of the concentration element (CMTS or DSLAM) is effectively utilized, they become more efficient, but still for an order of magnitude less efficient than the optical access options. In our study, the most efficient copper-based technology was VDSL2 with 56 W/Gbit/s per user for the case of 1000 users per CO. The FTTH technologies show generally better efficiency than the FTTN ones (Figure 4b). Please note that for FTTH technologies we considered symmetric options only, i.e., US and DS data rates are equal. If only few customers are connected to a CO, then the P-t-P 1G Ethernet shows the lowest efficiency among all the considered optical access network options. This is because the aggregation switch consumes more power than a PON port and the advantage of a dedicated connection to each user does not play a
b) 1,000 800
ADSL2+ VDSL2 (symmetric)
600 400
HFC 200 0 1
10
100
1,000
Power per User per Gbit/s [W/Gbit/s]
Power per User per Gbit/s [W/Gbit/s]
a)
significant role because PON users also achieve a relatively large data rate for a low number of users. The equipment providing 10 Gbit/s also consumes large power, but it provides 10-times larger data rate than the 1 Gbit/s one. When the number of active users increases above few tens, then P-t-P 1G option becomes more efficient than 1G-EPON and GPON. In this theoretical scenario without any bandwidth limitation, 10 Gibt/s systems would provide the highest power efficiency. Thus, if we would have a huge capacity within the metropolitan area such that very high speed access at 10 Gbit/s could be provided to 1000 customers at the same time, then the most power efficient option would be P-t-P 10 Gbit/s Ethernet. In order to study a more realistic case, we limited the uplink capacity per CO to 320 Gbit/s. The results for this case are shown in Figures 4c and d. The uplink bandwidth limitation has no impact on the FTTN options because they can hardly exceed the maximum capacity of 320 Gbit/s per CO with 1000 users (see Figure 4c). On the contrary, the optical access technologies are strongly influenced by this limitation, especially those providing 10 Gbit/s access. They exceed this limit already for few tens of users. Hence, they become the most inefficient ones when the number of users per CO increases above 150. As it can be seen form Figure 4d, the most power efficient option in this particular case when assuming a large number of users is the P-t-P 1G Ethernet followed by 1G-EPON and GPON.
40
P-t-P 1G 30
1G-EPON P-t-P 10G GPON
20
10
0 1
Number of Users per CO (N user )
10
100
1,000
Number of Users per CO (N user )
d) 1,000 800
ADSL2+ VDSL2 (symmetric)
600 400
HFC 200 0 1
10
100
Number of Users per CO (N user )
1,000
Power per User per Gbit/s [W/Gbit/s]
c) Power per User per Gbit/s [W/Gbit/s]
10G-EPON
40
P-t-P 1G 30
P-t-P 10G
1G-EPON
10G-EPON GPON
20
10
0 1
10
100
1,000
Number of Users per CO (N user )
Figure 4. Power efficiency of a) FTTN and b) FTTH access options when assuming an unlimited available capacity in CO as well as c) FTTN and d) FTTH when the available capacity of the CO uplink is limited to 320 Gbit/s.
IV.
CONCLUSIONS
In conclusions, we investigated different wired access technologies my means of power efficiency. In our study, we considered two scenarios; one with unlimited uplink to the metropolitan area network and another one with a uplink limited to 320 Gbit/s. Our results have shown that for the unlimited case, the high-speed options with 10 Gbit/s link data rate show the highest power efficiency. When the uplink limitation is considered, which is a realistic assumption, 1G point-to-point and PON options become the most power efficient ones. Generally, the fiber-to-the-node (FTTN) configuration using ADSL2+, VDSL or HFC show a lower efficiency, excepting the case in which a large number of users are connected to the central office that has a limited uplink capacity. In this case, VDSL2 in the FTTN arrangement reaches approximately the same power efficiency as the 1G pointto-point optical Ethernet. ACKNOWLEDGMENT The work described in this paper was carried out with the support of the BONE project(“Building the Future Optical Network in Europe”), a Network of Excellence funded by the European Commission through the 7th ICT Framework Programme and the Project HOME-ICT funded by the Austrian Research Promotion Agency (FFG). REFERENCES [1]
[2]
[3]
[4]
M. Maier, “WDM Passive Optical Networks and Beyond: the Road Ahead,” [Invited], IEEE/OSA Journal of Optical Communications and Networking, vol. 1, no. 4, pp. C1-C16, September 2009. K.-I. Suzuki, “Long Reach PON System Using Optical Fiber Amplifier,” in Proceedings of OFC/NFOEC 2008, San Diego, CA, USA, workshop, February 2008. J. Baliga, R. Ayre, W. V. Sorin, K. Hinton, and R. S. Tucker, “Energy Consumption in Access Networks,” in Proceedings of OFC/NFOEC 2008, San Diego, CA, USA, paper OThT6, February 2008. A. Lovric, S. Aleksic, “Power Efficiency of Extended Reach 10GEPON and TDM/WDM PON, “ to be published in Proceedings of OFC/NFOEC 2010, San Diego, CA, USA, March 2010.
Slaviša Aleksić (M’00) received his Dipl.-Ing. and Ph.D. degrees in electrical engineering from the Vienna University of Technology, Austria, in 1999 and 2004, respectively. His current research interests include communication networks, photonic networks, energy consumption, highspeed optical and electrical signal processing systems, as well as high-speed media access control (MAC) protocol design and implementation. He is author or co-author of more than 50 scientific publications including book chapters, papers in peer-reviewed scientific journals, and contributions to internationally recognized conferences. He has experience in both research and industrial fields through successfully managing and conducting many projects related to communication networks including two projects funded by the Austrian Science Fund (FWF) and a number of projects in collaboration with several Austrian and European academic institutions and companies. He was involved in COST action no. 291 “Towards Digital Optical Internet” and the EU Network of Excellence “e-Photon/One.” Currently, he is the leader of the Austrian research group within the EU Network of Excellence “BONE.”
Dr. Aleksić is a member of the Institute of Electrical and Electronics Engineers (IEEE-USA), of the Austrian Electrotechnical Association (OVE-Austria), and of the Institute of Electronics, Information and Communication Engineers (IEICE-Japan). He has received several international awards, grants, and recognitions. Ana Lovrić received her BSc and MSc degrees in electrical engineering from Vienna University of Technology, Austria, in 2008 and 2010, respectively. Her current research topics include wired and wireless access networks as well as energy efficiency in the access area. The title of her master thesis is “Power Efficiency of Wired State-of-the-Art and Advanced Access Networks”. She has authored and coauthored papers in highly recognized international conferences. Dipl.-Ing. Lovrić is a student member of the Optical Society of America (OSA).