Sep 17, 2003 - and Environmental Engineering, Stanford University, Stanford, CA 94305 ..... Due to the structural response from a white noise excitation also ...
Source: Proceedings of the 4th International Workshop on Structural Health Monitoring, Stanford, CA, USA, September 15-17, 2003.
Power-Efficient Data Management for a Wireless Structural Monitoring System J. P. LYNCH, A. SUNDARARAJAN, K. H. LAW, A. S. KIREMIDJIAN and E. CARRYER
ABSTRACT A low-cost wireless sensing unit for installation in structural monitoring systems is proposed. To eliminate the high cost of installing cables widely used in conventional systems, each wireless sensing unit includes wireless radios for reliable communication of response measurements. With wireless radios consuming large amounts of power, battery preservation can be achieved by limiting the use of the wireless channel. This study explores two approaches to reducing the power demands of the wireless sensing unit. First, embedded engineering analyses are carried out by the sensing unit’s computational core to avoid transmission of long time-history records. Various engineering algorithms are encoded and executed using structural response data to illustrate the power saved in local data interrogation. Second, lossless data compression using Huffman coding is employed to reduce the size of data packets wirelessly transmitted. INTRODUCTION A structural monitoring system is an important engineering tool that provides detailed measurement of structural responses originating from ambient and external disturbances. A large number of structures in the United States, especially those located in zones of high seismic activity, have been instrumented with structural monitoring systems. The California Department of Transportation (Caltrans) has instrumented many of the state’s medium- and long-span bridges while the United States Geological Survey has instrumented many federal structures in the western United States [1, 2]. To date, the majority of monitoring systems are of conventional designs with cables employed for communication between system sensors and centralized data servers. While cables represent a reliable means of transferring data within the monitoring system, the installation of extensive cabling in structures can be expensive. In total, the cost of the monitoring system (including equipment and labor) can exceed $4,000 per channel with 12-channel installations costing well over $50,000, Jerome Peter Lynch, John A. Blume Earthquake Engineering Center, Department of Civil and Environmental Engineering, Stanford University, Stanford, CA 94305
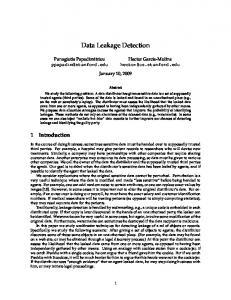
installation alone representing 50% of the total system cost [2]. Most recently, emerging technologies have found their way to the structural monitoring domain resulting in alternatives to conventional cable-based systems. To drive installation costs low, Straser and Kiremidjian first proposed the use of wireless communications in lieu of cables in a structural monitoring system [3]. Lynch et al. have extended their work by designing an advanced wireless sensing unit with sufficient computational power to carry-out embedded engineering algorithms on measurement data in near real-time [4]. Various validation tests of a wireless monitoring system built from wireless sensing units have been performed using laboratory and field structures. For example, the Alamosa Canyon Bridge in New Mexico has been widely used for performance comparison of wireless and conventional cable-based systems [5]. Conventional monitoring systems deliver electrical power to remote sensors through the same cables used for data communication. Unlike conventional systems, wireless structural monitoring systems have no convenient form of power delivery. Portable power sources, such as batteries, are likely candidates for wireless sensor networks, but with finite operational life spans they are a limited resource. Ideally, battery lives on the order of years are sought for wireless sensing units that are installed in large-scale civil structures. Optimization of the power consumption characteristics of a wireless structural monitoring system can be addressed at multiple levels in the system design. First, wireless sensing units with low energy demands can be designed; many researchers are currently exploring this option [6]. The optimal usage of battery sources can also be addressed at the system architecture level. Kottapalli et al. have designed a two-tiered wireless structural monitoring system with low-power radios used within spatially compact sensor subnets and highpower radios reserved for long-range communications between subnets [7]. This paper explores the design of a low-power wireless sensing unit intended for installation in structural monitoring systems. Fabricated from off-the-shelf components, the units are low-cost and rich in functional features. To preserve the life of portable batteries coupled with the wireless sensing unit, two power saving measures are considered. First, because the wireless modem requires large amounts of power for its operation, transmission of time-histories is avoided and embedded engineering analyses are locally executed by the unit’s computational core. Various analyses are considered including determination of primary modal frequencies and computational components of a two-tiered statistical time-series damage detection method. With analysis results transmitted in lieu of raw time-histories, significant gains in energy-efficiency will be attained. Second, when wireless transmission of time-histories is required, lossless data compression using Huffman coding is considered for reduction of wireless radio usage. DESIGN OF A WIRELESS SENSING AND ACTUATION UNIT The cornerstone element of the proposed wireless structural monitoring system is the wireless sensing unit. As such, the capabilities of the entire wireless monitoring system depend upon the functionality of the unit design. As presented in Figure 1, the design of the unit can be divided into four functional subsystems: sensor interface, computational core, wireless communications, and actuation interface.
Sensor Interface
Computational Core
16-bit A/D Converter (Single Channel)
RISC Microcontroller Atmel AVR
Digital Inputs (Two Channels)
512 KByte SRAM
Actuator Interface 12-bit D/A Converter (Single Channel)
Wireless Radio
Proxim RangeLan2 Wireless Modem
32-bit Motorola Power PC MPC555
External Power Source - 6V Minimum / 7.5V and 9V Typical
Figure 1. Design of the proposed wireless sensing and actuation unit Data can be collected simultaneously from multiple sensors attached to the sensing interface. In total, the interface provides three sensing channels with one channel dedicated to the collection of data from analog sensors and two additional channels for digital sensors. With the growth of microelectromechanical system (MEMS) fabrication, digital sensors that modulate their readings on square-wave signals are becoming increasingly popular. For the conversion of analog sensor readings to digital forms, a single-channel 16-bit analog-to-digital converter (A/D) is included in the interface. The interface can sample sensor data as high as 100 kHz. The core of the wireless sensing unit contains the computational power necessary for unit operation and for execution of embedded analyses. To create a core that is both low-power and capable of executing data interrogation algorithms, a twomicrocontroller design is pursued. General operation of the wireless sensing unit, such as acquisition and storage of sensor data and packaging of information for wireless transmission, is the primary role of the Atmel AVR AT90S8515 low-power microcontroller. The AVR microcontroller is an 8-bit architecture processor that draws 8 mA of current when powered by a 5 V source. With internal memory limited, sophisticated data interrogation tasks would be difficult to embed in the AVR microcontroller. As a result, a second microcontroller, the Motorola MPC555 PowerPC, is selected solely for execution of embedded engineering analyses. The 32bit MPC555 is chosen because it has ample internal program memory and floatingpoint calculations are internally performed by hardware. A drawback of the MPC555 is that it draws 110 mA of current when powered at 3.3 V. Due to MPC555 consuming more power than AVR, the MPC555 is ordinarily kept off. When engineering analyses are required for execution, the MPC555 is powered on by the AVR and turned off after their completion. By partitioning the functional tasks of the core between two microcontrollers, each has been chosen to best fit their respective roles. A low-power wireless radio is sought with communication ranges capable of accommodating sensor nodal distances of over 300 ft. The Proxim RangeLAN2 7911 wireless modem, operating on the 2.4 GHz FCC unlicensed band, is chosen. Using a 1 dBi omni-directional antenna, open space ranges of 1,000 ft. can be attained [8]. When installed in the interior of heavily constructed buildings, the range of the radio is reduced to approximately 500 ft. To attain its large communication range, the wireless radio consumes a large amount of power. When internally powered by 5 V, the wireless modem draws 190 mA of current during transmission and reception of data; when idle, the modem draws 60 mA of current.
The success of active sensing diagnostics for the detection damage in structures has prompted the addition of an actuation interface in the wireless sensing unit design [9]. Through the actuation interface, actuators such as piezoelectric pads embedded in or mounted upon structural members, can be commanded using a 12-bit digital-toanalog converter (D/A). A Texas Instruments DAC7624 is chosen for integration with the wireless sensing unit as a single channel actuation interface. The DAC7624 can output voltage signals between + 2.5 V and can be driven at 2 MHz. EMBEDDED ENGINEERING ANALYSES FOR POWER-EFFECIENCY The amount of energy the wireless sensing unit will require from a portable power supply, such as from a battery, is a focus of this study. The energy consumed by the unit will be experimentally measured using two 7.5 V battery sources. First, an alkaline battery pack constructed from Energizer AA E91 battery cells is considered. Second, lithium-based battery cells of high energy density are considered by constructing a battery pack from Energizer AA L91 battery cells. The wireless sensing unit is turned on and the electrical current drawn from the battery packs measured using a current meter. Based on the measured current draws, the life expectancy of the battery packs can be calculated from engineering design charts provided by the battery manufacturer. Table 1 summarizes the expected operational life of the batteries when continuously drained based on the currents measured. It should be noted that values listed in Table 1 are conservative because when installed in a structure use of the unit would be duty-cycled. If batteries are intermittently used, cell chemistries are provided time to re-attain equilibrium thus resulting in extended lives. Based on these findings, the wireless modem consumes the largest amount of battery energy. To preserve battery life, use of the modem should be minimized by limiting the amount of data wirelessly transmitted. The computational core of the wireless sensing unit will be used to process time-history data with pertinent results transmitted in lieu of time-history records. When the wireless sensing unit executes an embedded analysis, the MPC555 microcontroller is used. The power of the MPC555 is the rate of energy consumed from the unit power source. When drawing 110 mA at 3.3 V, the power of the MPC555 is 363 mW. Similarly, the RangeLAN2 radio consumes 190 mA at 5 V which is 950 mW of power. Clearly, the MPC555 is 2.6 times more power efficient than the wireless radio. To determine the total amount of energy saved, the time needed to perform embedded analyses needs to be calculated. The time for transmission of the raw time-history record can be calculated based on the radio serial baud rate (19,200 bit per second). As long as the time of execution of the analysis is faster than 2.6 times the time of transmission, battery energy will be saved and a longer battery life can be expected. TABLE 1. DURATION OF BATTERY SOURCES FOR VARIOUS OPERATIONAL STATES
Operational State
Circuit (mA)
Internal (V)
Energizer L91 (hours)
Energizer E91 (hours)
AVR On/MPC Off AVR On/MPC On RangeLAN Active RangeLAN Sleep
8 160 190 60
5 5/3.3 5 5
500 15 13 40
300 5 4 25
A large assortment of embedded analyses can be encoded in the wireless sensing unit core. In particular, algorithms pertaining to system identification and damage detection seem most attractive for immediate implementation. To assess the energy saved by the sensing unit by locally processing data, two algorithms are tested; a fast Fourier transform (FFT) and an algorithm for fitting auto-regressive time-series models. Representation of measurement data in the frequency-domain is necessary for determination of structural modal properties. Time-history data can be transformed to the frequency domain through the use of Fourier transforms. However, the FFT has been invented to reduce computational complexities associated with Fourier transforms. For this study, the Cooley-Tukey version of the FFT is embedded in the wireless sensing unit for local execution [10]. Many researchers are exploring the development of reliable algorithms for detection of damage in structural systems. Sohn et al. has proposed the application of pattern recognition methods to the damage detection problem [11]. Their approach uses the coefficients of auto-regressive (AR) and auto-regressive with exogenous inputs (ARX) models as feature vectors for classification (damage or undamaged). A database of AR-ARX model pairs is populated using models fit to ambient response data corresponding to the structure in an undamaged state. Future AR-ARX models obtained from the structure in an unknown state (damaged or undamaged) are compared to this database. Feature vectors that represent statistical outliers to the database designate potential damage in the structure. Assuming the structural response to be stationary, an auto-regressive (AR) process model fits discrete measurement data to a set of linear coefficients weighing past timehistory observations: p
y k = ∑ bi y k −i + rk
(1)
i =1
The response of the structure at sample index, k, as denoted by yk, is a function of p previous observations of the system response, plus, a residual error term, rk. Weights on the previous observations of yk-i are denoted by the bi coefficients. For calculation of the coefficients by the wireless sensing unit, Burg’s approach to solving the YuleWalker equations is chosen because it is proven to be more stable compared to leastsquares by avoiding matrix inversions [10]. ILLUSTRATION OF LOCAL DATA INTERROGATION The performance of the wireless sensing unit has been validated in the laboratory and field using an assortment of structures including the Alamosa Canyon Bridge in New Mexico [5]. Response data collected during these previous validation tests will be used to determine the amount of energy saved by the local processing of data. The time necessary for the MPC555 to fully calculate the modal frequencies and AR coefficients is measured. Based on the measured execution times, the energy consumed by the MPC555 as compared to the amount of energy required to wirelessly transmit the initial raw time-history records will be compared. The computation time of the embedded algorithms will depend upon the complexity of the analysis. For example, the computational complexity of the Cooley-Tukey FFT is of order O(NlogN) where N is the length of the initial time-history record. To verify this
TABLE 2. ENERGY ANALYSIS OF DATA INTERROGATION VERSUS TRANMISSION
Analysis
FFT FFT FFT AR (10 Coef) AR (20 Coef) AR (30 Coef) AR (10 Coef) AR (20 Coef) AR (30 Coef)
Length of Record N 1024 2048 4096 2000 2000 2000 4000 4000 4000
Time of MPC555 Calculation (sec) 0.0418 0.0903 0.1935 1.3859 2.8164 4.2420 2.7746 5.6431 8.5068
Energy Consumed MPC555 (J) 0.0152 0.0328 0.0702 0.5031 1.0224 1.5398 1.0072 2.0484 3.0879
Time for Wireless Transmission (sec) 1.7067 3.4133 6.8267 3.3333 3.3333 3.3333 6.6667 6.6667 6.6667
Energy Consumed Radio (J) 1.6213 3.2426 6.4854 3.1666 3.1666 3.1666 6.3333 6.3333 6.3333
Energy Saved (%) 99.062 98.988 98.917 84.112 67.713 51.374 84.097 67.657 51.243
relationship, FFT’s corresponding to different record lengths will be performed and the number of coefficients and time-history lengths will be varied during execution of the AR model fitting algorithm. Table 2 presents the time associated with each analysis and the energy saved. Clearly, the computational efficiency of the embedded FFT and transmission of modal frequencies as compared to transmission of the time-history record provides a major energy savings of over 98%. Calculation of AR coefficients is more complex and requires external memory for temporary data storage resulting in longer execution times. Hence, the energy saved is not as impressive as for the FFT, but major savings of over 50% are still experienced. Clearly, end-users of wireless sensing units should be cognizant of the execution times of their analyses, but on average, significant savings will be experienced by local data interrogation. LOSSLESS DATA COMPRESSION – HUFFMAN CODING Compression methods can be used for the reduction of data size by exploiting natural internal structures of data. Morse code serves as an early example of data compression with common letters like “e” represented by short Morse symbols and scarcely used letters like “z” by longer symbols. Compression algorithms generally fall in two broad classes: lossless and lossy compression. Lossless compression, often used in medical imaging applications, guarantees the integrity of the data without distortion. In contrast, lossy compression reduces data with reasonable distortions but can achieve higher compression rates. Similar to medical imaging, there is a low tolerance for distortion in structural response data resulting in only lossless compression considered for inclusion in the wireless sensing unit. Numerous lossless compression techniques can be considered. The computationally inexpensive compression technique, known as Huffman coding, is selected for implementation [12]. Lossless Huffman coding exploits statistical relationships in the data to pair short symbols to data values with high probability and long symbols to those with low probability of occurrence. For example, if the 16-bit integer value “2342” was the most commonly occurring data sample, a short 1-bit symbol can be given to it, such as “0”. Next, if “2455” is the next most common symbol, it might be given the 2-bit symbol “10”. Hence, provided the probability mass density of the data, a compact binary representation of variable length can be
Data
Decorrelation Transform
Huffman Lookup Table
Compressed Data for Wireless Transmission
Wireless Sensing Unit
Huffman Lookup Table
Inverse Decorrelation
Data
Wireless Sensing Unit
Figure 2. Huffman compression of sensor data using wireless sensing units used for compressed coding. Prior to generation of a Huffman lookup table, inherent structures in data can be exploited for better compression of greater compression rates. The structure in the data can be described by transformation of the initial record using a de-correlation transform. Many transforms could serve as suitable candidates, but Wavelet Transforms (WT) will be used in this study. WT have also been used in damage detection methods, hence a shared WT software module in the wireless sensing unit could be used for both damage detection and data compression. The complete compression process, including decompression, is presented in Figure 2. This study will concentrate upon the illustration of using Huffman coding for compression of data for wireless transmission and will consider variations in the type of response data considered. Structural response data acquired from a 5 degree-offreedom laboratory test structure that can be excited at its base by a shaking table is considered in this study [5]. The top-story acceleration response of the structure to sweeping sinusoidal and white noise inputs are recorded by the wireless sensing unit using an effective 12-bit A/D converter. The sweeping sinusoidal input has a constant displacement amplitude envelope of 0.075 in. and a linearly varying frequency of 0.25 to 3 Hz over 60 sec. The white noise input record has zero mean and a displacement standard deviation of 0.05 in. Table 3 summarizes the performance of lossless compression and the amount of energy saved having compressed data using the MPC555 and wirelessly transmitting the compressed record. To illustrate the importance of de-correlation of response data prior to Huffman coding, compression is performed with and without WT for decorrelation. In all cases considered, compression rates better than 80% have been achieved. For the case of the sweep excitation input, a compression rate of 61% was achieved after the initial record is de-correlated using WT. If the record is not decorrelated and internal statistical structures are not exploited in the creation of the Huffman coding lookup table, compression rates of approximately 71% can still be attained. Due to the structural response from a white noise excitation also being fairly white, the response lacks an inherent structure that the de-correlation transform can leverage for compression. As a result, negligible reductions in the compression rate are experienced when WT are employed on white response records. Since time required by the MPC555 to compress data is negligible, the compression rate reflects the energy saved by the wireless radio in transmitting the compressed record. TABLE 3. COMPRESSION OF STRUCTURAL RESPONSE DATA USING HUFFMAN CODING
Excitation Type
Decorrelation
Sweep Sweep White White
None Wavelets None Wavelets
A/D Resolution (bits) 12 12 12 12
Total Record Size (bytes) 1024 1024 1024 1024
Compressed Record Size (bytes) 733 626 795 791
Compress Rate (%) 71.58 61.17 77.60 77.25
Energy Saved (%) 71.58 61.17 77.60 77.25
CONCLUSIONS The design of a wireless sensing unit for structural monitoring has been presented. A major innovation of the proposed unit is the computational capabilities of its core. The core’s microcontrollers facilitate localized processing of raw timehistory data prior to transmission in the wireless network. Distributing computational power throughout the sensor network in this manner attains high energy efficiency thereby preserving portable battery operational lives. The study has focused upon illustration of these energy-efficiencies by performing local data interrogation tasks such as the FFT and Burg’s method for determination of AR model coefficients. Local execution of the FFT saved upwards of 98% of battery energy while AR model fitting varied from 50 to 84% energy saved. Lossless data compression has also been presented as a means of further preserving battery power by reducing the size of timehistory records prior to transmission. Huffman coding and data de-correlation using Wavelet Transforms has been shown to compress time-history records to 61% of their original size thereby saving additional battery energy. ACKNOWLEDGEMENTS
Collaboration with Drs. Chuck Farrar and Hoon Sohn of Los Alamos National Lab has been invaluable to the progress of this study. This research is partially funded by the National Science Foundation under grants CMS-9988909 and CMS-0121842. REFERENCES 1. Hipley, P. 2001. “Caltran’s Current State-of-Practice,” Proceedings of the Instrumental Systems for Diagnostics of Seismic Response of Bridges and Dams. Consortium of Organizations for StrongMotion Observation Systems, January 15, 2001. 2. Celebi, M. 2002. Seismic Instrumentation of Buildings (with Emphasis on Federal Buildings). Report No. 0-7460-68170, United States Geological Survey (USGS), Menlo Park, CA. 3. Straser, E. G. and A. S. Kiremidjian. 1998. A Modular Wireless Damage Monitoring System for Structures. Report No. 128, John A. Blume Earthquake Engineering Center, Stanford, CA. 4. Lynch, J. P., A. Sundararajan, K. H. Law, A. S. Kiremidjian, T. W. Kenny and E. Carryer. 2003. "Embedment of Structural Monitoring Algorithms in a Wireless Sensing Unit," Structural Engineering and Mechanics, 15(3): 285-297. 5. Lynch, J. P., K. H. Law, A. S. Kiremidjian, E. Carryer, C. R. Farrar, H. Sohn, D. Allen, B. Nadler and J. Wait. 2002. "Laboratory and Field Validation of a Wireless Sensing Unit Design for Structural Monitoring," Proceedings of US-Korea Workshop on Smart Structural Systems, Pusan, Korea, August 24-25, 2002. 6. Min, R., M. Bhardwaj, S. H. Cho, E. Shih, A. Sinha, A. Wang and A. Chandrakasan, A. 2001. “Low-Power Wireless Sensor Networks,” Proceedings of the 14th International Conference on VLSI Design, Bangalore, India, January 3 – 7, 2001. 7. Kottapalli, V. A., A. S. Kiremidjian, J. P. Lynch, E. Carryer, T. W. Kenny, K. H. Law and Y. Lei. 2003. "Two-Tiered Wireless Sensor Network Architecture for Structural Health Monitoring," SPIE 10th International Symposium on Smart Structures and Materials, San Diego, March 2-6, 2003. 8. Proxim Corporation. 1998. RangeLAN2 Serial Adapter Models 7910 and 7911 User’s Guide. Proxim Corporation, Inc., Sunnyvale, CA. 9. Wu, F. and F. K. Chang. 2001. “Diagnosis of Debonding in Steel-Reinforced Concrete with Embedded Piezoelectric Elements.” Proceedings of the 3rd International Workshop on Structural Health Monitoring , Stanford, September 12-14, 2001. 10. Press, W. H., S. A. Teukolsky, W. T. Vetterling and B. P. Flannery. 1992. Numerical Recipes in C: The Art of Scientific Computing. Cambridge: Cambridge University Press. 11. Sohn, H. and C. R. Farrar. 2001. “Damage Diagnosis Using Time Series Analysis of Vibration Signals,” Smart Materials and Structures, 10(3): 446-451. 12. Sayood, K. 1996. Introduction to Data Compression. San Francisco: Morgan Kaufman Publishers.