POWER EXCHANGE BEHAVIOR IN A HYDROTHERMAL SYSTEM: THE CHILEAN CASE
Luis S. Vargas, Rodrigo Palma B., Oscar Moya A.
Departamento Ingeniería Eléctrica, Universidad de Chile, Av. Tupper 2007, Santiago, Chile. Emails:
[email protected],
[email protected] and
[email protected]
SUMMARY In this paper a study of a proposed market power exchange in the chilean system is analyzed. The study is carried out through a test case framework, which is used to analyze structural behavior of the market agents. Test cases reproduce real scenarios on the longitudinal Chilean Interconnected System (CIS), where physical bilateral contracts (PBC) and strategic bidding are simulated. 1. INTRODUCTION Starting in Latin America, new electric sector regulations were set in Chile in 1982, Argentina in 1992, Perú in 1993, Bolivia and Colombia in 1994, the Central American countries of Panamá, El Salvador, Guatemala, Nicaragua, Costa Rica and Honduras in 1998 [1, 2]. In Europe this process started with the U.K. in 1989, followed by the Scandinavian countries in 1990-1995 [2, 3]. For the member states of the European Union, 1996 directive of the European Parliament defined the framework of a common European electricity market and required all member states to introduce competition in the electricity supply sector by February 1999 [4]. Reforms in the structure of electricity services in the US started with the California restructuring proposal in 1997 [5] and the Federal Energy Regulatory Commission (FERC) creating open access conditions [6]. Norway in 1987 and Australia in 1991 also created competition condition in the electrical sector [2, 7]. Currently there are a growing number of countries in Asia and EastEurope that will join the worldwide restructuring process. As a result, worldwide market organization of the power industry presents a wide range of arrangements, which may be classified in the following three basic categories [1− 3], [7]: -
Pool market, Market based on physical bilateral contracts, and Market based on financial bilateral contracts.
Real markets throughout the countries correspond to a mix of these categories [12]. This paper focuses on markets based on physical bilateral contracts and a power
exchange market, which include daily and intradaily markets. The Chilean Interconnected System (CIS) covers an area of 2000 km in length, and supplies a peak load of 4800 MW, with nearly 600 buses. The major load is located in Santiago, Chile’s capital, located in the central part of the system. Due to the longitudinal structure, there are power flows from the southern part of the country to the central part; mainly transmitted through 500 kV lines; and from the northern part to the central part, mainly transmitted through 220 kV lines. In both corridors there has been congestion in the last years. The annual load increase rate, during the last seven years, has been approximately 7% on average. In addition, there is a 65% of hydro generating plants; mainly in the southern part; and 35% of thermal units, mainly located in the central and northern areas. Among the hydro plants there is a few with a large reservoir, which enable them to deliver full capacity for a long period of time. All the above features impose constraints to competition in an open market and many issues, such as ancillary services, appear as critical during the operation. For that reason, the government is proposing a change in the regulatory frame, which consists of a migration from the actual mandatory pool structure with audited costs to a new market based on physical bilateral contracts (PBC) and a power exchange (Px) [14]. The analysis of the impact of this change is the main motivation for this work. The paper presents a brief description of the proposed market structure for the Chilean system. This description focuses on the energy market only. Thus, power market transactions, which are related to the capacity of the system, and ancillary services are not included in the study. The structural behavior of the market agents is analyzed in a test case framework, which is constructed in order to reproduce real scenarios on the longitudinal CIS system. The analysis covers physical bilateral contracts (PBC) and strategic bidding. The results show that the performance of a market power exchange for a longitudinal system is critically dependent on the way the
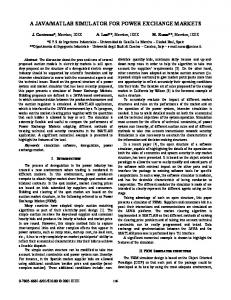
transmission congestion and biding process for hydro and thermal units are designed. 2. PROPOSED MARKET STRUCTURE The Chilean Power Exchange is proposed as a singleround auction, where the supply bids are matched with demand bids by a market operator (MO), without any additional iteration with market participants. Bids consist of a pair of values corresponding to quantity (MWh) and price (US$/MWh), which are submitted privately to the MO. Thus, for each hour a supply curve is built considering all the bids ordered by increasing prices. Similarly, a demand curve is built with the offers of buyers. The intersection of the supply and demand curves determines a single uniform market-clearing price and the generation units in operation. Then, this preliminary schedule is sent to the Independent System Operator (ISO), which incorporates all the constraints of the transmission and security of the system. In addition, it is also possible to establish bilateral contracts between buyers and sellers, which also have to be submitted to the ISO for the general coordination.
MO
Finally, in order to fulfill additional operation requirements, an ancillary services auction, is also considered. In Figure 1 it is depicted this market structure. The proposed market structure is similar to the market of Spain. However, there are some key features of CIS, which need to be addressed carefully in order to design a suitable Px in Chile. These characteristics are: § Reduced number of producers. There are three main producers, which account for 95% of the market. The HHI index [15] for market concentration is 3829, i.e., the market is highly concentrated. § High demand increase ratio (above 7% on average), § Network is strongly longitudinal, with congestion in some key lines of the system, § Hydrothermal production, with near 65% hydro and 35% thermal, § High variability in weather conditions may lead to dry seasons or excess in the water reservoirs for different years, § There are two major reservoirs with inter-annual capabilities.
MO
ISO
OPERATIONAL CONSTRAINTS
ISO
SECURITY CONSTRAINTS
ISO
SECURITY CONSTRAINTS
PBC PRELIMINARY DISPATCH
DISPATCH
REAL TIME DISPATCH
ANCILLARY SERVICES MARKET
DAILY MARKET
Day Ahead
Hours ahead
Figure 1. Market Structure
Real Time
3. PHYSICAL BILATERAL CONTRACTS In this section the effects of PBC in the operation of the proposed market structure is analyzed. A case study is constructed with real operational conditions and the settings of the proposed Px. 3.1 Definitions Lets start defining the total demand of the system (DT) according to the expression DT = DPBC + DCPx
(1)
Where DPBC stands for the demand with bilateral contracts and DCPx is the demand dealing directly with the Px. Thus, a Consumer has two possibilities to buy energy, either through PBC with generating companies or through buying directly from the power exchange. Consumer here must be understood as a big consumer with more than 200 kW. All other consumers will be considered as regulated demand, which is usually served through a distribution company with PBC. In addition, generating companies can also submit buying bids to the Px for its PBC contracted. By taking a specific period of time, the income from the energy market of a generating company (Bfi) can be written as Bfi = EPBCi× (PPBCi − Pc) + Ei×(Pc − Cmgi)
(2)
Where ECBFi is the contracted energy of generating unit i in PBC, PCBFi is the contracted price of that PBC, Pc is the clearing price, Ei is the dispatched energy of unit i, Cmgi marginal production cost of generating company i, Bfi income of generating company i. The total energy balance for the system is ΣEi = DT + Losses
factor in the economical performance of companies. For this reason, a numerical exercise to quantify this effect is carried out in the next section. 3.2 Case Study We use de CIS as a test case with a demand of 1000 GWh. Three scenarios where the PBC are 75%, 50% and 10% of total demand, are studied. The test conditions are as follows: § Four generating companies, § PBC are assumed to be contracted at the same price for all the generators, § No transmission losses or congestion are considered, § In addition, the demand of the PBC is contracted at the same price of 30 mills/kWh for all generators. For each case, five different prices for PBC transactions are studied: Alternative A, 20 mills/kWh; Alternative B, 25 mills/kWh, Alternative C, 30 mills/kWh, Alternative D, 25 mills/kWh and Alternative E, 30 mills/kWh. A. The Base Case The bidding of generating companies is constructed with two blocks of energy. The first block, an amount equal to the energy of its PBC, is offered at a price equal to its marginal cost. The second block of energy, which in this case is the rest of the available energy of the company, is offered at a superior price. On the other hand, in order to simulate the lack of elasticity in the demand, all the energy is aggregated in one block (DCPx+DPBC) at a same price. The bidding information of the base case is presented in Table 1.
Agent Company1 Company2 Company3 Company4 DCPx+DPBC
(3)
where the addition includes all the generating companies. The result of a particular company will depend on both, the balance in the bilateral contracts (the first term in the right hand side of Equation 2), and the balance in the power exchange transactions (the second term in the right hand side of the same equation). Thus, as the clearing price is unknown in advance, there is uncertainty regarding the PBC results and, therefore, they are a key
TABLE 1. Bidding Information 1st Block 2nd Block Price Energy Price Energy [mills/kWh] [GWh] [mills/GWh] [GWh] 15 100 20 200 10 100 20 300 15 200 20 300 20 100 25 300 30
1000
0
0
The clearing price for the base case is obtained at the crossing of offer and demand curves, as depicted in Figure 2. In Figure 2, the clearing price (Pc) is 25 mills/kWh and the total energy is 1000 GWh with the following distribution: § 800 GWh are obtained from the full delivery of company 1 (200 GWh), company 2 (300 GWh) and company 3 (300 GWh),
§ 100 GWh come from the first block of company 4, § 100 GWh come from the second block of company 4.
(Re) and the last column shows the total income from the energy market (BF). Tabla 2. Results for 50% of PBC
P r i c e [ m i l l s / k Wh]
Company 30
Utility 1 Utility 2 Utility 3 Utility 4 TOTAL
Pc 25 20
ICBF MUS$ 2000 2000 4000 2000 10000
15
Company 10 5 0
200
400
600 800 E n e r g y [ G Wh]
1000
1200
Utility 1 Utility 2 Utility 3 Utility 4 TOTAL
Figure 2. Clearing Price.
Company
Note that in the base case all marginal costs are inferior to the clearing price. In other words, all generating companies are in service.
Utility 1 Utility 2 Utility 3 Utility 4 TOTAL
B. The effect of changing the percentage of PBC in the market In this subsection, the impact of PBC on the market is studied. To achieve this, we analyse the effect of changing the percentage of PBC in the market transactions. We have two extreme cases. On one hand, if the percentage of PBC is null, then we have a pure Px market, as it was nearly practiced in California. On the other hand, if the amount of PBC approaches the full demand, every company must satisfy its own contracted energy at all times. According to the proposed Px framework, this task may be carried out by each company, which has three alternatives: with its own generating units, by contracting another producer as a supplier, or by a mix of both. In this study we assume that every generating company submit a buying bid for the full amount of its PBC. CASE I. PBC are 50% of Total Demand In this case the PBC are half of the full load of the system. The economical results are shown in Table 2. In Table 2 the first column shows the identification of the company, the second column indicates the income from PBC for each company (IPBC), and the third column contains the income from sales of energy in the Px (VB). The fourth column shows the total energy that is purchased at clearing price for covering the PBC (CB). The fifth column contains the production costs (CP), the sixth column indicates the results at the power exchange
Company Utility 1 Utility 2 Utility 3 Utility 4 TOTAL Company Utility 1 Utility 2 Utility 3 Utility 4 TOTAL
ICBF MUS$ 2500 2500 5000 2500 12500 ICBF MUS$ 3000 3000 6000 3000 15000 IPBC MUS$ 1500 1500 3000 1500 7500 IPBC MUS$ 1000 1000 2000 1000 5000
Alternative A VB CB CP MUS$ MUS$ MUS$ 5000 2500 3000 7500 2500 3000 7500 5000 4500 5000 2500 4000 25000 12500 14500 Alternative B VB CB CP MUS$ MUS$ [MUS$] 5000 2500 3000 7500 2500 3000 7500 5000 4500 5000 2500 4000 25000 12500 14500 Alternative C VB CB CP MUS$ MUS$ MUS$ 5000 2500 3000 7500 2500 3000 7500 5000 4500 5000 2500 4000 25000 12500 14500 Alternative D VB CB CP MUS$ MUS$ MUS$ 5000 2500 3000 7500 2500 3000 7500 5000 4500 5000 2500 4000 25000 12500 14500 Alternative E VB CB CP MUS$ MUS$ [MUS$] 5000 2500 3000 7500 2500 3000 7500 5000 4500 5000 2500 4000 25000 12500 14500
Re MUS$ -500 2000 -2000 -1500 -2000
Bf MUS$ 1500 4000 2000 500 8000
Re MUS -500 2000 -2000 -1500 -2000
Bf MUS$ 2000 4500 3000 1000 10500
Re MUS$ -500 2000 -2000 -1500 -2000
Bf MUS$ 2500 5000 4000 1500 13000
Re MUS$ -500 2000 -2000 -1500 -2000
Bf MUS$ 1000 3500 1000 0 5500
Re MUS$ -500 2000 -2000 -1500 -2000
Bf MUS$ 500 3000 0 -500 3000
For all companies, alternatives A, B and C render a positive total income. On fact, alternative C shows the greater values due to its maximum price for PBC (30 mills/kWh). Here, the highest income is for Utility 2 because this company has the least marginal marginal cost, i.e., it is the most efficient company in service. For the alternative D the Utility 4 obtains a null income, in other words, this company covers its operational costs without surplus. The other utilities can still obtain positive income. The worst result is exhibited under alternative E, where Utility E shows a negative income. This is due to the lowest selling price for the PBC of 10 mills/kWh, whereas this company has to buy its contracted energy at a price of 25 mills/kWh. On the other hand, the results at
the power exchange report an insufficient income to cover this deficit. CASE II. PBC are 75% of Total Demand In this case the PBC are 75% of the full load of the system. The economical results are shown in Table 3. Tabla 3. Results for 75% of Compny Utility 1 Utility 2 Utility 3 Utility 4 TOTAL Compny Utility 1 Utility 2 Utility 3 Utility 4 TOTAL Compny Utility 1 Utility 2 Utility 3 Utility 4 TOTAL Compny Utility 1 Utility 2 Utility 3 Utility 4 TOTAL Compny Utility 1 Utility 2 Utility 3 Utility 4 TOTAL
ICBF MUS$ 3000 3000 6000 3000 15000 ICBF MUS$ 3750 3750 7500 3750 18750 ICBF MUS$ 4500 4500 9000 4500 22500 ICBF MUS$ 2250 2250 4500 2250 11250 ICBF MUS$ 1500 1500 3000 1500 7500
Alternative A CB CP [MUS$] [MUS$] 3750 3000 3750 3000 7500 4500 3750 4000 18750 14500 Alternative B VB CB CP [MUS$] [MUS$] [MUS$] 5000 3750 3000 7500 3750 3000 7500 7500 4500 5000 3750 4000 25000 18750 14500 Alternative C VB CB CP [MUS$] [MUS$] [MUS$] 5000 3750 3000 7500 3750 3000 7500 7500 4500 5000 3750 4000 25000 18750 14500 Alternative D VB CB CP [MUS$] [MUS$] [MUS$] 5000 3750 3000 7500 3750 3000 7500 7500 4500 5000 3750 4000 25000 18750 14500 Alternative E VB CB CP [MUS$] [MUS$] [MUS$] 5000 3750 3000 7500 3750 3000 7500 7500 4500 5000 3750 4000 25000 18750 14500 VB [MUS$] 5000 7500 7500 5000 25000
Re [MUS$] -1750 750 -4500 -2750 -8250
Bf MUS$ 1250 3750 1500 250 6750
Re Bf [MUS$] [MUS$ -1750 2000 750 4500 -4500 3000 -2750 1000 -8250 10500 Re Bf [MUS$] [MUS$ -1750 2750 750 5250 -4500 4500 -2750 1750 -8250 14250 Re Bf [MUS$] [MUS$ -1750 500 750 3000 -4500 0 -2750 -500 -8250 3000 Re Bf [MUS$] [MUS$ -1750 -250 750 2250 -4500 -1500 -2750 -1250 -8250 -750
Same as in the previous case, all companies render a positive total income for alternatives A, B and C. But in this case, alternative A shows lower values than in the previous case. On the other hand, alternative B shows the same results and alternative C obtains greater values as compared to the previous case. Here, the highest income is again for Utility 2, the most efficient company in service. This utility shows a better performance than in the previous case.
Thus, in this case results are more extreme than in the precedent case. On one hand, they exhibit greater income, for case C, and on the other hand a worst result for alternative E. CASE III. PBC are 10% of Total Demand In this case the PBC are 10% of the full load of the system. In Table 4 a summary of the economical results is presented. Tabla 4. Results for 10% of PBC Compny Utility 1 Utility 2 Utility 3 Utility 4 TOTAL Compny Utility 1 Utility 2 Utility 3 Utility 4 TOTAL Compny Utility 1 Utility 2 Utility 3 Utility 4 TOTAL Compny Utility 1 Utility 2 Utility 3 Utility 4 TOTAL Compny Utility 1 Utility 2 Utility 3 Utility 4 TOTAL
Alternative A ICBF VB CB CP [MUS$] [MUS$] [MUS$] [MUS$] 400 5000 500 3000 400 7500 500 3000 800 7500 1000 4500 400 5000 500 4000 2000 25000 2500 14500 Alternative B ICBF VB CB CP [MUS$] [MUS$] [MUS$] [MUS$] 500 5000 500 3000 500 7500 500 3000 1000 7500 1000 4500 500 5000 500 4000 2500 25000 2500 14500 Alternative C ICBF VB CB CP [MUS$] [MUS$] [MUS$] [MUS$] 600 5000 500 3000 600 7500 500 3000 1200 7500 1000 4500 600 5000 500 4000 3000 25000 2500 14500 Alternative D ICBF VB CB CP [MUS$] [MUS$] [MUS$] [MUS$] 300 5000 500 3000 300 7500 500 3000 600 7500 1000 4500 300 5000 500 4000 1500 25000 2500 14500 Alternative E ICBF VB CB CP [MUS$] [MUS$] [MUS$] [MUS$] 200 5000 500 3000 200 7500 500 3000 400 7500 1000 4500 200 5000 500 4000 1000 25000 2500 14500
Re Bf [MUS$] MUS$ 1500 1900 4000 4400 2000 2800 500 900 8000 10000 Re Bf [MUS$] MUS$ 1500 2000 4000 4500 2000 3000 500 1000 8000 10500 Re Bf [MUS$] MUS$ 1500 2100 4000 4600 2000 3200 500 1100 8000 11000 Re Bf [MUS$] MUS$ 1500 1800 4000 4300 2000 2600 500 800 8000 9500 Re Bf [MUS$] MUS$ 1500 1700 4000 4200 2000 2400 500 700 8000 9000
In this case all companies render a positive total income for all alternatives. In other words, PBC have little impact on the results of the companies, and they exhibit good performance in the PX because their marginal production costs are lower than the clearing price. Thus, this case is more stable than the two precedent cases.
3.3. Industry Results For alternatives D and E, results are worst than the previous case. On fact, here for alternative E three utilities show negative results, and just Utility 2 shows a positive balance.
It is possible to draw some conclusions regarding the performance of the production industry as a whole. In
Table 5 the summary of total income balance (BF) for generators is presented for each case. Table 5. General industry results General industry results % CBF 10 50 75
Alterna Alternati ve B tive A MUS$ [MUS$] 10000 10500 8000 10500 6750 10500
Alternati ve C [MUS$] 11000 13000 14250
Alternati ve D [MUS$] 9500 5500 3000
Alternati ve E [MUS$] 9000 3000 -750
From Table 5 we see that alternative B has no variation with respect to PBC, which is due to the equality between the clearing and PBC price. Also, Table 5 shows extreme values when the PBC are 75% of the full load of the system. This means, that for this case it is possible to obtain the best and the worst results, depending on the efficiency of the generating units. Thus, for alternative C the highest results are achieved, whereas alternative E shows the lowest results. On the other hand, when there is a 10% of PBC, all alternatives are similar. In other words, PBC has low impact on the results of companies and they will depend mostly on the difference between the clearing price and their production marginal cost. Thus, in this case the economical performance of companies depend almost entirely on Px, as it was the California market. In this light, if PBC are a significant percentage of the contracted load, they can be seen as a convenient tool to stabilize Px fluctuations.
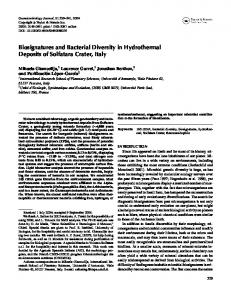
4.1 Base Case In order to study the effect of strategic bidding we set up a base case (called case 0), where all participants bid with their marginal production costs. The demand is taken from the actual CIS demand as of April 20, 2001. The bidding for this case is shown in Table 6. Table 6. Marginal production costs bids Company
T1 T2 T3 T4 P1 E1 P2 E2 P3 E3 P4 E4 10 1000.0 30 3000.0 0 0.0 0 0.0 5 276.3 14 959.0 20 1297.3 45 1469.5 10 600.0 25 900.0 30 1067.0 0 0.0 5 250.9 18 372.2 0 0.0 0 0.0
Utility 1 Utility 2 Utility 3 Utility 4
In Table 6, Utility 2 has four steps (T1 through T4) in its marginal cost curve, Utility 3 has three steps, and the other two utilities have only two steps. For each step, the price (Pi) and the amount of energy (Ei) are shown. The result of the auction in this base case is presented in Figure 2. Results BE 20 April 2001 [US$/MWH]
[MWH] 5500 5000
45
Total Energy Clearing Price
40 35
4500
30
4000
25 3500 20 3000
15
2500
10
2000
There is also a risk involved in this operations, and some companies may experience a decrease in their income. This case occurs when there is an important percentage of PBC and the clearing price is high. In this condition, the income is decreased, as shown in Table 3 by Utilities 1, 3 and 4 for a price of PBC of 30 mills/kWh (Alternative E).
4. STRATEGIC BIDDING According to the economic theory, in a perfectly competitive market generating companies should bid very close to their marginal production costs to maximize returns [8], [11]. However, due to the fact that electricity market is not perfect (lack of elasticity in demand, low number of competitors, lack of energy storage, etc.), suppliers may elaborate their bids in a different way to seek a maximization of their benefit [9,10]. In this section, we study the effect of strategic bidding in the proposed market structure for the chilean system.
5
1500
0 1 2
3
4 5
6
7
8
9 10 11 12 13 14 15 16 17 18 19 20 21 22 23 24
HOUR
Figure 2. Clearing for day April 20, 2001 4.2 Strategic Bidding in one Utility Then, we let just one participant, in this case Utility 3, to change its bid in order to maximize its own profit. With these changes we construct ten different bids, as shown in Appendix A. The economical results are shown in Table 7. In this table we can see that Utility 3 reaches its maximum income for Case 7, where it experiences a difference of MUS$ 236,75 with respect to the base case (case 0). Also, from Table 7 we can verify that the other companies experience an increment in their income. This is due to the fact that the clearing price is higher on average than the base case.
4.3 Comments
Tabla 7. Economical results Utility 1 CA SE
Engy GWh
VB [MUS$]
CB [MUS$]
CP [MUS$]
Re [MUS$]
Bf MUS$
0 1 2 3 4 5 6 7 8 9 10
34,41 31,89 31,80 32,76 34,22 32,41 32,22 30,53 31,22 30,89 30,84
344,14 886,40 873,31 878,21 912,35 891,68 906,23 870,65 894,01 894,07 882,31
202,08 344,14 547,08 318,92 538,67 318,01 518,47 327,64 511,73 342,23 538,67 324,15 555,50 322,25 568,13 305,27 570,65 312,24 580,75 308,94 572,33 308,38 Utility 2
-202,08 20,40 16,64 32,10 58,39 28,86 28,48 -2,74 11,12 4,38 1,60
302,92 525,40 521,64 537,10 563,39 533,86 533,48 502,26 516,12 509,38 506,60
CA SE
Engy GWh
VB [MUS$]
CP [MUS$]
Re [MUS$]
Bf MUS$
0 1 2 3 4 5 6 7 8 9 10
35,26 29,72 29,10 28,35 27,78 28,95 29,27 30,46 29,92 30,70 30,61
352,56 811,89 786,75 748,76 732,33 783,69 815,60 858,62 854,01 882,72 868,10
135,12 176,28 365,63 148,60 360,00 145,51 346,50 141,77 342,00 138,88 360,00 144,75 371,25 146,33 379,69 152,29 381,38 149,62 388,13 153,52 382,50 153,06 Utility 3
41,16 297,66 281,23 260,48 251,45 278,94 298,02 326,64 323,02 341,08 332,54
CA SE
Engy GWh
VB [MUS$]
0 1 2 3 4 5 6 7 8 9 10
12,12 20,12 20,74 20,95 20,17 20,19 20,18 20,19 20,16 20,11 20,19
121,20 560,17 565,09 538,25 497,21 547,16 564,85 585,34 567,73 588,20 582,44
CA SE
Engy GWh
VB [MUS$]
CB [MUS$]
CP [MUS$]
Re [MUS$]
0 1 2 3 4 5 6 7 8 9 10
8,93 8,93 8,93 8,37 8,21 8,93 8,93 8,93 8,80 8,93 8,93
89,33 241,93 238,21 220,64 215,77 238,21 245,65 251,24 250,29 256,82 253,10
34,08 92,08 90,67 87,27 86,13 90,67 93,50 95,63 96,05 97,75 96,33
44,66 44,66 44,66 41,86 41,07 44,66 44,66 44,66 43,99 44,66 44,66
10,58 105,18 102,88 91,51 88,57 102,88 107,49 110,95 110,25 114,40 112,10
CB [MUS$]
CB [MUS$]
CP [MUS$]
Re [MUS$]
81,12 121,20 219,38 201,20 216,00 207,37 207,90 209,48 205,20 201,68 216,00 201,90 222,75 201,80 227,81 201,91 228,83 201,62 232,88 201,11 229,50 201,91 Utility 4
-81,12 139,60 141,72 120,86 90,33 129,26 140,31 155,63 137,28 154,21 151,03
378,66 635,16 618,73 597,98 588,95 616,44 635,52 664,14 660,52 678,58 670,04
Bf MUS$ 121,38 342,10 344,22 323,36 292,83 331,76 342,81 358,13 339,78 356,71 353,53
Bf MUS$ 95,58 190,18 187,88 176,51 173,57 187,88 192,49 195,95 195,25 199,40 197,10
Diff. wrt Case0 MUS$ 0,00 222,48 218,72 234,18 260,47 230,94 230,56 199,34 213,20 206,46 203,68 Diff. wrt Case 0 MUS$ 0,00 256,50 240,07 219,32 210,29 237,78 256,86 285,48 281,86 299,92 291,38 Diff. wrt Case 0 MUS$ 0,00 220,72 222,84 201,98 171,45 210,38 221,43 236,75 218,40 235,33 232,15 Diff. wrt Case o MUS$ 0,00 94,60 92,29 80,93 77,99 92,29 96,90 100,36 99,67 103,82 101,51
This exercise shows that strategic bidding is a very profitable mechanism for generating companies, which can access to a significant increase in their income. This can be done by using a bidding strategy different from the marginal production cost. For this reason, the proposed Px structure in Chile enforces companies to submit bidding according to its marginal production costs [14]. There is a discussion under way regarding the hydro power plants with reservoir. Some of them may store energy and transfer it between consecutive years. The important question here is how to compute the marginal production cost of that plants. Thus, this is a key point for the performance of the proposed Px. 5. CONCLUSIONS In this paper a structural study of a proposed market power exchange for the chilean market has been presented. The study is based on a test case, where real information from the agents of the system is used. Results show the following: §
§
§
Physical bilateral contracts are a key element for stabilizing the electric market, which otherwise will experience fluctuations as the Px varies according to the bidding agenda of each participant. There is a trade off between the percentage of PBC and the risk in the PX. In the test cases studied, when PBC represent 50% or les of the total load, the income of generating companies is stabilized. When this percentage is over 75% there is a major risk, which can lead to great increase o losses in the company´s income. Strategic bidding can give important revenues to generating companies. This leads to an increase in the clearing price on average.
All the above elements are currently under study in order to improve the proposed market structure in Chile. ACKNOWLEDGMENT This paper has been partially supported by grants Fondecyt #1000866 y #1000940, and the Facultad de Ciencias Físicas y Matemáticas de la Universidad de Chile. REFERENCES [1] Rudnick H., Soto M., Palma R.: "Use of System Approaches for Transmission Open Access Pricing", Electrical Power and Energy Systems, ELSEVIER, N° 21, 1999, pp. 125-
135. [2] Einhorn, M., A.: “From Regulation to Competition: New Frontiers in Electricity Markets", Kluwer Academic Publishers, ISBN: 0-7923-9456-9, 1994. [3] Flatabo, N.: “Liberalisation of the Electricity Sector in the Nordic Countries", EES-UETP Course on Electricity Markets Fundamentals and International Experiences, Porto, Portugal, Oct. 1998. [4] Europäisches Parlament und Rat der EG: “Richtlinie 96/92/EG des Europäischen Parlaments und Rates vom 19.02.1996 betreffend gemeinsame Vorschriften für den Elektrizitätsbinnenmarkt" Amtsblatt der Europäischen Gemeinschaften, 40. Jahrgang, Nr. L27/20 , 30. Jan. 1997. [5] State of California Public Utilities Commission, "Proposed policy decision adopting a preferred industry structure", May 24, 1995. [6] Federal Energy Regulatory Commission: “Final Order 888: Promoting Wholesale Competition Through Open Access NonDiscriminatory Transmission Services by Public Utilities", FERC, United States of America, 24. April 1996. [7] Casazza, J., A., Eunson, E., M., Manzoni, G., Schwarz, J., Stam, E.: “Challenges for Power System Planners and Operators due to Changing Institutional Arrangements - Special Report", CIGRE, Session Paris, 1996. [8] Hao, S., “A Study of Basic Bidding Startegy in Clearing Pricing Auctions”, IEEE Transactions on Power Systems, Vol 15, Nº 3, Aug. 2000, pp. 975-980. [9] Wen, F. And David, K., “Optimal Bidding Strategies and Modeling of Imperfect Information Among Competitive Generators”, IEEE Transactions on Power Systems, Vol 16, Nº 1, Feb. 2001, pp. 15-21. [10] Lamont, J. And Rajan, S., “Strategic Bidding in an Energy Brokerage”, IEEE Transactions on Power Systems, Vol 12, Nº 4, Nov. 1997, pp. 1729-1733. [11] Hogan, W., W.: “Coordination for Competition in the Electricity Market – A Contract Network Approach”, Harvard University, Public Policies Toward Competition in the Electric Power Industry, Wisconsin Public Utility Institute, Octubre 1994. [12] Alvey, T., Goodwin, D., Ma, X., Streiffert, D., Sun, D.:"A Security-Constrained Bid-Clearing System for the new Zealand Wholesale Electricity Market", IEEE Transaction on Power Systems, Vol. 13, No. 2, Mayo 1998. [13] Fernández González, J.L., Lloréns Casado, M.L. y Crespo, M. F., “Transmission Constraints Solution and Ancillary Services management in an Open Market Framework. Main Results of a Two Years’ Operational Experience in Spain“, Paper 37/38/39-105, Cigre Conference, Paris, 2000. [14] CNE: "Nueva Ley General de Servicios Eléctricos" (in spanish), Septiembre, 2000, available at http://www.cne.cl. [15] Alvarado, F., “Market Power: A Dynamic definition”, http: //www.pserc.wisc.edu/index_publications.html.
APENDIX A. Strategic bidding is set up as a piece wise linear function with four steps. In Table 8 the biddings of Utility 3 are presented. All other competitors maintain their bids.
Table 8. Strategic Bidding Caso 2 Hora 1-8 Hora 9-24 Caso 3 Hora 1-8 Hora 9-19 Hra 20-24
P1 8 12
T1 E1 600 600 T1
P1
E1
8 15 15
600 600 600 T1
T2 P2 E2 20 900 25 900 T2
P3 25 30
P2
P3
E2
T3 E3 1067 1067 T3 E3
15 900 25 900 30 900 T2
20 30 35
1067 1067 1067
14 100 0 25 700 30 900 T2
20
1067
30 35
1067 1067
T3
Caso 4 Hora 1-8
5
600
Hora 9-19 Hra 20-24
15 15
600 600 T1
Caso 5 Hora 1 Hora 2-7 Hora 8 Hora 9 Hra 10-16 Hra 16-23
P1
E1
10 10 10 10 10 10
600 600 600 600 600 600 T1
Caso 6 Hora 1 Hora 2-7 Hora 8 Hora 9 Hra 10-16 Hra 16-23
P1
E1
10 10 10 15 15 10
600 600 600 600 600 600 T1
Caso 7 Hora 1 Hora 2 Hora 3-9 Hra 10-24
P1
E1
30 25 20 10
600 600 550 600 T1
Caso 8 Hora 1-5 Hora 6 Hora 7-9 Hra 10-24
P1
E1
30 10 10 10
600 600 600 600 T1
Caso 9 Hora 1 Hora 2-5 Hora 6 Hora 7-8 Hora 9-24
P1
E1
10 25 25 30 10
600 600 500 800 600 T1
Caso 10 Hora 1 Hora 2-5 Hora 6 Hora 7-8 Hora 9-24
P1
E1
10 25 25 30 10
600 600 500 800 600
P2
E2
15 900 20 900 15 900 25 900 25 700 20 900 T2 P2
E2
15 650 20 900 15 700 25 650 20 700 20 900 T2 P2
E2
35 700 15 900 15 900 20 900 T2 P2
E2
35 700 15 900 15 900 20 900 T2 P2
E2
20 700 28 650 30 700 33 900 20 900 T2 P2 20 28 30 33 20
E2 900 650 700 900 900
T3 P3
E3
30 30 30 40 40 25
1067 1067 1067 1067 1067 1067 T3
P3
E3
30 30 30 40 30 25
1067 1067 1067 1067 1067 1067 T3
P3
E3
40 40 25 25
1067 1067 1067 1067 T3
P3
E3
40 40 25 25
1067 1067 1067 1067 T3
P3
E3
40 40 35 35 25
1067 1067 1067 1067 1067 T3
P3 40 40 35 35 25
E3 1067 1067 1067 1067 1067