1
Power-Latency Trade-offs in Virtualized Environments Waltenegus Dargie and Jianjun Wen Chair for Computer Networks, Faculty of Computer Science, Technical University of Dresden 01062 Dresden, Germany Email:
[email protected],
[email protected]
Abstract—The adoption of server virtualization and cloud computing has enabled high flexibility of service execution in the Internet. It also promises the efficient use of resources including power. At present, the cloud infrastructure (physical machines and cloud platforms) and the services employing the infrastructure are managed by independent entities. As a result, it is difficult to jointly configure hardware and software resources, which may introduce significant inefficiency of resource utilization. Often infrastructure providers over provision resources to accommodate a growing demand, but the cost of such inefficiency is gradually being felt by both parties. This paper experimentally examines the effect of system configuration (concurrency) on the power consumption and latency of a video hosting server. We find that the usefulness of concurrency is greatly influenced by the interplay of underlying leased resources and by the interaction of virtual machines with these resources. However, the exact nature of this interplay is difficult to quantitatively establish and, therefore, it is not presented to service providers. Our study encourages the scientific community to pay attention to this aspect and to undertake a more rigorous investigation based on practical observations. Index Terms—Concurrency, parallel programs, power consumption, server power consumption, processor power consumption, virtual machines, latency, performance, virtualized environment
I. I NTRODUCTION As the Internet assumes a significant place in our daily life, coping up with its fast-changing structure as well as contents are becoming formidable challenges. Each year hundreds of exabyte of data are generated, processed and shared and millions of additional servers are installed world wide to accommodate them. According to a recent report by Cisco Global Cloud Index [1], the global data center IP traffic will reach 554 exabyte per month by 2016. In comparison, this has been 146 exabyte per month in 2011. Likewise, the global cloud IP traffic will reach at 355 exabyte per month by 2016 (from 57 exabyte per month in 2011). The corresponding magnitude of workload per installed cloud server will increase by more than twofold by 2016 compared to the workload per installed server in 2011. Likewise, the estimated worldwide server deployment in 2010 was 40 million units [ 2], but additional servers have been steadily deployed since then. The latest figure from the International Data Corporation (IDC) 1 indicates that server unit shipment during the first two quarters 1 http://www.idc.com/getdoc.jsp?containerId=prUS24285213 (last visited November 25, 2013).
of 2013 amounts to 3.9 million. Unfortunately, independent studies reveal that most of these servers are underutilized, typically operating at 30 to 70% of their full capacity [ 3], even though their idle power consumption amounts to 50 60% of their peak power consumption [ 4], [5]. The industry is trying to improve the efficiency of internet computing by deploying highly efficient and highly capable servers as well as software server platforms. For example, the industry is adopting server virtualization [6] and cloud computing [7] to efficiently utilize hardware resources [8]. Virtualization enables to encapsulate Internet applications in virtual “machines” so that multiple virtual machines can share the same hardware resources while each virtual machine operates in a secured and dedicated execution space. Virtual machines can be migrated from one physical machine to another at runtime [9]. The advantage of this feature is twofold. To begin with, virtual machines are not bound to any specific server, so that their owners can change host servers whenever they wish to [10]. Secondly, infrastructure owners can freely decide where and for how long individual virtual machines should execute, so that they can efficiently utilize hardware resources [11]. A substantial body of work exists on the quantitative evaluation of the energy and performance efficiency of hardware and software systems in the cloud environment, even though much of this has been theoretical or limited to simulation or benchmarks. Practical evaluation of real systems is vital for both infrastructure providers and service providers. The former benefit from it because they can understand the power consumption characteristics of the software platforms they host, which in turn leads to the choice of appropriate power management strategies to save power without affecting the operation condition of the software platforms. Similarly, the latter benefit from it because they can understand the resource requirements of their systems and frugally lease and consume resources. In this paper, we experimentally examine the interplay between service configuration at the application level and resource configuration at the hardware level. We employ a transcoder as an Internet application and focus on the concurrent execution of video transcoding. We evaluate the time consumed by the transcoder to process individual as well as batch requests and the power and energy consumption of the server during this time. The remaining part of this paper is organized as follows:
2
In section II, we provide a brief discussion on hardware and software level parallelism in Internet services. In section III, we describe our experiment setting. In section IV, we provide a detail insight into our experiment results and attempt to explain the observations. Finally, in section V, we provide concluding remarks and outline our future work. II. C ONCURRENCY IN I NTERNET S ERVERS Typical Internet servers (such as video hosting applications) process a large number of similar but independent requests from users. When considered separately, the requests can be regarded as simple, but together, they can generate a huge amount of workload on the servers. One of the strategies to ensure scalability is parallelization of computations both at the hardware and software level. At the hardware level, each physical core of a multicore processor has its own digital phase-locked loop and two or more hardware threads (or logical cores). Each hardware thread in turn has its own program counter and a register file, so that it can be individually halted, interrupted or directed to execute a specified process. This type of architecture not only enables to process requests in parallel but also provides highly flexible voltage and frequency scaling for a wide range of workloads, since each core can be scaled or switched-off separately. Likewise, at the software level requests are assigned to separate processes or threads, so that they can be executed in parallel with other requests. In a cloud environment, the applications providing services to users and the infrastructure 2 up on which the applications are executed are not managed by one and the same body. As a result, optimal configuration of both systems at the same time is a difficult task. For service providers, leasing the right amount of resources is critical to achieve business goals and to minimize cost. This decision depends on many aspects including the service type, the anticipated workload, and the quality of service. Even though sufficient knowledge about these aspects is available, the performance of services (as well as the cost of service execution) can still be undermined by the way resources are allocated to services. In this paper, we shall experimentally demonstrate how the quality of service computation can be affected by system configuration, both at the application and cloud level. We argue that resource leasing based on abstract contracts does not ensure the efficient utilization of physical resources; nor does it ensure that the availability of rich resources directly correlates with a high performance (throughput, latency). A. Hardware Threads At the hardware level, Amdahl’s Law 3 [13] is widely employed to measure the improvement in the processing speed of 2 For our case, the infrastructure consists of both the cloud platform and the physical servers. 3 Amdahl’s Law states as follows:
speed − up =
1 1−p+
p n
(1)
where p stands for the fraction of task that can be computed in parallel and n is the number of logical cores. (1 − p) stands to the fraction of work that should be executed sequentially.
multicore processors, but it considers the processor in isolation and does not take the interplay of multiple subsystems into account [14]. In reality, hardware threads share resources which may lead to contention and, as a result, to a reduced speed-up. Unless a service’s workload is predominantly CPU intensive, leasing a large number of virtual cores does not necessarily mean getting a high computational capacity. To determine the appropriate number of virtual nodes, additional data pertaining to memory bandwidth, average memory access latency, and disk drive bandwidth should be made available. B. Software Processes/Threads Most Internet-based applications employ application-level concurrency to handle individual requests. Whether they should employ software threads or processes depends on what is significant for them. A process has a self-contained execution environment (memory space) and effectively isolates a request from all other requests, so that the operation condition of one request (such as crash) does not affect the others. But processes have a large management overhead and require more resources. On the other hand, software threads share the same memory space and managing threads is less expensive. However, individual requests are not processed in isolation. Regardless of the the type of concurrency, applications typically attempt to process a large number of requests in parallel by creating a large number of processes or threads. However, without the knowledge of the underlying infrastructure, concurrency may not improve the application’s performance and, in fact, may increase their resource consumption (including power consumption). In the subsequent sections we shall experimentally demonstrate how this can actually happen. III. E XPERIMENT S ETTING Our physical server is a SuperMicro machine employing a mainboard with four sockets. In each socket an Intel Xeon E54603 CPU (Sandy Bridge, quad core, 2.0 GHz) is installed. Altogether we have 16 physical and 32 logical cores. Moreover, the server has 16 GB main memory, an XFS-formatted 2 TB hard disk with 155 MB/s sustained data rate, and a 10 Gbps Intel network interface card. Because we also employ virtual machines in our experiments, we use KVM 4 in an Ubuntu environment as our hypervisor. We measure power with Yokogawa WT210 digital power analyzers – the devices can measure DC as well as AC power consumption at a rate of 10 Hz and a DC current between 15 μA and 26 A with an accuracy of 0.1%. Our application is a GNU/Linux binary avconv video transcoder that can be accessed via an Apache server. The transcoder receives a batch of requests to transcode video files. These videos are either MP4 or FLV videos. The transcoder converts the videos into AVI format and stores them. For our case, the transcoder receives 1000 requests and for each request it converts a 10 MB MP4 video to AVI format and stores the result on the hard disk. Compared to the time 4 http://www.linux-kvm.org/page/Main_Page.
3
2.5
2
1.5
1
0.5
0 0
In this section we use different metrics to evaluate the service execution latency and the power consumption of our transcoder under different system and resource configurations. The system configuration refers to the number of parallel processes that execute simultaneously to transcode video files. The resource configuration refers to the number of physical and virtual cores the transcoder employed to fulfill its task, which is the processing of 1000 requests to transcode a 10 MB video file.
100
200
300
400
500
600
700
800
900
1000
600
700
800
900
1000
task
8 concurrent 10 7
concurrent 20 concurrent 30
6
time(s)
5
IV. E VALUATION
concurrent 1 concurrent 3 concurrent 5 concurrent 7 concurrent 9
time(s)
required to transcode a video, the memory access latency and the hardware write-latency are small. Each request is handled in a separate process. In our experiments we considered two scenarios. In the first scenario, the applications ran on the actual server without encapsulating it inside a virtual machine. In the second scenario, the application was encapsulated in a virtual machine. For both scenarios, we varied the number of cores the application used and the number of concurrent processes. We considered binding 4, 8, 16, 24, and 32 cores for the application and varied the number of concurrent processes from 1 to 50. For each experiment, we measured the time the application consumed to transcode the individual videos as well as the time it consumed to complete the 1000 tasks. Furthermore, we measured the power consumption of the server during the transcoding of the 1000 videos.
concurrent 40 concurrent 50
4 3 2 1 0 0
100
200
300
400
500
task
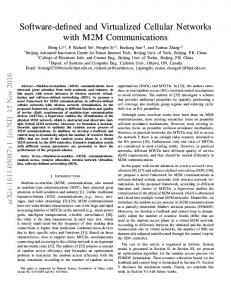
Fig. 1: τi as a function of the number of parallel processes when 4 physical cores were employed by the transcoder.
A. Latency
2.5
2
concurrent 1 concurrent 3 concurrent 5 concurrent 7 concurrent 9
time(s)
1.5
1
0.5
0 0
100
200
300
400
500
600
700
800
900
1000
600
700
800
900
1000
task
8 7 6
concurrent 10 concurrent 20 concurrent 30 concurrent 40 concurrent 50
5
time(s)
We considered the time the server consumed for processing each request (τi ) as well as the entire requests (τ o ). In the first round of experiments, the transcoder was running directly on the physical machine. τ i was minimum when the server processed requests sequentially; it increased consistently as the number of concurrent processes increased, obviously due to contention for shared resources, notably for writing videos on the disk drive. As the number of cores the application binds to increased, τi increased even further, for no obvious reason. Fig. 1 and Fig. 2 display the values of τ i when the transcoder was assigned 4 and 32 physical cores, respectively. Regardless of the number of physical cores available to the transcoder, τi increased with the increment in the number of concurrent processes. On the other hand, τ 0 reduced as the number of concurrency increased, but the gain was conspicuous for up to 10 processes, regardless of the number of physical cores assigned to the application. Then τ 0 tended to increase again, showing no visible correlation with the number of physical cores and concurrency. In the second round of experiments, the transcoder ran on a virtual machine to which was allocated 4 and 8 virtual cores. We conducted the experiment in isolation, i.e., no other virtual machines were running in parallel, to ensure that the resources allocated to the virtual machine were exclusively available for its consumption. Similar to the previous setup, τ i increased as the number of concurrent processes increased (See, for example, Fig. 3). However, compared with the previous setup (when
4 3 2 1 0 0
100
200
300
400
500
task
Fig. 2: τi as a function of the number of parallel processes when 32 physical cores were employed by the transcoder.
4
250
4
4 virtual cores
concurrent 1 3.5
concurrent 3
200
concurrent 5
2.5
concurrent 7 concurrent 9
duration(s)
3
time(s)
2
150
100
1.5 50
1 0 0 1 2 3 4 5 6 7 8 910
0.5
20
30
40
50
concurrent(#) 0 0
100
200
300
400
500
600
700
800
900
1000
250
task
8 virtual cores
14
200
concurrent 10 concurrent 20
duration(s)
12
concurrent 30 10
concurrent 40
time(s)
concurrent 50
150
100
8 50
6
0 0 1 2 3 4 5 6 7 8 910
4
20
30
40
50
concurrent(#) 2
0 0
100
200
300
400
500
600
700
800
900
1000
task
Fig. 5: τo as a function of the number of parallel processes when 4 and 8 virtual cores were employed by the transcoder.
Fig. 3: τi as a function of the number of parallel processes when 4 virtual cores were employed by the transcoder.
the transcoder was running directly on the physical machine), τi nearly tripled for each request in both configurations (for 4 as well as 8 virtual cores). This is understandable since the virtual cores are emulated cores managed by an underlying software monitor, which plays the role of arbitration and requires its own time for this task. Alike the previous case, τo reduced as the number of concurrent processes increased up to 10; unlike the previous case, τ o remained unchanged afterwards. This is interesting, since the performance of the transcoder was more predictable when virtual machines were used, even though the predicted behavior was not necessarily encouraging (τ o nearly doubled when virtual machines were used). B. Power Consumption Similar to latency, the power consumption of the server can best be understood as a random variable. Understanding its characteristics can be useful for (1) avoiding overloading of the power supply system; and (2) estimating the energy consumption of the workload. For (1) we examined the cumulative distribution function (CDF) of the instantaneous power consumed by the server when processing the individual requests and, for (2), we examined the average power per request for each configuration (i.e., by varying both the number of concurrent processes and the number of allocated cores). Fig. 6 displays the CDF of the power consumed by the server when the transcoder was directly running on the physical machine. We chose parallel processes 1, 7, 30, and 40 for discussion to make the observation more visible. First of all, we could observe a noticeable variation in the power consumption due to the soft deactivation of some of the physical cores (We were not able to electrically switching off the physical cores because this function was not available
for us). Still, the server’s power consumption varied between approximately 168 and 230 W when the transcoder was employing 4 cores, but it stayed in the neighborhood of 200 W much of the time when the transcoder employed all the 32 cores. Additional power could have been saved if the idle cores were physically turned off. Secondly, concurrency influenced the instantaneous power consumption when the transcoder was employing few physical cores (4 and 8), but as the number of employed cores increased, concurrency had little impact on the instantaneous power consumption of the server. The instantaneous power consumption of the server increased slightly when virtual machines were used. However, its characteristic was less affected by concurrency in this case. Fig. 7 displays the CDF of the server’s instantaneous power consumption when the transcoder was executing on a virtual machine, binding 4 and 8 virtual cores. This can be due to the cost of virtual machine monitoring, which continuously ran at the background and added its own share to the overall power consumption of the server. Another measure of the impact of server/service configuration on the power consumption of the server is the average power consumed to complete the batch workload. The average power consumption was higher when the transcoder directly employed 4 and 32 physical cores and always lesser when it employed 24 physical cores. Furthermore, the average power decreased as the number of processes increased up to ten and then it increased for up to 30 processes. Then its characteristic became more unpredictable (random). For the virtual machines, the average power decreased as a function of concurrency for up to 20 virtual cores in both configurations (4 and 8 virtual cores) and remained, by and large, the same for a higher magnitude of concurrency. Compared to the direct binding of the physical cores, the server consumed less power when a virtual machine was used.
5
86
86 16 physical cores 85
84
84
83
83
duration(s)
duration(s)
8 physical cores 85
82
82
81
81
80
80
79
79
78 0 1 2 3 4 5 6 7 8 910
20
30
40
78 0 1 2 3 4 5 6 7 8 910
50
20
concurrent(#)
30
40
86
86 24 physical cores
32 physical cores
85
85
84
84
83
83
duration(s)
duration(s)
50
concurrent(#)
82
82
81
81
80
80
79
79
78 0 1 2 3 4 5 6 7 8 910
20
30
40
78 0 1 2 3 4 5 6 7 8 910
50
20
concurrent(#)
30
40
50
concurrent(#)
1
1
0.9
0.9
0.8
0.8
0.7
0.7
0.6
0.6
CDF
CDF
Fig. 4: τo as a function of the number of parallel processes when 8, 16, 24, and 32 physical cores were employed by the transcoder.
0.5 0.4
0.4
0.3
0.3 concurrence=1 concurrence=7 concurrence=30 concurrence=40
0.2 0.1 0 160
0.5
170
180
190
200
210
220
concurrence=1 concurrence=7 concurrence=30 concurrence=40
0.2 0.1 0 160
230
170
180
190
1
1
0.9
0.9
0.8
0.8
0.7
0.7
0.6
0.6
0.5 0.4
210
220
230
240
0.5 0.4
0.3
0.3 concurrence=1 concurrence=7 concurrence=30 concurrence=40
0.2 0.1 0 160
200
power(W)
CDF
CDF
power(W)
180
200
220
240
260
concurrence=1 concurrence=7 concurrence=30 concurrence=40
0.2 0.1
280
power(W)
0 160
180
200
220
240
260
280
300
320
340
power(W)
Fig. 6: The CDF of the server’s power consumption during the transcoding of 1000 10 MB videos with 8, 16, 24, and 32 physical cores.
This should be understood in context, however. As can be seen from Fig. 5, the time the transcoder consumed to complete the batch task (τo ) nearly tripled when virtual machines were employed. This means that the server was computing at a much slower speed as a result of which it consumed less power. The energy consumption of the server, which is a function of both power and latency, is a better quantity to evaluate the relationship between virtualization and concurrency. C. Energy Consumption The energy consumption of the server when the transcoder ran on the physical machine first tended to decrease as the number of parallel processes increased, but once this number
went beyond 10, it steadily increased until it reached 30 for all the physical configurations. Then the characteristic becomes unpredictable. Interestingly, the server consumed more energy when it employed less physical cores, even though the power consumption during this time was lower because more physical cores were isolated. Obviously, a large τ o when the transcoder was employing 4 and 8 cores contributed to the higher energy consumption. V. C ONCLUSION Service virtualization and cloud computing promise flexible and resource efficient computing. Flexibility is possible for both the service provider and the infrastructure provider.
1
1
0.9
0.9
0.8
0.8
0.7
0.7
0.6
0.6
CDF
CDF
6
0.5 0.4
0.4
0.3
0.3 concurrence=1 concurrence=7 concurrence=30 concurrence=40
0.2 0.1 0 160
0.5
170
180
190
200
210
220
230
concurrence=1 concurrence=7 concurrence=30 concurrence=40
0.2 0.1
240
power(W)
0 160
170
180
190
200
210
220
230
240
250
power(W)
Fig. 7: The CDF of the server’s power consumption during the transcoding of 1000 10 MB videos with 4 and 8 virtual cores.
Service providers are free to migrate their applications encapsulated in virtual machines away from one provider to another provider at anytime they wish, ideally at runtime (without stopping from providing service), while infrastructure providers can freely migrate virtual machines from one machine to another to optimize resource utilization. So far, however, jointly configuring services and service execution platforms is a difficult task, partly because these two entities are managed by two independent owners. This paper experimentally examined the impact of this situation on the latency of service execution and the energy consumption of a server. Often service providers lease computing resources (CPU nodes, storage size, memory size, communication bandwidth, etc.) based on their anticipated workload and the quality of service they aim to achieve and configure their applications accordingly. We have showed that higher-level knowledge of leased resources alone is not sufficient to fully utilize resources and to minimize execution cost. We focused on applicationlevel concurrency in a video transcoding application, because almost all Internet-based services employ concurrency to speed up service execution. We showed that concurrency indeed improved latency and, in fact, reduced energy consumption, but as the number of concurrent processes increased beyond a certain amount, concurrency was inefficient. In a virtualized environment, the contribution of concurrency was limited beyond a certain amount, depending on the number of virtual cores the virtual machines are allocated. Admittedly, we have observed several phenomena which we could not sufficiently explain (for example, the energy consumption of our server increased as the number of concurrent processes increased from approximately 10 to 30 for all the physical cores we considered, but it decreased as the number of processes increased beyond 30), partly for lack of sufficient statistics. In future, we aim to undertake more elaborate experiments to address some of the open issues. We also encourage the scientific community to join us in this endeavor. ACKNOWLEDGEMENT This work has been partially funded by the German Research Foundation (DFG) under project agreement: SFB 912/1 2011. R EFERENCES [1] Cisco Inc., “Cisco global cloud index: Forecast and methodology, 2011–2016,” 2012.
[2] R. Dreslinski, M. Wieckowski, D. Blaauw, D. Sylvester, and T. Mudge, “Near-Threshold Computing: Reclaiming Moore’s Law Through Energy Efficient Integrated Circuits,” Proceedings of the IEEE, vol. 98, pp. 253– 266, Feb. 2010. [3] F. Ahmad and T. N. Vijaykumar, “Joint optimization of idle and cooling power in data centers while maintaining response time,” SIGARCH Comput. Archit. News, vol. 38, pp. 243–256, Mar. 2010. [4] W. Dargie, “Analysis of the power consumption of a multimedia server under different DVFS policies,” in The 5th International Conference on Cloud Computing (IEEE Cloud 2012), (Honolulu), pp. 24–29, IEEE Computer Society, 2012. [5] W. Dargie, A. Strunk, and A. Schill, “Energy-aware service execution,” 2011 IEEE 36th Conference on Local Computer Networks, pp. 1064– 1071, Oct. 2011. [6] M. Steinder, I. Whalley, D. Carrera, I. Gaweda, and D. Chess, “Server virtualization in autonomic management of heterogeneous workloads,” in Integrated Network Management, 2007. IM ’07. 10th IFIP/IEEE International Symposium on, pp. 139–148, 2007. [7] M. Armbrust, A. Fox, R. Griffith, A. D. Joseph, R. Katz, A. Konwinski, G. Lee, D. Patterson, A. Rabkin, I. Stoica, and M. Zaharia, “A view of cloud computing,” Commun. ACM, vol. 53, pp. 50–58, Apr. 2010. [8] C. Möbius, W. Dargie, and A. Schill, “Power Consumption Estimation Models for Processors, Virtual Machines, and Servers,” IEEE Transactions on Parallel and Distributed Systems, pp. 1–1, 2013. [9] A. Strunk, “Costs of Virtual Machine Live Migration: A Survey,” 2012 IEEE Eighth World Congress on Services, pp. 323–329, June 2012. [10] A. Strunk and W. Dargie, “Does Live Migration of Virtual Machines cost Energy?,” in 2013 IEEE 27th International Conference on Advanced Information Networking and Applications (AINA), (Barcelona, Spain), pp. 514–521, 2013. [11] A. Beloglazov and R. Buyya, “Adaptive threshold-based approach for energy-efficient consolidation of virtual machines in cloud data centers,” in Proceedings of the 8th International Workshop on Middleware for Grids, Clouds and e-Science - MGC ’10, (New York, New York, USA), pp. 1–6, ACM Press, 2010. [12] B. Sotomayor, R. S. Montero, I. M. Llorente, and I. Foster, “Capacity leasing in cloud systems using the opennebula engine,” in Workshop on Cloud Computing and its Applications, 2008. [13] G. M. Amdahl, “Validity of the single processor approach to achieving large scale computing capabilities,” in Proceedings of the April 18-20, 1967, Spring Joint Computer Conference, AFIPS ’67 (Spring), (New York, NY, USA), pp. 483–485, ACM, 1967. [14] H. Esmaeilzadeh, E. Blem, R. St. Amant, K. Sankaralingam, and D. Burger, “Dark silicon and the end of multicore scaling,” in Proceedings of the 38th Annual International Symposium on Computer Architecture, ISCA ’11, (New York, NY, USA), pp. 365–376, ACM, 2011.