Power Quality Monitoring Integration into Distribution Automation through the Use of AMR A. Moreno-Muñoz, F. Bellido, D. Oterino and J. J. G. de la Rosa* Universidad de Córdoba. Departamento A.C., Electrónica y T.E. Escuela Politécnica Superior. Campus de Rabanales. E-14071 Córdoba. (Spain). Tel: +35-57-218373. Fax: +35-57-218316. e-mail:
[email protected] *Universidad de Cádiz. Área de Electrónica. Dpto. ISA, TE y Electrónica. Escuela Politécnica Superior Avda. Ramón Puyol, S/N. E-11202-Algeciras-Cádiz, (Spain). Abstract- Power-quality events are of increasing concern for the economy because today’s equipment, particularly computers and automated manufacturing devices, is highly sensitive to such imperfections. With volatile energy rates and a need to control costs, regional agencies and utilities are interested in technologies to meter distribution use and manage utility information. Metering technologies and communications systems have advanced to enable the development of Automated Meter Reading (AMR) Systems. Power Quality is one area where the AMR system can be very valuable. This paper investigates the challenges in the development of distributed power-quality monitoring system. The approach of this paper is divided into metering, data collection, archiving, analysis, and presentation. It also discusses system architecture, implementation, and provides general guidelines in the tailoring of PQ indexes. This paper describes the challenges and lessons learned from this work..
I.
INTRODUCTION
Distribution Automation System (DAS) can be defined as an integrated system that enables an electric utility to remotely monitor, coordinate and operate distribution components, in a real-time mode from remote locations [1],[2]. A DAS continuously controls, monitor and protect the network to avoid unplanned network outages. This covers all the high voltage equipment outside the substation (cables, overhead lines etc.) as well as those inside the substation (circuit breakers, transformers, etc.). The decisions of a DAS, is generally supported by a Distribution management system (DMS). This software provides the control decision utilizing the acquired system information, available through the Supervisory Control and Data Acquisition (SCADA) system [3]. The decision making feature of the distribution automation distinguishes it from the normal SCADA system. In the conventional SCADA system, control decision is supervisory, i.e., the control decision is taken manually on the basis of experience and the available real time data. It is then executed through the Graphical user interface (GUI). On the other hand, computer based control decisions are taken in the DA system and these control decisions are executed in either automatic mode or in semi-automatic mode through human intervention [4]. In recent years, distribution SCADA has begun to provide more system operation information at the lower levels of the distribution system, such as distribution transformers and
978-1-4244-1706-3/08/$25.00 ©2008 IEEE.
fuses. At the customer level, the installation of automated meter reading (AMR) systems has helped utilities to the acquisition of remote consumption data. Nowadays the principal function of AMR is still the traditional ones, involved in customer billing. Using fixed radio networks, telecommunication networks or power line carrier the entire billing process can be automated resulting in savings for the utility. Many utilities and regulators are moving toward timeof-use rates, which charge more for energy use that contributes to the system peak demands. This approach presents more options to the purchase and selling of electricity by the use of Real-Time Pricing (RTP). The RTP correlates the time of day, week, or month when energy is used to actual production costs at those times, making possible incentives for utility customers to shift demand off peak. TABLE I. APPLICATIONS OF AMR SYSTEMS Billing Time of use and real-time energy pricing On demand read Prepaid metering Load Control Load control switches Remote control thermostats Capacitor bank switching
Outage Management Outage detection Outage verification Outage restoration Other Services Distribution automation Demand side management Load forecasting Tamper detection
However, AMR is gaining ground as an effective tool for others emerging functions, as shown the table I. With the addition of customized retail services the electric meter will become a gateway for multiple service providers and enable real time communication between customers and utilities. This could bring more opportunities to fraud detection or direct load management, identifying energy consumption savings and improving Energy-Use Diagnostics. For example, a large night-times load may indicate that equipment is running unnecessarily. Other diagnostics solutions are related to a comparison of energy-use indices (EUIs), such as the amount of kilowatt-hours used per square meter (kWh/m2). EUIs can be compared between similar buildings to determine whether a building is using more energy than it should or can be compared to historical use patterns for the same building to determine whether the building energy use has increased.
Similarly, the load shape can be compared to the occupancy or use schedule of the building to determine whether there is excessive use when the building is unoccupied. Observations in energize trends over time can indicate when energy is being used and whether equipment performance may be deteriorating. At the customer level, the installation of AMR systems could help utilities gain access not only to consumption data, but real-time outage data [5] and power quality (PQ) data. This approach can contribute to the reduction of the cost of the implementation o distribution wide PQ monitoring systems because it is not necessary to contemplate the cost of the instrumentation at actual customer service entrance locations. Again, the information that characterises the PQ levels being experienced by customers could be complemented with the PQ on selected utility distribution feeders by the using of dedicated PQ monitoring devices or Intelligent Electronic Devices (IED) [6], [7]. II. POWER QUALITY Power quality or power disturbances are concerned with deviations of the voltage or current from the ideal singlefrequency sine wave of constant amplitude and frequency. A consistent set of definitions can be found in [8]. The quality of the power supply delivered by utilities varies considerably and depends on a number of external factors. Things like lightning, industrial premises which apply and remove large loads, nonlineal load stresses, inadequate or incorrect wiring and grounding or short circuits caused by animals, branches, vehicular impact and human accidents involving electric lines. Traditional utility measures of service quality and reliability, which focus on the sustained interruption indices such as SAIFI and CAIDI (System Average Interruption Frequency Index and Customer Average Interruption Duration Index respectively), do not capture power-quality perturbations. Because of the short duration of power quality events, residential customers are rarely aware that a power-quality event has taken place. However, in industrial customer they can cause hours of manufacturing downtime. A proper monitoring system that is capable of observing PQ phenomena on a continuous basis is needed since the occurrence of a power disturbance is highly unpredictable. Many utilities presently utilize dedicated PQ monitoring devices on the high and medium voltage stations to detect power quality events. Typically, these devices trigger and capture a waveform based on a voltage or current deviation and record the data to a high capacity memory. While all major events are captured, this often results in excessive data from non-critical events. The engineer must then sort through this data to analyze the power quality disturbance. Manual methods are expensive, time consuming, and error prone. Custom software developed for each site for analyzing data, again, can be very expensive to develop, maintain, and-depending on their underlying architecture-difficult to expand. Thus, choosing a system that has the ability of analyzing, condensing and
interpreting voluminous raw data so that levels can be assessed against limits and can be easily expanded would become the most significant challenge in the power quality monitoring arena. A. Power Quality in DAS PQ disturbances can range from high frequency impulses caused by lightning strikes, to long-term sustained overvoltages resulting from poor voltage regulation. The capabilities of the monitoring device will also influence the choice of which parameters to measure. The development of PQ monitoring in DAS require first of all distinguishing between online and offline analyses. Online analysis is devoted to the incidents that need immediate attention (for example sags or interruptions). The online data analysis can be performed within the instrument itself or immediately upon collection of the information at a central processing location. In order to reduce the data overburden the event should be grouped in categories such as transient, interruption or voltage sag or swell. As exist the possibility of receiving several incident alarm at the same time, it could be necessary the use of some kind of “distribution scoreboard” algorithm that automatically classifies events in rank of importance. This could be done by the use of different criteria, i. e. maximal time duration, maximal magnitude variation or maximal energy variation. On the other hand, the offline power quality analyses the information that usually have been included in a power quality report, for example: • Statistics of the steady-state Variations (voltage level, harmonics, unbalance, or flicker), • Statistics of the Event resulting from incidents (sags, short-interruptions, swells, or transients), • Identification of the likely cause of the power disturbances, • Characterization of the electromagnetic compatibility level of equipments and installation, • Recommendations for cost-effective mitigation and maintenance solutions. In addition, it is necessary a scaled approximation in this reporting activity, differentiating between the detailed local approximation to a global point of view. Thus, the development of systematic procedures for power quality data management supports in general the reporting of distribution power quality surveys: • Customer report (e.g. detailing sufficiently the quality reports, clarifying customer requests, planning of compensation of reactive power, instructions for the use of various equipment), • Distribution network report (e.g. giving simple site indices for all measurement point, for investment plans and management of voltage drops and fluctuations, harmonics and other disturbances), • Utility statistics (e.g. obtaining single indices by combining the local indices, needs to compare with another or for the Energy Market Authority).
In all of the cases the reporting is different for Variations and Events, with Variations site indices being a kind of average and Event site indices being a kind of event count. Finally, data captured across geographically remote locations can be time synchronized down to the millisecond through use of global positioning systems (GPS) and network time protocols (NTP). This synchronization means that the system-wide effect of disturbances affecting the voltage distribution system can be accurately observed and analyzed. III. METHODOLOGY The IEEE P1564 draft 2 proposes a five step procedure that can be adapted for characterizing the PQ perturbations and gives a value to the performance of a distribution power system: First, obtain sampled voltages with a certain sampling rate and resolution. For every event, voltage samples are obtained with a certain sampling rate (samples per second or per cycle) and with a certain resolution determined by the number of bits used to store one voltage sample. Many commercial power quality monitoring instruments have sampling rates of 256 samples per cycle since the majority of PQ events have frequency contents below 5 kHz. Oscillographic data provides the most detailed information for engineering troubleshooting analysis. However, oscillographic data occupies the most memory for storage. Second, calculate event and variations characteristics as a function of time from the sampled voltages. From the sampled voltages one or more characteristics as a function of time are calculated for every recording. If possible, variations characteristics can include RMS voltages, RMS currents, negative- and zero-sequence unbalances, real and reactive power, harmonic distortion levels and individual harmonic components, and so forth. The RMS trending offers a practical compromise for waveform data, because it can be stored periodically and reduce the memory requirements. For threephase event measurements, the three voltages will typically give different characteristics versus time for the three phases. From these three functions additional characteristics need to be obtained. Several methods for this have been proposed. Although the EN-61000-4-30 is mainly based on single-phase measurements, for multi-channel measurements the worst phase is taken for further analysis when calculating singleevent indices, this will be analyzed below. As a complement, the event duration measurement can be started on one channel and terminated on a different channel; this is the method proposed for sags characterization and can be extended to interruptions and swells too. Both procedures reduces the overcounting and can be considered as a “phase aggregation” technique as the ones proposed below. Third, calculate single indices from the event and variations characteristics. In many cases the problem not only is the storage memory of the measuring device but the communication capability to retrieve all the data in the time needed for the analysis. Then, power quality data can be
recalculated and packed into indices that could be gathered and stored by the SCADA system for later viewing by the personnel. This includes voltage sags and swells in magnitudeduration tables, transients’ tables which include maximum voltage, transient durations, and transient frequency, or magnitude-duration scatter plots based on CBEMA, ITIC, or user-specified magnitude-duration curves. In addition, it could be provided statistical analysis of various minimum, average, maximum, standard deviation, count, cumulative probability levels; concretely this is necessary for the harmonic indices. Single indices give the end user an accurate summary of what has occurred on the system for the offline analysis. Fourth, calculate location indices from the single indices measured during a certain period of time. It is pertinent to characterize the location-level power quality performance. This can overcome the data overburden problematic. In addition to use interruption indices such as SAIFI, CAIFI and CAIDI, recently the IEEE PES Task Force on Voltage Sag Indices is recommending a set of indices to aid the assessment of service quality for a particular location. One of the representative indices is the System Average RMS (Variation) Frequency Index, SARFIx. This index represents the average number of specified RMS variation events that occurred over the assessment period per customer served. Another inspired index is the System Average Transient Magnitude Occurrence Rate Index, SATMORIx, which represents the rate of occurrence of sub-cycle transient exhibiting over voltage magnitude greater than the specified threshold level. On the other hand, a single indicator has been proposed for variations, designated power quality factor (PQF), which integrally considers: the voltage and current harmonic levels, the degree of unbalance and the phase displacement factor in the different phases at the fundamental frequency. And fifth, calculate system indices from the location indices for all location within the distribution power system. Indices as the presented above can be calculated for a particular feeder or circuit area of a distribution system. One of the inevitable disadvantages of indices is the inherent loss of information. For each disturbance type, a derived single index can be obtained for the distribution power system by combining the indices for all the measured location; this provides a basic for comparison and trend analysis. A. Aggregation The word “aggregate” literally refers to the collection of units or parts into a mass or whole. In Power quality, an aggregate event is the collection of all measurements associated with a single power system occurrence, and identifying them as one event. For example, a single distribution system fault might result in several measurements as the circuit protection system sequences through predefined operations. The goal is that all of these measurement which results from that impact could be represented as a single one. This is critical for the purpose of computing system performance indices. The aggregate event associated with the fault would summarize all of the associated
measurements into a single set of characteristics (magnitude, duration, etc.).
temporally aggregated measurements by different monitoring locations together.
B. Temporal Aggregation Many customer devices and processes trip or misoperate on the initial sag associated with a fault. Subsequent circuit protection operations would have not caused subsequent misoperations because the process had not yet been restarted. Considering multiple events resulting from the same power system occurrence individually may distort the representation of the true state of the system service quality. Thus, an aggregation period should be chosen relative the timing sequences of protection schemes. The time length chosen for aggregation is arbitrary. A five-minute period concurs with the maximum length of a momentary interruption event defined by the final draft of IEEE P1366. To consider the impact of voltage sags to an industrial load, some utilities have adopted a 15-minute or 30-minute aggregation period. However, a oneminute aggregation time period agrees with the IEEE Std. 1159-1995 definition of the minimum length of a sustained interruption.
IV. ARCHITECTURE OF THE SYSTEM
C. Spatial Aggregation In using spatial aggregation to reduce the number of RMS variation measurements, the temporally aggregated measurements from multiple monitoring instruments are combined into a single measurement. An example on when this has an application is if one is interested in computing RMS variation indices at a single substation that is monitored at multiple buses. Another example of its applicability is when a power provider or end-user monitors a sensitive load at more than one feed or service entrance. The same system event may be measured at one or more monitors. When computing performance indices, it may be desirable to consider all of the
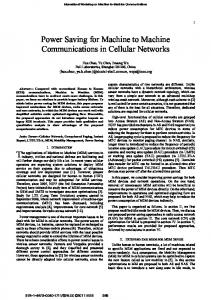
Fig. 1. Communications architecture of the proposed system
Although there has been a considerable amount of work on the characterization of individual types of power quality disturbances and particular locations, there exists no framework that allows one to examine the overall distribution power quality. In view of the foregoing, during last two years has been developed the AVANDIS (Advanced Infrastructure for a more efficient Management of Distribution Networks) project [9]. a pilot infrastructure coordinated to explore the capabilities of global distributed power-quality monitoring system. The distribution PQ monitoring paradigm proposed is inspired and has been designed for power line communication (PLC) based AMR systems, whose deployment is increasing at a very high rate. PLC is a technology that transmits data over a standard power line. The two dominant PLC based AMRs are Power Frequency Communication (PFC) and Ultra Narrow Bandwidth (UNB) technology. PFC involves modulation of the power frequency voltage for outbound (substation to remote meter) communications and power frequency current modulation for inbound (remote meter to substation) communications. If the data from a meter are lost because of a communication failure, the system performs a number of retries until the read is successful. UNB technologies create a very low frequency signal by switching a capacitor at the zero crossing point. By mixing with the 50Hz power signal the receiver at the substation can pick up these low frequency bands. If the data are lost, the transmitter retries to send the data starting from the first bit. As the meter sends the data continuously, the signal loss can be assumed as an outage.
In our system, there is an AMR for each customer and each device communicates by means of PLC with a Data Concentrator (DC) located in upstream transformer center or secondary substation. In rural zones, one DC is connected to 70-80 AMRs because the rural customers are remote to each other. However, in urban zones, the DC will be connected to 150-200 AMRs due to the greater density of customers. Raising a step in the system, each DC will be connected with a SCADA by a public or private IP-based WAN, allowing to control and monitor the lower levels of the distribution network. The software that runs in this SCADA system, which resides in the utility central office, is Titanium. It provides a standards-based web services application, enabling simple integration to Java, .NET, or other web services aware applications and infrastructure from companies such as IBM, BEA Systems, Microsoft, Sun, HP, and Oracle. The figure 1 shows a schematic diagram of the communication system. V. OVERVIEW OF THE APPLICATION The most widely accepted presentation mode of a distribution power system is the substation view. This substation-centric map displays an overview of the electrical distribution system and the status of mayor components comprising each substation. This map may serve as a top-level display in a ‘navigable’ hierarchy of displays. This ‘starting node’ may be called the ‘home display’. A flow chart structure can be used to represent displays as a set of nodes organized hierarchically. These will possibility that the operator understands the structure of the system and develops a coherent mental image of it. Then, electrical system singleline mimics can be hyperlinks, areas that, when clicked,
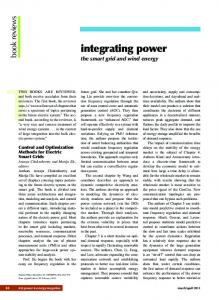
Fig. 2. View of detail of a substation.
redefine the focus by redrawing the localized view to show the connections to the equipment along with analogue measurements or additional information from the SCADA database. At a glance, the operator can learn the names and parameters value of the buses, the transformers, the switching devices and the auxiliary equipment. Each screen should also have a clear title which is short and distinctive. This will help the user maintain an idea of their location within the system. In the lowest hierarchy level, and upon request, tables of raw variable values can be presented over a period of time to check the subsystem status. Revisiting how the system evolved over a particular period can provide insight into the conditions that led up to the event and may yield lessons on how to prevent the event in the future. The menu of the application will display the common power quality information graphically, in time plots or trend lines, voltage and current waveforms of the disturbance, histograms of cumulative probabilities of parameter values, susceptibility curves (such as CBEMA or ITIC), as well as sortable event lists. The menu of the application can also includes a history list of previously visited buses, as well as forward and backward options for traversing the history list. By clicking on the hyperlinks and using the history list, a user can explore subsystems in great detail, discovering its topology, composition, and current status. Also, the scrolling function should be consistent and clearly indicated. In addition, when displays need to be viewed at different level of details the user should be provided with zoom functionality. Furthermore, if there is a particular component of interest, the user can instruct the visualization engine to center the view port about it by specifying its name.
VI. CONCLUSIONS
ACKNOWLEDGMENT
An automatic meter-reading system transmits billing information about customer power consumption from individual electricity meters over the PLC to a central administrative center. AMR does not require utility personnel to gather power consumption data manually from each customer. Electrical utility companies are interested in these technologies because PLC: • Reduces infrastructure cost. PLC systems ride on existing electric utility wires; it eliminates the need to build a new network infrastructure. • Provides better coverage than RF solutions in remote areas. Enables full control from a central point, which reduces overall management costs. • Prevents revenue loss. PLC allows remote monitoring and detects meter tampering; it helps with loss control (i.e., theft prevention) and maintenance of system faults or failures. • Enables integration among different service providers and control of “smart” appliances within the home. • Enables remote monitoring of other sensors (fire, temperature, entry, egress, etc.). • Records daily consumption and expedites financial reconciliation to reduce “read-to-bill” time. • Automates prepayment and account payment. • Enables pay-per-use schemes. Although we can only expect that actual AMRs records de magnitude, the instant and the duration of the occurrence (sag or swell ) with the accuracy of 0.01s, in a near future it would not be too demanding to record current, sag waveform, voltage imbalance, excessive harmonics, real power factor, and other advanced quantities. Tremendous impact can be found on customer satisfaction for others additional automated services like digital messages to customers with specific data on their PQ anomalies and the automated generation of trouble tickets, versus requiring the customer to call in [10]. The open architecture of the DMS makes it possible to integrate the power quality data with the normal network operation and planning processes. Thus, operators can select data subsets for analysis; generate reports for selected data; view data characteristics and plots; define correlation, trend, and histogram plots. There are several advantages to integrated PQ monitoring and analysis systems. A few of these advantages are centralized PQ data of critical feeders and loads, and adequate PQ indices available for standardized evaluation of customer complaints. What is more, this concept enables fast and efficient processing of very large volumes of power quality data, but without the laborious manual retrieval and handling. This contributes to the reduction of system maintenance and improvement in quality service to the customer.
This work was supported in part by the Spanish Ministerio de Industrial, Turismo y Comercio under Grant FIT-03301002005-179. REFERENCES [1]
Stahlkopf, K.and Malcolm, W.(1998). Distribution System Technology for the 21st Century. The Electricity Journal, May 1998. [2] IEEE guide for servicing to equipment sensitive to momentary voltage disturbances. IEEE std. 1250, 1995 [3] IEEE recommended practice for monitoring electric power quality, IEEE Std. 1159, 1995. [4] R. P. Gupta and R. K. Varma (2005). Power distribution automation: present status. Online: http://www.acadjournal.com/2005/v15/part1/p1/ [5] Moreno-Muñoz, A.; Oterino D.; Carmona, A. and de-la-Rosa, J. J. G. (2007). Automated Meter Reading Systems in Outage Management. In: Proceedings of the 5th International Conference-Workshop on Compatibility in Power Electronics, CPE 2007; 1055: 1-4. [6] Gutschow, D.; Kachieng'a, M.O.;(2005). Making business sense of distribution automation systems: the case of Eskom, South Africa. Power Systems, IEEE Transactions on, Volume 20, Issue 1, Feb. 2005 Page(s):272 – 278 [7] Duncan, B.K.; Bailey, B.G.(2004).Protection, metering, monitoring, and control of medium-voltage power systems. Industry Applications, IEEE Transactions on Volume 40, Issue 1, Jan.-Feb. 2004 Page(s):33 – 40. [8] Moreno-Muñoz, A. (2007). Power Quality: Mitigation Technologies in a Distributed Environment. Springer [9] AVANDIS Online: http://www.telvent.com/customers/case_studies/electric/Avandis.pdf [10] Ed Malemezian (2005). AMR is much more than just AMR. Metering. Online: http://www.metering.com/archive/mi_3_2005/42.pdf