Power System Extreme Event Detection: The Vulnerability Frontier. Bernard ... Abstract. In this work we apply graph theoretic tools to ... We present the usefulness of this ... detail in Section 2, the frontier plots the maximum .... cutset, power imbalance pairs that both lie on, and ... For large enough c, the solution will completely.
Proceedings of the 41st Hawaii International Conference on System Sciences - 2008
Power System Extreme Event Detection: The Vulnerability Frontier Bernard C. Lesieutre University of Wisconsin-Madison
Ali Pinar Larwrence Berkeley National Lab Sandip Roy Washington State University
Abstract In this work we apply graph theoretic tools to provide a close bound on a frontier relating the number of line outages in a grid to the power disrupted by the outages. This frontier describes the boundary of a space relating the possible severity of a disturbance in terms of power disruption, from zero to some maximum on the boundary, to the number line outages involved in the event. We present the usefulness of this analysis with a complete analysis of a 30 bus system, and present results for larger systems.
event, and the latter is a measure of its severity. In the study of extreme events, both are important. In this work we introduce a “vulnerability frontier” to simultaneously address these two concerns. As we detail in Section 2, the frontier plots the maximum power imbalance in the system as a function of the number of line outages. There are at least three practical uses for this frontier:
1. Introduction
2.
Electric power systems are operated economically and safely. The least expensive resources are used to supply energy demand, taking into account the exposure of the grid to unanticipated events. In practice, operating procedures are followed to ensure that minimally the network can withstand any single contingency with little effect beyond the location of the disturbance. This well-known “N-1 criterion” is sensible and achievable since all single contingencies may be anticipated in the a priori planning stage. Nevertheless, medium- and large-scale blackout do occur as a result of multiple, near simultaneous events. One challenge in anticipating such events is the limit of computational power to perform an exhaustive brute-force study of possibilities. For example, to consider all 4-line outages in a 20,000 line system requires nearly 4x10¹⁶ scenarios. Such a study is presently beyond the capabilities of the fastest supercomputers. Some judgement must be made to facilitate these types of analyses. It is clear that many outages have little impact and are not important. We suggest that it is useful to consider both the number of line outages involved in an event and the overall impact of the disturbance. The former is a measure of the likelihood (or ease, if malicious) of an
1.
3.
Identification of specific severe disturbances. The points on this frontier correspond to possible events that deserve further study. Compare relative system vulnerability. The frontier depends on system topology and power injections. A comparison of different frontiers corresponding to different conditions may allow relative comparison of system vulnerability to extreme events. Identification of Critical Corridors. The cutsets corresponding to points on the frontier appear in notable patterns. Those occurring in high frequency should be studied to determine if they represent critical corridors.
The development and analysis of the vulnerability frontier evolves from our prior work on power system worst-case studies. In [1,2] we proposed a bilevel optimization formulation for the study of N-k contingency analysis. We pursued a worst-case formulation to identify scenarios that might have the greatest impact. In an initial screening stage we identified the fewest line removals which would necessitate a minimum amount of load shedding to maintain the integrity of the entire grid (or alternatively, the k lines that would require the most load shed). A subsequent stage performed detailed analyses on exhaustive subsets of these lines. That prior work recognized the trade-off between the number of lines and the severity of events. We explored this trade-off in [3], and continue with this paper.
1530-1605/08 $25.00 © 2008 IEEE
1
Proceedings of the 41st Hawaii International Conference on System Sciences - 2008
In [3] we introduced a graph-theoretic approach to relate the number of lines cut to the possible severity of the disturbance. We posed the problem in an optimization framework with a parameter describing the trade-off between lines cut and severity, and we compared three slightly different formulations. For a user-specified value of the trade-off parameters, we found the worst line cuts relative to a severity function. We close this section with a brief discussion of related work in the literature. Multiple contingency identification in power systems has been addressed recently. Salmeron, Wood and Baldick [4] employed a bilevel optimization framework along with mixedinteger linear programming to analyze the security of electric grid under terrorist threat. The critical elements of the grid were identified by maximizing the longterm disruption in the power system operation caused by terrorist attacks based upon limited offensive resources. The bilevel programming framework has also been used by Arroyo and Galiana [5]. We emphasize that we pursue a deterministic, worst-case framework because we would like to anticipate events that include those arising from malicious design. For a probabilistic approach to N-k analysis for naturally occurring events, the reader may consider the stochastic approach proposed in [6]. The static collapse of power systems is closely associated with network topology. Our previous work [1] showed that an approximate power flow description provides a way to relate static collapse with graph partitioning using spectral graph theory. Grijalva and Sauer [7,8] related topological cuts with the static collapse based on branch complex flows. He et. al. [9] used a voltage stability margin index to identify weak locations in a power network. In addition to these largely static analyses, there are many papers that address dynamics of the grid in the context of complex systems and cascading outages. There are different levels of detail of models and the information they provide. Simulations of the most detailed models of the grid tend to be computationally costly and are not amenable to repeated study. Simpler models allow repeated simulation or some direct analysis and may be used to infer some properties of the grid and the risk of cascading outages. In [10,11,12] a long-term model of the grid is used that represents increases in loading and upgrades to equipment in response to events. In the short term, initiating events may cascade as components overload. Simulation of this model reveals failure statistics
consistent with those observed in the power grid. The same authors have also studied probabilistic models with the aim to better understand cascade propogation [13,14,15]. Knowledge of characteristics of cascade propagation may allow and estimation of system vulnerability to an extreme event and help the design of procedures to mitigate cascading outages.
2. The Vulnerability Frontier We define the Vulnerability Frontier as the set of points relating the number lines lost to the maximum amount of power disrupted by their removal. Thus, for a three-line removal scenario, the corresponding point on the frontier is equal to the maximum immediate power imbalance possible for any three-line cut. The network is immediately vulnerable to this amount of imbalance. The necessary calculations to determine the frontier are directly related to graph partitioning problems. To this end we define an indicator vector, x, whose elements equal to {-1,1} separate the system nodes into two groups. The number of lines in the cutset that separates the groups is exactly equal to
x T Lx 4
where L = ATA is the Laplacian matrix and A is the branch-node incidence matrix associated with the network graph. The directed power flowing from one group (xi = 1) to the other group (xi = -1) is
1 T p x 2
where p is a vector of power injections. This is equal to the immediate power imbalance that would be caused by the loss of lines on the cutset. Note that there are 2N-1 ways to group the N nodes of a network, so it is not feasible to consider them all. For the frontier we are only interested in certain worstcase groupings, those equal to the greatest potential power imbalance for every specified number of line outages. Even this reduced set of points is difficult to compute, and it is indeed computationally NP-Hard [16]. Here we offer an algorithm for finding certain cutset, power imbalance pairs that both lie on, and bound the frontier. We pose the following optimization problem:
x T Lx pT x min = −c x ∈{−1,1} 4 2
(1)
2
Proceedings of the 41st Hawaii International Conference on System Sciences - 2008
where c is a trade-off parameter. When c is small, the problems simplifies to a simple minimum cut problem. For large enough c, the solution will completely separate the generators from the loads to achieve the maximum imbalance. For intermediate values for c, as the parameter value tends from 0 to infinity, the solutions are found with an increasing number of cuts and increasing power imbalance. For a fixed value for the trade-off parameters, an exact integer solution for (1) can be efficiently calculated through a conversion to a related min cut/max flow problem [16]. Max-flow/min-cut problems can be solved very efficiently in practice by polynomial-time algorithms (see for instance [6]), which enables repeated solutions of the problem for various trade-off parameters. Our contribution here is to suggest an algorithm to allow the calculation of all solutions to (1) as the parameters varies, and hence calculate all the points that lie on and bound the frontier. The number of points is unknown before the calculation, but it is trivially bounded by the total number of lines in the system and can be expected to be much less.
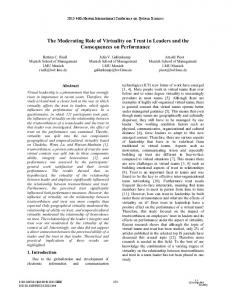
Figure 1. Plot of cost functions for two different groupings as a function of the trade-off parameter c.
Let’s consider how the solution of (1) changes as c increases. For a fixed grouping described by xo the cost function in (1) is a linear function of c. For a different grouping, x∞, the cost will be described by a different line. These lines intersect at a point that separates which of the two solutions has lower cost. This is depicted in Figure 1. As previously noted, there are 2N-1 possible groupings and we can’t consider them all. If we could, we would simply trace along the lowest positioned lines as we increased the value of c. The set of lines in this trace form the solutions of (1) we seek. Instead, we start with two easily found lines that belong to the solution sets: the limiting solutions corresponding to the min cut (small c) and the max power imbalance (large c). Suppose these are the solutions shown in Figure 1. To determine if there are any other solutions for intermediate values of c, we first determine the value, c*, where the lines intersect. Next we solve (1) using this value. If the solution is identical to either of the two existing solutions, then no other solution exists for c in that interval. Otherwise the solution corresponds to a new line. This is shown in Figure 2.
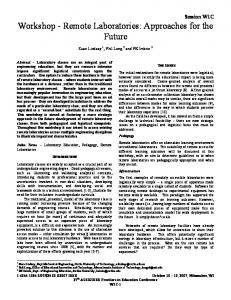
Figure 2. Plot of cost functions for three different groupings. The third grouping comes from the solution of (1) using the parameter value at the intersection of the first two lines. We repeat this process, calculating the intersection of the new line to neighboring lines and calculate new solutions. Note that this process is bounded! The total number of possible solutions is equal to at most the total number of lines in the system and is likely much less.
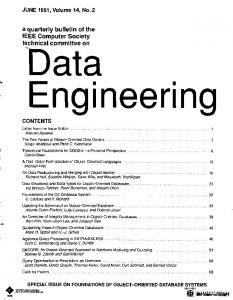
3. Example: 30 bus system Here we consider the 30-bus example shown in Figure 3. The power injections are listed in Table 1. Following the procedure described in the previous section we find the boundary lines (solutions) shown in Figure 4. The complete vulnerability frontier for this
3
Proceedings of the 41st Hawaii International Conference on System Sciences - 2008
100 90
Maximum Imbalance (percent)
network is shown in Figure 5. For this network, the bounding points correspond to cutset sizes 0, 1, 5, 7, 11, and 14. This system is small enough to allow calculation of the entire boundary including those points that lie below the shaded area in Figure 5. These correspond to lines cuts numbering 3, 4, 6, 8, 9, 10, and 12. The points for cuts of size 2 and 13 are not shown because they are identical to the preceding points. That is, there is no 2-line cut solution with greater power imbalance than the 1-line cut solution.
80 70 60 50 40 30 20 10 0
0
2
4
6
8
10
12
14
Lines Cut 2
1 15 4
5 28
7
3
18
14 12
6
8 9
11
13 19
16
20 10
26 22
21
24
23
25 27
29
30
Figure 3. A 30-bus test system.
Figure 4. Trace of minimum objective function along the bounding lines for the 30-bus example.
Figure 5. The Vulnerability Frontier for the 30 bus system. The shaded area connecting points at 0, 1, 5, 7, 11, and 14 bound the frontier. Table 1. Power Injections for the 30-bus system
Bus P Bus P Bus P 1 18 11 0 21 -88 2 96 12 -56 22 158 3 -12 13 210 23 130 4 -38 14 -31 24 -44 5 0 15 -41 25 0 6 0 16 -18 26 -17 7 -114 17 -45 27 210 8 -150 18 -16 28 0 9 0 19 -48 29 -12 10 -29 20 -11 30 -53 In the introduction we mentioned three uses for the vulnerability frontier. First, the points on the boundary represent actual conditions that might occur, and that might warrant further investigation. The first point corresponding to a single line outages is associated with the line connecting the generator at bus 13 to the system through bus 12. This is an obvious vulnerability. The point corresponding to 5 line outages includes this single line outage as well four lines that isolate buses 21-27, 29 and 30. This separates the generator at bus 13 and the three large generators in the lower portion of the grid from the load-rich portion at the top of the grid. These five lines cause an imbalance of 70% of total load. A detailed study using an AC power flow and/or dynamic simulation will likely show that the loss of a subset of these lines can lead to an extreme event. Second, comparison of different operating conditions will alter the vulnerability frontier and allow
4
Proceedings of the 41st Hawaii International Conference on System Sciences - 2008
comparison of relative system vulnerability. We leave this for future investigation. Third, cutsets that appear in solutions on the frontier with high frequency should be investigated further as critical corridors. These are evidently paths over which a high proportion of power flows relative to the number of lines. A more detailed study may be needed to account for other factors including line capacities. In the 12 solutions shown in Figure 5, a number of corridors are identified. The obvious path connecting generator 13 to bus 12 occurs in all 12 solutions. The set of four lines isolating the lower generators discussed above shows up in 9 of the solutions. The four lines separating generators 1 and 2 from the rest of the grid occur in 5 of the solutions. The two lines isolating the peninsular load buses 29 and 30 show up in 5 of the solutions. The single line connecting load bus 26 occurs in four of the solutions. These cuts dominate the solutions. There are only three other cuts that appear in any of the 12 solutions, and only once each.
4. Computational Requirements It is appropriate to comment on the computational benefits of our method, compared to the complete enumeration over all possible partitions. Constructing the vulnerability frontier by complete enumeration involves the analysis of all possible power imbalance scenarios obtained by dividing system nodes into two separate groups. There are 2N-1 possible ways to do this, where N is the number of nodes in the system. In stark contrast, our method for bounding the frontier involves no more than the calculation of M graph partitions, where M is the number of lines in the network. The dominant computation cost is in the graph partitioning algorithm. We used a max-flow implementation described in [17] which scales as O(N3). Other algorithms exist with better scalings, such as Sleator’s and Tarjan’s O(NM/log(N)) algorithm [18]. A history of maximum flow bounds and relevant references is found in [19]
Of course the two approaches do not provide exactly the same information. Our approach yields those points that lie on the frontier and that bound the remaining points. Complete enumeration will provide all points on the frontier (as well as those that do not).
5. Discussion and Summary In this paper we have focused on the calculation for a vulnerability frontier. The points on the frontier represent the immediate power imbalance that is possible for a given number of line removals. These calculations are based on and exploit graph theoretic concepts, and have the advantage of being easily calculable. For a larger example, we present the vulnerability frontier for a 13,374 node system in Figure 6. The graph-theoretic approach does not provide a complete analysis of the actual system response to such disturbance. It is likely that line outages such as those on the frontier will result in a larger disturbance as the system may have difficulty responding to the immediate power imbalance. Dynamic phenomena such as network cascading behavior are not explicitly represented in this stage of our work. The vulnerability frontier can be conceptually expanded to include such analyses in future work. In this paper the maximum immediate power imbalance (vertical axis) is plotted against number of line outages. A useful variant, but more difficult to calculate, is to represent the eventual total power disrupted versus the initial number of line outages. Such a complete answer would require application of simulation based tools to an exhaustive set of initiating and probabilistic cascading events, which presently is not feasible.
While the bound on computational scaling for our approach, O(MN3), is not inconsequential, it is infinitesimal compared to the 2N-1 scenarios considered by complete enumeration. Futhermore, the O(MN3) bound is a worst case bound; significantly lower computational requirements can be expected in practice [17].
5
Proceedings of the 41st Hawaii International Conference on System Sciences - 2008
100
Maximum Imbalance (percent)
90
5. References
80 70 60 50 40 30 20 10 0
0
100
200
300
400
500
600
700
800
900
1000
Lines Cut
Figure 6. Vulnerability Frontier for a 13,374 node system. Our initial observations that the subsets of cutsets appear frequently in conditions corresponding to points on the frontier suggests that these cuts may correspond to critical paths. They are evidently sets of lines that have a large amount of directed power flow. These paths may represent an immediate vulnerabilities to malicious attack, or may represent an intermediate vulnerability if a smaller disturbance were to cascade to remove these paths – a point at which the cascade may become difficult or impossible to mitigate. Our graph theoretic static model is best used at this time as a screening tool. The events and paths identified are useful for directing detailed analysis. Simulating all possible events is not possible, but simulating events suggested from analysis of the vulnerability frontier will likely reveal some system weaknesses. Additionally, while our static formulation focuses on topological and power imbalance features in detail, other important phenomenon are not modeled. At this point we have not included any model of system dynamics. There are substantial theoretical obstacles to extending our approach to incorporate all dynamic concerns. More promising is the inclusion of line flow limits in our model. The present analysis requires a complete physical separation of the grid into two parts through the removal of lines. We recognize than an effective separation can be achieved through the imposition of transmission limits on the remaining lines after a number of other are removed from service. We are pursuing a graph-theoretic line of research to include capacity constraints in our model. This will improve its use as a screening tool as we will still recommend detailed analysis using dynamic models.
[1] Donde, V., V. Lopez, B.C. Lesieutre, A. Pinar, C. Yang, and J. Meza, “Identification of Severe Multiple Contingencies in Electric Power Networks,” proceedings of the North American Power Symposium, Ames, IA, October 2005. [2] Donde, V., V. Lopez, B.C. Lesieutre, A. Pinar, C. Yang, and J. Meza, “Severe Multiple Contingencies Screening in Electric Power Systems,” submitted to the IEEE Transactions on Power Systems. [3] Lesieutre, B.C., S. Roy, V. Donde, and A. Pinar, “Power System Extreme Event Screening using Graph Partitioning,” proceedings of the North American Power Symposium, Carbondale, IL, September 2006. [4] Salmeron, J., K. Wood, and R. Baldick, “Analysis of electric grid security under terrorist threat”, IEEE Transactions on Power Systems, vol. 19, no.2, pp. 905-912, May 2004. [5] Arroyo, J., and F. Galiana, “On the solution of the bilevel programming formulation of the terrorist threat problem,” IEEE transactions on Power Systems, vol.20, n0.2, pp.789-797, May, 2005. [6] Cherkassy, B.V., and A.V. Goldberg, “On implementing the push-relabel method for the maximum-flow problem,” Algorithmica, vol. 19, no. 4, pp. 390-410, 1997. [7] Grjialva, S., and P.W. Sauer, “A Necessary Condition of Power Jacobian Singularity based on Branch Complex Flows,” IEEE Transactions on Circuits and Systems-I: Regular Papers, vol. 52, no. 7, pp. 1406-1413, July, 2005. [8] Grijalva, S., and P.W. Sauer, “Static Collapse and Topological Cuts,” in Proc. 38th Annual Hawaii International Conference on System Sciences, Waikoloa, HI, January 2005. [9] He, T., S. Kolluri, S. Mandal, F. Galvan, and P. Rastgoufard, Applied Mathematics for Restructured Power Systems: Optimization, Control, and Computational Intelligence. New York Springer, 2005, ch. Identification of Weak Locations in Bulk Transmission Systems Using Voltage Stability Margin Index. [10] Dobson, I., B.A. Carreras, V.E. Lynch, and D.E. Newman, “An Initial model for Complex Dynamics in Electric Power System Blackouts,” 34th Hawaii International Conference on System Sciences, Maui, Hawaii, January 2001. [11] Carreras, B.A., V.E. Lynch, M.L. Sactjen, I. Dobson, and D.E. Newman, “Modeling Blackout
6
Proceedings of the 41st Hawaii International Conference on System Sciences - 2008
Dynamics in Power Transmission Networks with Simple Structure,” 34th Hawaii International Conference on System Sciences, Maui, Hawaii, January 2001. [12] Carreras, B.A., V.E. Lynch, I. Dobson, and D.E. Newman, “Dynamics, Criticality, and SelfOrganization in a Model for Blackouts in Power Transmission Systems,” 35th Hawaii International Conference on System Sciences, Hawaii, January 2002. [13] Dobson, I., J Chen, J.S. Thorp, B.A. Carreras, and D.E. Newman, “Examining Criticality of Blackouts in Power System Models with Cascading Events,” 35th Hawaii International Conference on System Sciences, Hawaii, January 2002. [14] Carreras, B.A., V.E. Lynch, I. Dobson, and D.E. Newman, “Dynamical and Probabilistic Approaches to the Study of Blackout Vulnerability of the Power Transmission Grid,” 37th Hawaii International Conference on System Sciences, Hawaii, January 2004. [15] Dobson, I., K.R. Wierzbicki, B.A. Carreras, V.E. Lynch, and D.E. Newman, “An Estimator of Propagation of Cascading Failure,” 39th Hawaii International Conference on System Sciences, Hawaii, January 2006. [16] Pinar, A., Y. Fogel, and B.C. Lesieutre, “The Inhibiting Bisection Problem,” Lawrence Berkeley National Laboratory Technical Report, LBNL62142, December 2006. [17] B. V. Cherkassky and A. V. Goldberg. "On implementing the push-relabel method for the maximum flow problem", Algorithmica, 19(4):390–410, 1997. [18] D.D. Sleator and R.E. Tarjan, A data structure for dynamic trees, J.Comput. Syst. Sci., 26, 362--391, 1983. [19] A.V. Goldberg and S. Rao, "Beyond the flow decomposition Barrier," Journal of ACM, vol. 45, pp. 783--797,1998.
7