SLA, Cloud, Root cause, Monitoring, QoS, Analytics, IaaS, PaaS, SaaS. Abstract: Cloud computing is .... Additionally, it hosts 1 PetaByte of distributed data storage. On top of this, GWDG is ... institutes and advanced customers. They have ad-.
Practical Aspects for Effective Monitoring of SLAs in Cloud Computing and Virtual Platforms Ali Imran Jehangiri1 , Edwin Yaqub1 and Ramin Yahyapour1 1 Gesellschaft
f¨ur wissenschaftliche Datenverarbeitung mbH G¨ottingen (GWDG), Am Faßberg 11, 37077 G¨ottingen, Germany {ali.jehangiri, edwin.yaqub, ramin.yahyapour}@gwdg.de
Keywords:
SLA, Cloud, Root cause, Monitoring, QoS, Analytics, IaaS, PaaS, SaaS
Abstract:
Cloud computing is transforming the software landscape. Software services are increasingly designed in modular and decoupled fashion that communicate over a network and are deployed on the Cloud. Cloud offers three service models namely Infrastructure-as-a-Service (IaaS), Platform-as-a-Service (PaaS), and Softwareas-a-Service (SaaS). Although this allows better management of resources, the Quality of Service (QoS) in dynamically changing environments like Cloud must be legally stipulated as a Service Level Agreement (SLA). This introduces several challenges in the area of SLA enforcement. A key problem is detecting the root cause of performance problems which may lie in hosted service or deployment platforms (PaaS or IaaS), and adjusting resources accordingly. Monitoring and Analytic methods have emerged as promising and inevitable solutions in this context, but require precise real time monitoring data. Towards this goal, we assess practical aspects for effective monitoring of SLA-aware services hosted in Cloud. We present two real-world application scenarios for deriving requirements and present the prototype of our Monitoring and Analytics framework. We claim that this work provides necessary foundations for researching SLA-aware root cause analysis algorithms under realistic setup.
1
INTRODUCTION
Today more and more (monolithic) applications are decomposed into smaller components which are then executed as services on virtualized platforms connected via network communication and orchestrated to deliver the desired functionality. While the foundations for decomposing, executing and orchestrating were well settled over the past decade, allocating the needed resources for and steering the execution of components to deliver the required Quality of Service (QoS) is an active area of research. A critical aspect of steering complex service-based applications on virtualized platforms is effective, non-intrusive, lowfootprint monitoring of key performance indicators at different provisioning tiers typically Infrastructureas-a-Service, Platform-as-a-Service and Software-asa-Service. These key performance indicators are assessed to verify that a Service Level Agreement (SLA) between a customer and a provider is met. Ideally, the assessment goes beyond simply detecting violations of the agreed terms, but tries to predict and pre-empt potential violations. The provider enacts counter-measures to prevent or resolve the violation if
it does occur. Deriving effective counter-measures requires precise monitoring information spanning multiple tiers of the virtualized platform and analysis of monitoring data to identify the root cause(s) of performance problems. Monitoring systems have been used for decades in different computing paradigms. Monitoring solutions for previous computing paradigms pose significant limitations for their widespread adoption in large scale, virtual platforms. The major obstacles with these monitoring techniques are, their high performance overhead, reliability, isolation, limited scalability, reliance on proprietary protocols and technologies. Common performance diagnosis procedures depend on system administrator’s domain knowledge and associated performance best practices. This procedure is labor intensive, error prone, and not feasible for virtual platforms. The prior art on detecting and diagnosing faults in computing systems can be reviewed in (Appleby et al., 2001) (Molenkamp, 2002) (Agarwal et al., 2004) (Chen et al., 2002)(Barham et al., 2003). These methods do not consider virtualization technologies and are inappropriate for rapidly
changing, large scale virtual platforms that by very nature require effective automated techniques for QoS fault diagnosis. Our research motivations are to study the effectiveness and practicality of different techniques for performance problem diagnosis and SLA based resource management of virtual platforms. This is very well applicable to Cloud Computing where efficient monitoring is essential to accomplish these tasks. The remainder of this paper is organized as follows. Section 2 presents scenarios of our interest against which in Section 3, we derive requirements for monitoring and analytics. Based on this, in Section 4, we present our Monitoring and Analytics framework prototype developed as part of the GWDG Cloud Infrastructure. Section 5 describes related work and finally, we conclude the paper in Section 6 with a summary and future plan.
2
PERFORMANCE MANAGEMENT SCENARIOS AT GWDG
The GWDG is a joint data processing institute of the Georg-August-Universit¨at G¨ottingen and Max Planck Society. GWDG offers a wide range of information and communication services. GWDG also owns a state of the art Cloud Infrastructure. The Cloud infrastructure consists of 42 physical servers with a total of 2496 CPU cores and 9.75 Terabytes of RAM. Four of the servers are Fujitsu PY RX200S7 using Intel Xeon E5-2670. Thirty eight of the servers are Dell PowerEdge C6145 using AMD Interlagos Opteron. The raw disk capacity of the servers is 18.55 Terabytes. Additionally, it hosts 1 PetaByte of distributed data storage. On top of this, GWDG is offering “GWDG Compute Cloud” and “GWDG Platform Cloud” services. Currently, a self-service portal provides singleclick provisioning of pre-configured services. In future, agents will be introduced to automatically negotiate SLAs embodying desired qualities of procured services, as outlined in our recent research (Yaqub et al., 2011) (Yaqub et al., 2012). GWDG Cloud service customers are divided in two categories. The first category are small institutes and novice individuals. They require simple off the shelf software services such as WordPress, Moodle, MeidaWiki, etc. These services are served by Platform Cloud which can automatically scale and monitor them. The second category of customers are large institutes and advanced customers. They have additional performance, availability and scalability re-
quirements on top of multi-tier architectures and as a result have much more complex large scale distributed services. This class of customers prefer to only procure VMs with a pre-installed base operating system (OS) from the Compute Cloud. These customers already have IT staff that administer the system, handle support and scalability concerns and do not require support from Cloud provider to manage their services running inside VMs. As part of the motivation for requirement elicitation, we studied two Learning Management Systems (LMS), which are web based environments created especially to support, organize and manage teaching and learning activities of academic institutes.
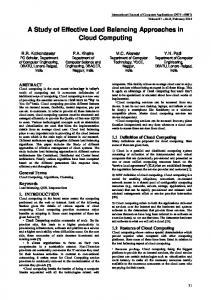
2.1 Scenario 1: LMS on GWDG Platform Cloud Moodle is a free web based LMS. It is a web application written in PHP. A simple Moodle installation comprises the Moodle code executing in a PHPcapable web server, a database managed by MySQL and a file store for uploaded and generated files. All three parts can run on a single server or for scalability, they can be separated on different web-servers, a database server and file server. Moodle is a modular system, structured as an application core and supported by numerous plugins that provide specific functionality. Customers can install Moodle with a single click on the web interface of GWDG Platform Cloud. One of the most important advantages of hosting Moodle on GWDG Platform Cloud is the ability to scale up or down quickly and easily. GWDG Platform Cloud is based on open source, community supported version of RedHat OpenShift Origin PaaS middleware(OpenShift, 2013). It enables application developers and teams to build, test, deploy, and run applications in the Cloud. Users can create applications via command line or IDE client tools. Platform Cloud is a multi-language PaaS that supports a variety of languages and middleware out of the box including Java, Ruby, Python, PHP, Perl, MySQL and PostgreSQL. Platform Cloud is deployed on top of GWDG Compute Cloud and is in its early test phase. Figure 1 depicts the resulting dependencies after hosting Moodle on Platform Cloud.
2.2 Scenario 2: LMS on GWDG Compute Cloud Electronic Work Space (EWS) is another LMS that is used by the University of Dortmund. Teachers and students of the University use EWS to publish information and materials for lectures, seminars and
Figure 1: Scenario 1: Services dependencies.
classes. Currently, there are approximately 30,000 registered users of this service. EWS is a Java EE application deployed in JBoss Application Server (AS). Its structure is highly modular and at Dortmund University, it was tailored to interface with popular phpBB forum and MediaWiki servers. Moreover, to facilitate collaborative editing and management of documents, a WebDAV server was also attached with it. For video streaming, it was interfaced with a dedicated video streaming server from the University of Duisburg-Essen. Information about research projects, lectures and scientists working at the University is managed by another platform called “Lehre Studium Forschung (LSF)”. Students have the possibility to look at the course catalog and register for courses at LSF. Data (participant, room, course description) from LSF is automatically transferred to EWS by a custom middleware (a Java EE application) that is deployed on a separate JBoss AS. Oracle database is used as the content repository. EWS is a complex application and requires multiVM deployment to address scalability, load balancing, and availability requirements. In addition, security and privacy are other main concerns when considering deployment over Cloud infrastructure. For such complex applications, GWDG Compute Cloud
Figure 2: Scenario 2: Services dependencies.
is more suitable where advance customers procure VMs with base OS and some monolithic middleware. Applications running inside these VMs appear as black-box to the Compute Cloud administrators.
The “GWDG Compute Cloud” is a service similar to the well-known commercial IaaS like Amazon EC2. It is especially tailored to the needs of partner institutes. It provides a simplified web interface for provisioning and managing the virtualized resources (VMs, disk, public IPs). The self-service interface allows customers to choose different VM flavors (in terms of available processors, memory and storage) and operating systems. Customers can access their VMs directly from a web browser using the Virtual Network Computing (VNC) protocol. Customers can also attach the public IP address with VMs on the fly. The GWDG Compute Cloud is based upon open source products such as OpenStack, KVM, and Linux. The service is in public test phase and is available to members of the Max Planck Society and the University of G¨ottingen. Figure 2 depicts the resulting dependencies after hosting EWS on Compute Cloud.
2.3 Discussion The key concern for Cloud customers is the availability and performance of SaaS. In scenario 1, we have a hierarchical dependency between SaaS, PaaS and IaaS tiers of Cloud. However, in scenario 2, our LMS application (SaaS) is only dependent on IaaS tier of the Cloud. These dependencies lead to strong correlation between some performance metrics. If customers of LMS are experiencing performance or availability problems, then both Cloud provider and customer needs to find the root cause of the problem in their domain of responsibility. QoS degradation may be due to the internal components of SaaS or the problem could have propagated from lower layers of the Cloud stack. For example, LMS might guarantee to its users that the response time of an HTTP request should be less than 1 second under a fixed request invocation rate. If users experience response time greater than 1 second, then possible cause could lie in the customer domain, e.g., invocation rate is increased or the network between web server and database is congested, etc., but the problem could also lie in PaaS domain, e.g., due to a slow DNS server, contention of resources caused by collocated applications. The problem could even lie in the IaaS domain for instance, due to a malfunctioning virtual network or contention of resources due to collocated VMs, etc. Therefore, service providers need an Analytics module to pinpoint the component/tier responsible for QoS degradation. Analytics module process monitoring data from a wide set of components/tiers involved in service delivery. It is vital to determine a clear ownership of responsibility when problems occur. In real world complex scenarios as the ones mentioned above, this is a very challenging task. Scenario 1 incorporates infrastructure, platform and software service tiers. Our experience shows that all the components from these tiers need to be monitored. Although in scenario 2, we only have SaaS and IaaS tiers, but monitoring is still difficult as the SaaS tier is highly complex and appears only as a black-box to the IaaS tier. In the given context, we identify three challenging problems that we address in this work. These are: 1. Complexity: Usually the environment to monitor is highly complex due to the complicated nature of service delivery tiers and hosted applications. 2. Monitoring Isolation and Heterogeneity: Cloud tiers are best monitored by separate monitoring technologies that should work in isolated but complementary fashion. 3. Scalability: Monitoring parameters grow exponentially to the number of applications and ele-
ments belonging to the Cloud tiers. Hence, scalability of monitoring approaches is of prime concern as well as the method to deploy them automatically.
3
REQUIREMENTS
In the following, requirements derived from the presented scenarios and general considerations from the literature (Ejarque et al., 2011) (Jeune et al., 2012) (Aceto et al., 2012) (Hasselmeyer and D’Heureuse, 2010) are generalised. These requirements have a generic applicability where a Software-as-a-Service (SaaS), e.g., Learning Management System (LMS) is based upon Platform-as-a-Service (PaaS) or Infrastructure-as-a-Service (IaaS) tier. We believe that a thorough understanding of these requirements provides solid foundations for an effective Monitoring and Analytics solution for virtual platforms and Cloud Computing.
3.1 Monitoring Framework (MF) Requirements M1. Scalability: The MF should be scalable i.e. it can cope with a large number of monitoring data collectors. This requirement is very important in Cloud Computing scenarios due to a large number of parameters to be monitored for potentially large amount of services and elements of Cloud tiers that may grow elastically. M2. Heterogeneous data: The MF should consider a heterogeneous group of metrics. The MF must allow the collection of service level runtime monitoring data, virtual IT-infrastructure monitoring data (e.g., VM level runtime monitoring), and fine-grained physical IT-infrastructure monitoring data (e.g., network links, computing and storage resources). M3. Polling Interval: The data collection mechanism must allow the dynamic customization of the polling interval. Dynamic nature of virtual platforms demands gathering of data in a sufficiently frequent manner, meaning that nodes should be monitored continuously. Naturally, smaller polling intervals introduce significant processing overhead inside nodes themselves. However, long polling intervals do not provide a clear picture of the monitored components. Therefore, an optimal trade-off between polling interval and processing overhead is required. M4. Relationship: In the above mentioned scenario, clusters of VMs and Physical Machines (PM) serve many kinds of applications, so there is a hierarchical relationship between applications, VMs and PMs.
There is also a possibility of migration of VMs and applications from one node to another, so relationships can be changed dynamically. The metric’s value must be tagged to show that they belong to a particular instance (e.g., application), and what is their relation to other instances (e.g., VM and PM). M5. Data Repository: The MF requires a data repository where raw monitoring data needs to be stored after collection. The original data set must be stored without down-sampling for auditing purposes. The stored, raw monitoring data can be retrieved by consumers to perform QoS fault diagnosis, SLA validation, plot rendering, and as an input for fine grained resource management. The database must be distributed in order to avoid single point of failure. Moreover, it must be scalable, and allow to store thousands of metrics and potentially billions of data points. M6. Non-Intrusive: The MF must be able to retrieve data non-intrusively from a variety of sources (for VM via libvirt API, for a host via cgroups, for the network via SNMP, for Java applications via JMX, etc.). Collection mechanism should easily be extensible by adding more plugins. M7. Interface: The MF should provide a REST interface that allows access to the current monitoring data in a uniform and easy way, by abstracting the complexity of underlying monitoring systems. A standard unified interface for common management and monitoring tasks can make different virtualization technologies and Cloud providers interoperable. A REST interface is a good choice due to ease of implementation, low overhead and good scalability due to its session-less architecture.
3.2 Analytics Engine (AE) Requirement Collecting monitoring data is essential but not sufficient per se to explain the observed performance of services. In the next phase, we need to analyze and verify data in light of Service Level Agreement (SLA) between a customer and a provider. Ideally, the analysis goes beyond simply detecting violation of agreed terms and predicts potential violations. General requirements for an Analytics Engine (AE) are detailed below. A1. Data Source: AE must be able to fetch monitoring data recorded in the database. Further, it must be able to query the Cloud middlewares (e.g., that of OpenStack and OpenShift) and application APIs to know the current status of the services. A2. Proactive: AE must support the proactive management of resources. Proactive management needs short term and medium term predictions for the evo-
lution of most relevant metrics. A3. Alerts: Certain QoS metrics need to be processed in real time and alerts should be triggered when these QoS metrics are violated or approach certain threshold values. A4. Event Correlation: Detecting the root cause of QoS faults and taking effective counter measures requires monitoring information spanning multiple tiers of the virtualized platforms. Quick incomprehensive analysis of monitoring data of individual tiers does not reveal the root cause(s) of the problem precisely enough. Therefore, Analytics need to exhaustively aggregate runtime data from different sources and consolidate information at a high level of abstraction. A5: Identification of Influential Metrics: Identification of the metrics which strongly influence the QoS helps in decreasing the monitoring footprint and analysis complexity.
4
MONITORING AND ANALYTICS FRAMEWORK PROTOTYPE
Our initial monitoring prototype focused on requirements (M1-M6). We conducted a thorough analysis of technologies to be used by our framework. In deciding upon technology, our criteria included de-facto industry standards that are capable of providing a high degree of flexibility and scalability to our architecture. Figure 3 gives a high level view of our Monitoring and Analytics framework. Our framework uses OpenTSDB(OpenTSDB, 2013) for collecting, aggregating and storing data. OpenTSDB uses the HBase distributed database system in order to persistently store incoming data for hosts and applications. HBase is a highly scaleable database designed to run on a cluster of computers. HBase scales horizontally as one adds more machines to the cluster. OpenTSDB makes data collection linearly scalable by placing the burden of the collection on the hosts being monitored. Each host uses tcollector client side collection library for sending data to OpenTSDB. Tcollector does all of the connection management work of sending data to OpenTSDB and de-duplication of repeated values. We instrumented all OpenStack (OpenStack, 2013) compute nodes with tcollector framework. Compute node specific resource utilization metrics are gathered by collectors those are part of the base package. Our OpenStack environment utilizes KVM as the hypervisor and libvirt for Virtualization management. Libvirt API can provide us monitoring information of hosted VMs. We wrote a custom collector that retrieves data
Figure 3: Monitoring and Analysis framework prototype
non-intrusively for VMs via libvirt API. The system resources and security containers provided by Open Shift are gears and nodes. The nodes run the user applications in contained environments called gears. A gear is a unit of CPU, memory, and disk-space on which application components can run. To enable us to share resources, multiple gears run on a single node. For performance analysis of hosted applications, we want to track and report utilization of gears, where as node utilization is already monitored by OpenStack collector. To track the utilization of gears, we instrumented all nodes of PaaS with tcollector. Linux kernel cgroups are used on OpenShift node hosts to contain application processes and to fairly allocate resources. We wrote a custom collector that retrieves data non-intrusively for gears via cgroups file system. Additionally, monitoring data can be collected from REST APIs of Cloud Services by Service Subscribers component. The Analytics component is based on the ESPER complex event processing (CEP) framework(ESPER, 2013). Analytics component leverages Esper to forecast the evolution of metrics by using Holt-Winters
forecasting. Analytics component implements the SLA surveillance function and the proper alarms are triggered when SLAs get violated. Analytics framework’s listener components retrieve service related events from different APIs. The analytics publisher component sends alerts to SLA Management component for taking corrective measures. Custom dashboard interfaces are developed for GWDG Platform and Compute portals. These dashboards allow end users to view particular metrics of running VMs and applications recorded by OpenTSDB. For plotting data, we used Flot - a plotting library for jQuery JavaScript framework.
5
RELATED WORK
Discussion of related work is divided into areas of Monitoring Systems for Large Scale Cloud Platforms and Root Cause Analysis. Ganglia (Massie, 2004) is a scalable distributed monitoring system for high performance computing
systems. Nagios(Nagios, 2013) is an open source solution to monitor hosts and services (for example HTTP, FTP, etc.) It can monitor more or less everything for which a sensor exists and is extensible through a plug-in mechanism. MonALISA(Stratan et al., 2009) provides a distributed monitoring service based on a scalable dynamic distributed architecture. These systems are designed mainly for monitoring distributed systems and Grids, but do not address the requirements of Cloud monitoring, e.g., elasticity. Elasticity is a fundamental property of Cloud computing and is not considered as a requirement by these systems. As a result these system can not cope with dynamic changes of monitored entities. Moreover, none of these systems provides built-in advanced analytics e.g. complex event processing (CEP), stream processing or machine learning algorithms. Open source Cloud platforms like OpenNebula, OpenStack, Cloud Foundry and OpenShift Origin offer only very basic monitoring, which is not very useful for root cause analysis of performance anomalies. Katsaros et al., presents service-oriented approach for collecting and storing monitoring data from a physical and virtual infrastructure. The proposed solution extends Nagios with a RESTful interface (Katsaros et al., 2011). Rak et al., presents a brief overview of the mOSAIC API, that can be used to build up a custom monitoring system for a given Cloud application (Rak et al., 2011). Aceto et al., provides specific analysis on definitions, issues and future directions for Cloud monitoring (Aceto et al., 2012). Hasselmeyer and D’Heureuse proposes a monitoring infrastructure that was designed with scalability, multi-tenancy, dynamism and simplicity as major design goals (Hasselmeyer and D’Heureuse, 2010). Most of the above mentioned monitoring techniques address one specific functional tier at a time. This makes them inadequate in real world domains, where changes in one tier effect others. Root cause analysis is known throughout the literature. Commercial service management systems like HP OpenView (OpenView, 2013) or IBM Tivoli (Tivoli, 2013) can help in root cause analysis. These tools use expert systems with rules and machine learning techniques. Magpie (Barham et al., 2003) uses machine learning to build a probabilistic model of request behavior moving through the distributed system to analyze system performance. InteMon (Hoke et al., 2006) is an intelligent monitoring system targeting large data centers. It tries to spot correlations and redundancies by using the concept of hidden variables. Gruschke et al., introduces an approach for event correlation that uses a dependency graph to represent correlation knowledge (Gruschke and Others,
1998). Hanemann introduced a hybrid event Correlation Engine that uses a rule-based and case-based reasoner for service fault diagnosis (Hanemann, 2007). These root cause analysis techniques do not consider the Virtualization technologies, therefore would fail to address the challenges of root cause analysis in Virtualized cloud systems. However, there are few recent research efforts exploring root cause analysis issues in virtualized systems like clouds. CloudPD (Sharma et al., 2012) is a fault detection system for shared utility Cloud. It uses a layered online learning approach and pre-computed fault signatures to diagnose anomalies. It uses an end-to-end feedback loop that allows problem remediation to be integrated with cloud steady state management systems. PeerWatch (Kang et al., 2010) utilizes a statistical technique, canonical correlation analysis (CCA), to model the correlation between multiple application instances to detect and localize faults. DAPA(Kang et al., 2012) is an initial prototype of the application performance diagnostic framework, that is able to localize the most suspicious attributes of the virtual machines and physical hosts that are related to the SLA violations. It utilizes Least Angle Regression (LARS) and k-means clustering algorithm for their prototype. PREPARE (Tan et al., 2012) incorporates Tree-Augmented Naive (TAN) Bayesian network for anomaly prediction, learning-based cause inference and predictive prevention actuation to minimize the performance anomaly penalty. Root cause analysis work in context of Cloud Computing is at an early stage. Most existing Cloud monitoring and Analytics techniques address tierspecific issues. These techniques can not deal with real-world scenarios, where changes in one tier often affect other tiers.
6
CONCLUSION AND FUTURE WORKS
In this paper, we presented two real-world application scenarios for deriving requirements and presented the prototype of our Monitoring and Analytics framework. The architecture is designed with Cloud-scale scalability and flexibility as major design goals. We believe that the architecture provides all the desired features for SLA-aware root cause analysis in a Cloud environment. The Analytics component of the framework is under active development. On the research track, our focus is on time series forecasting, feature selection algorithms (O’Hara and Sillanp¨aa¨ , 2009), and fault localization techniques. In near future, we plan to evaluate our algorithms by deploying them in our prototype.
REFERENCES Aceto, G., Botta, A., Donato, W. D., and Pescap`e, A. (2012). Cloud Monitoring: definitions, issues and future directions. In IEEE CLOUDNET 2012. Agarwal, M., Appleby, K., Gupta, M., and Kar, G. (2004). Problem determination using dependency graphs and run-time behavior models. Utility Computing, pages 171–182. Appleby, K., Goldszmidt, G., and Steinder, M. (2001). Yemanja-a layered event correlation engine for multidomain server farms. In Integrated Network Management Proceedings, 2001 IEEE/IFIP International Symposium on, volume 00, pages 329–344. IEEE. Barham, P., Isaacs, R., and Mortier, R. (2003). Magpie: Online modelling and performance-aware systems. In In Proceedings of the Ninth Workshop on Hot Topics in Operating Systems. Chen, M., Kiciman, E., and Fratkin, E. (2002). Pinpoint: Problem determination in large, dynamic internet services. In In Proc. 2002 Intl. Conf. on Dependable Systems and Networks. Ejarque, J., Fit´o, J. O., Katsaros, G., Luis, J., and Martinez, P. (2011). OPTIMIS Deliverable Requirements Analysis ( M16 ). Technical report, NTUA, ATOS, SCAI, SAP, BT, CITY, LUH, 451G, FLEXIANT, ULEEDS. ESPER (2013). Home page of esper. http://esper. codehaus.org/index.html. [Online; accessed 26March-2013]. Gruschke, B. and Others (1998). Integrated event management: Event correlation using dependency graphs. In Proceedings of the 9th IFIP/IEEE International Workshop on Distributed Systems: Operations & Management (DSOM 98), pages 130–141. Hanemann, A. (2007). Automated IT Service Fault Diagnosis Based on Event Correlation Techniques. PhD thesis. Hasselmeyer, P. and D’Heureuse, N. (2010). Towards holistic multi-tenant monitoring for virtual data centers. 2010 IEEE/IFIP Network Operations and Management Symposium Workshops, pages 350–356. Hoke, E., Sun, J., Strunk, J., and Ganger, G. (2006). InteMon: continuous mining of sensor data in large-scale self-infrastructures. ACM SIGOPS Operating Systems Review, 40(3):38–44. Jeune, G. L., Garc´ıa, E., Perib´an˜ ez, J. M., and Mu˜noz, H. (2012). 4CaaSt Scientific and Technical Report D5.1.1. Technical report, Seventh Framework Programme. Kang, H., Chen, H., and Jiang, G. (2010). PeerWatch: a fault detection and diagnosis tool for virtualized consolidation systems. In Proceedings of the 7th international conference on Autonomic computing, pages 119–128. Kang, H., Zhu, X., and Wong, J. (2012). DAPA: diagnosing application performance anomalies for virtualized infrastructures. 2nd USENIX workshop on Hot-ICE. Katsaros, G., K¨ubert, R., and Gallizo, G. (2011). Building a Service-Oriented Monitoring Framework with REST
and Nagios. 2011 IEEE International Conference on Services Computing, 567:426–431. Massie, M. (2004). The ganglia distributed monitoring system: design, implementation, and experience. Parallel Computing, 30(7):817–840. Molenkamp, G. (2002). Diagnosing quality of service faults in distributed applications. Performance, Computing, and Communications Conference, 2002. 21st IEEE International. Nagios (2013). Home page of nagios. http://www. nagios.org/. [Online; accessed 26-March-2013]. O’Hara, R. B. and Sillanp¨aa¨ , M. J. (2009). A review of Bayesian variable selection methods: what, how and which. Bayesian Analysis, 4(1):85–117. OpenShift (2013). Home page of openshift. https:// www.openshift.com/. [Online; accessed 26-March2013]. OpenStack (2013). Home page of openstack. http:// www.openstack.org/. [Online; accessed 26-March2013]. OpenTSDB (2013). Home page of opentsdb. http:// opentsdb.net/. [Online; accessed 26-March-2013]. OpenView (2013). Hp openview — wikipedia, the free encyclopedia. http://en.wikipedia.org/w/index. php?title=HP_OpenView&oldid=547020972. [Online; accessed 26-March-2013]. Rak, M., Venticinque, S., Mhr, T., Echevarria, G., and Esnal, G. (2011). Cloud Application Monitoring: The mOSAIC Approach. 2011 IEEE Third International Conference on Cloud Computing Technology and Science, pages 758–763. Sharma, B., Jayachandran, P., Verma, A., and Das, C. (2012). CloudPD: Problem Determination and Diagnosis in Shared Dynamic Clouds. cse.psu.edu, pages 1–30. Stratan, I. L., Newman, H., Voicu, R., Cirstoiu, C., Grigoras, C., Dobre, C., Muraru, A., Costan, A., Dediu, M., and C. (2009). MONALISA : AN AGENT BASED , DYNAMIC SERVICE SYSTEM TO MONITOR , CONTROL AND OPTIMIZE GRID BASED APPLICATIONS THE DISTRIBUTED SERVICES. Computer Physics Communications, 180:2472–2498. Tan, Y., Nguyen, H., and Shen, Z. (2012). PREPARE: Predictive Performance Anomaly Prevention for Virtualized Cloud Systems. In Distributed Computing Systems (ICDCS), 2012 IEEE 32nd International Conference on, number Vcl. Tivoli (2013). Home page of ibm tivoli. http://www.tivoli.com/. [Online; accessed 26March-2013]. Yaqub, E., Wieder, P., Kotsokalis, C., Mazza, V., Pasquale, L., Rueda, J. L., G´omez, S. G., and Chimeno, A. E. (2011). A generic platform for conducting sla negotiations. In Service Level Agreements for Cloud Computing, pages 187–206. Springer. Yaqub, E., Yahyapour, R., Wieder, P., and Lu, K. (2012). A protocol development framework for sla negotiations in cloud and service computing. In Service Level Agreements for Cloud Computing, pages 1–15. Springer.