KEYWORDS: CRITICAL QUALITY ATTRIBUTES. (CQAS), CRITICAL ...
introduced the quality by design. (QbD) concept. ..... Design for
Biopharmaceuticals. Nat.
B
i o
P
r o c e s s Technical
Practical Considerations for DoE Implementation in Quality By Design Mahesh Shivhare and Graham McCreath
I
t is generally accepted that quality cannot be tested or inspected into a finished product, but rather that quality, safety, and effectiveness must be “designed” and built into a product and its manufacturing process. To encourage new initiatives and provide guidance to pharmaceutical process developers, the International Conference on Harmonisation of Technical Requirements for Registration of Pharmaceuticals for Human Use introduced the quality by design (QbD) concept. ICH-Q8 defines it as “a systematic approach to development that begins with predefined objectives and emphasizes product and process understanding and process control, based on sound science and quality risk management” (1). A typical bioprocess for manufacturing an active pharmaceutical ingredient (API) is
Product Focus: All biologics Process Focus: Manufacturing Who Should Read: Process development, analytical, quality, and regulatory affairs
Keywords: Critical quality attributes (CQAs), critical process parameters, statistical analysis, variation, process optimization, modeling Level: Intermediate 22 BioProcess International
J une 2010
Variability Factors
QbD
Design Software
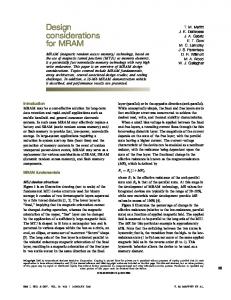
inf luenced by a complicated matrix of input and output parameters, including critical process parameters (CPPs) critical quality attributes (CQAs), as illustrated in Figure 1. Those input parameters may be interlinked or independent of each other. Other sources of variability are changes in raw materials, operators, facilities, and equipment, and it is difficult to understand all their possible permutations and effects on the quality of a final drug product. Consequently, statistical design of experiments (DoE) methods are extensively applied in process design to help process engineers understand the effects of possible multidimensional combinations and interactions of various parameters on final drug
Model Diagnostics
quality (2). Application of a DoE strategy provides scientific understanding of the effects of multiple process parameters and raw material attributes on product CQAs and leads to establishment of a “design space” and manufacturing control strategy.
Design of Experiments
DoE is a structured, organized method for determining the relationships among factors affecting a process and its output (1). It has been suggested that DoE can offer returns that are four to eight times greater than the cost of running the experiments in a fraction of the time that it would take to run one-factor-at-a-time experiments (3). Application of DoE in QbD helps companies
24 BioProcess International
J une 2010
Figure 1: Typical bioprocess with a complicated nest of parameters influencing the final drug product Time
Fermentation Media
Temperature
Stir Rate
Shaker Position
Induction OD
Inoculum
Operator
Volume
Flow Rate
Fermentation
Temperature
Pressure
Separation
Glucose Concentration
CO2 Evolution
Load Concentration
Flow Rate
Column Height
Extraction
O2 Flow Rate
Resin Load Concentration
Bed Height
Flow Rate
Activity
Additives
Refolding
pH
Protein Characteristics
pH
Conductivity
Raw Materials
Buffer Concentration
Purification
Buffer Concentration
Diafiltration
Postload Wash
Flow Rate
Residence Time
Stability Quality
Filtration
pH
Host Cell Proteins
Drug
Cost
Purity
Risk Priority Number (RPN)
Figure 2: Failure mode and effect analysis (FMEA) output
Se
Co
Co
n at
io
n
ltr
io at ltr afi
m lu
m lu
pa Se
Parameters with low RPN scores (low risk parameters)
Fi
#2 n
#1 n
n ra
ti o
Refold
Di
ed
Fe
rm
en
to
r
Pr Fe o d u rm c e n ti o n to r
Parameters with high RPN scores (high risk parameters) need further investigation
Inoculum
Process Stage
Figure 3: Cause-and-effect (fishbone) diagram Wash Load pH Concentration
Conductivity
Bed Height pH Volume Temperature
Flow Rate CV
Temperature Conductivity pH Gradient Slope pH End Buffer Flow Rate Equilibration Start Buffer
Conductivity
Gradient Elution
Column #1
Purity Concentration Yield
Figure 4: Pareto analysis plot 100 300
60
Parameters with Parameters with >90% impact 0.10 resulting from the F-test). The new model, with more or fewer model terms, is again forced through this cycle until all terms included in the model satisfy F-test statistics. Once the appropriateness of those terms and the overall model satisfies an ANOVA check, the next step is to determine what cannot be modeled (errors resulting from the model). This is done using a residual analysis technique (Figure 11). Residuals (model errors) are the difference between the actual response obtained from an experiment and the value predicted by the chosen model. A model is deemed a “good fit” if its residuals are normally and independently distributed with zero mean and constant variance (9). Such distribution can be analyzed graphically, with most statistical packages using three key basic plots: the normal probability plot of residuals, residuals plotted against
Residuals
Residuals
Decreasing trend of residuals suggests that model is not a good fit.
Actual
Experiment Run Order
predicted values, and residuals plotted against experiment run order. A residuals plot that does not satisfy the normal and random distribution criteria signals discrepancy in a selected model, even if it has satisfied the ANOVA test criteria. In this scenario, depending on the spread of residuals, further treatment such as response transformation (e.g., log transformation of a cell count), removal of potential outliers, or further addition and/or removal of model terms will help produce a model that satisfies both ANOVA and residual analysis criteria. Response transformation can be tricky, and it’s best to adopt a transformation based on process knowledge rather than recommended by the statistical package. Similarly, any particular design point should be removed only on the basis of thorough scientific evidence rather than simply discarded as an outlier. Statistical methods coupled with good process knowledge will usually lead to sound conclusions. Once a model is found that satisfies criteria mentioned in the regressive modeling approach, the next step (depending on the model output and nature of a study) is either to characterize the design space or perform the next part of DoE (sequential DoE). Statistical methods do not allow anything to be proved
experimentally, but they do allow measurement of likely errors in a conclusion or attachment of a level of confidence to a given statement (9). So the best practice — especially before characterizing a design space — would be to perform confirmation runs to validate the empirical model resulting from a DoE. Software and Statistical Awareness:
Despite a great push by regulatory authorities to apply DoE techniques in drug development, they haven’t endorsed any of the DoE software packages (to our knowledge), which allows users flexibility in adopting the particular software that fits for their purposes. Chosen software should have an easy-to-use, graphical user interface; complicated programs might put off nonstatisticians and alienate new users. Consider whether a program supports all methods of experimental design (e.g., factorial, one factor at a time, mixture design, response surface design, and Taguchi) and identifies loopholes (e.g., aliases) with an adopted design. Good DoE software helps users follow the regressive modeling approach outlined in Figure 11. It should guide them in carefully choosing model terms on the basis of graphical tools and statistics, and it should verify a model and its significance based on statistics in addition to verifying unaccounted residuals. Graphical tools play a key part in understanding and presenting statistical analysis results, so make sure that they deliver a smart way to diagnose, analyze, predict, and present the results in two and three dimensions. A support mechanism with help files, manuals, training workshops using relevant case studies, and online technical support forms the backbone of a good software package. All these points should also play a critical role in choosing your particular software. Understanding and analyzing data is becoming more necessary in biologics. In today’s strictly regulated business environment and multidisciplinary job market, analyzing data is no longer the domain of statisticians alone. To gain competitive advantage and improve the ability to transform data into
A DoE Protocol Includes . . . Details about the unit operation under investigation, with a list of all parameters that could affect it Justification for including or omitting particular parameters to be investigated (presenting output from FMEA investigation or other risk assessment methodology, cause-and-effect diagram, and Pareto analysis to strengthen the selection/omission of parameters) Ranges and levels of parameters to be investigated in line with the scale of the operation and intended manufacturing facility Design options available for study and rationale for choosing a particular design Details on raw materials to be used (recognizing that raw material lots may also be factors for investigation) A sampling plan and analytical methods to be applied, along with their acceptance criteria Discussion of the scale of experimentation with respect to the final intended scale Review and approval from the team involved (and authorization from the customer if a CMO)
knowledge, it is necessary under the QbD initiative that all members of a team responsible for DoE studies (e.g., technical project leaders, principal scientists, engineers and quality control staff) should be trained in elementary statistical knowledge of DoE. Such training facilitates standardizing an approach throughout an organization, which helps in organizing, sharing, and reporting information. Data Reporting Requirements:
Biologic processes rely on good documentation, not just for regulatory approval, but also to ensure that knowledge captured through DoE studies is made available. For CMOs, detailed technical reports outlining the results and analysis of DoE performed and authorized by reviewers (including customers) keep everyone on the same page. The best practice would be to generate reports at two stages: one at the beginning of experimentation outlying the reason for a particular DoE; the other after performing such an experiment 30 BioProcess International
J une 2010
Design Expert Umetrics
References
Statistica JMP
Minitab Stat-Graphics
detailing its results, analysis, and follow-up. The “Protocol” box lists points to include in a protocol before DoE experimentation. After completion of a DoE study, a detailed report should be produced that includes its resulting responses to be analyzed along with the design matrix chosen for the study. ANOVA tables should justify the parameters and model derived. Graphical outputs should justify the selection of parameters, residual analysis plots to validate the model, and finally present model graphs (effects and interaction plots) for rapid understanding of results. The model should be verified and its design space characterized (or future steps identified based on the results, such as the need for any sequential DoE).
Coping with Inherent Variation
In bioprocess development, variation is part of day-to-day life because of live organisms and biological systems involved. Understanding this variation and designing control systems to adjust a process in response to it will improve the quality, safety, and efficacy of a drug product. This requires a depth of product and process understanding, which can be provided by a DoE method. A systematic application of DoE facilitates the identification of CPPs and their relationship to CQAs, leading to the development of a design space. In combination with quality risk management (QRM) and process analytical technologies (PAT), these help companies maintain good manufacturing control and consistency, ultimately guaranteeing the quality of their drug products.
Acknowledgments
The authors thank Shari Kraber and Wayne Adams (Stat-Ease, Inc.) and Dr. Simon Walker (Avecia Biologics, Ltd.) for useful discussions and input.
1 ICH Q8: Pharmaceutical Development. Fed. Reg. 71(98) 2006; www.ich.org/LOB/ media/MEDIA4986.pdf. 2 Rathore AS, Branning R, Cecchini D. Quality: Design Space for Biotech Products. BioPharm Int. April 2007. 3 Torbeck L, Branning R. QbD: Convincing the Skeptics. BioPharm Int. May 2009: 52–58. 4 Antony J, Kaye M, Frangou A. A Strategic Methodology to the Use of Advanced Statistical Quality Improvement Techniques. The TQM Magazine 10(3) 1998: 169–176. 5 Cook S, Patton KA, Bazemore R. Quality By Design in the CMO Environment. BioPharm Int. December 2007: 28–46. 6 Rathore AS, Winkle H. Quality By Design for Biopharmaceuticals. Nat. Biotechnol. 27(1) 2009: 26–34. 7 ICH Q9: Quality Risk Management. Fed. Reg. 71(106) 2006: 32105–32106; www. ich.org/LOB/media/MEDIA1957.pdf. 8 Kraber S. Eight Ways to Clean an Experiment. AQC World Congress 1998. American Society for Quality: Milwaukee, WI, 1998. 9 Montgomery DC. Design and Analysis of Experiments, Fifth Ed. John Wiley & Sons, Inc.: New York, NY, 2004. 10 Anderson MJ, Whitcomb PJ. DOE Simplified: Practical Tools for Effective Experimentation, Second Ed. Productivity Press: New York, NY, 2007. 11 Wang XGA, Harms J, Rathore AS. Using Statistical Analysis for Setting Process Validation Acceptance Criteria for Biotech Products. J. Biotechnol. Progr. 53, 2007: 55–60. 12 Kirdar AO, Baclaski J, Rathore AS. Application of Multivariate Analysis Toward Biotech Processes: Case Study of a Cell Culture Unit Operation. J. Biotechnol. Progr. 23, 2007: 61–67. 13 Adams W. Replicates vs. Repeats. Webinar Series, 2008. Stat-Ease Inc.: www. statease.com/webinar.html. •
Mahesh Shivhare, PhD, is a nonclinical statistician, and Graham McCreath, PhD, is head of process design at Avecia Biologics Ltd., Belasis Avenue, Billingham, TS23 1YN, United Kingdom; mahesh.
[email protected].