Practicing JUDO: JavaTM Under Dynamic Optimizations Michal Cierniak
Guei-Yuan Lueh
James M. Stichnoth
Intel Corp 2200 Mission College Blvd Santa Clara, CA 95052
[email protected]
Intel Corp 2200 Mission College Blvd Santa Clara, CA 95052
[email protected]
Inktomi Corp 4100 East Third Ave Foster City, CA 94404
[email protected]
either a compatible exception handler is found or the bottom of the stack is reached. Exception handling is expensive because it involves the creation of the exception object, the traversal of the stack, and the search for the compatible exception handler. For applications throwing a large number of exceptions, efficient exception handling is one of the important factors to achieve high performance. The rest of the paper is organized as follows. In Section 2, we present the infrastructure of the compilation model of the MRL VM. In Section 3, we describe the exception model of the MRL VM. In Section 4, we discuss some key optimizations implemented in the optimizer that try to eliminate the run-time overhead statically. In Section 5, we discuss some dynamic techniques that implement exceptions efficiently, generate the GC map lazily, and patch native code to preserve correctness. In Section 6, we present two mechanisms of the compilation model that trigger recompilation. In Section 7, we show the measurements of the effectiveness of the techniques. Finally, in Section 8, we give conclusions.
ABSTRACT 1
A high-performance implementation of a Java Virtual Machine (JVM) consists of efficient implementation of Just-In-Time (JIT) compilation, exception handling, synchronization mechanism, and garbage collection (GC). These components are tightly coupled to achieve high performance. In this paper, we present some static and dynamic techniques implemented in the JIT compilation and exception handling of the Microprocessor Research Lab Virtual Machine (MRL VM), i.e., lazy exceptions, lazy GC mapping, dynamic patching, and bounds checking elimination. Our experiments used IA-32 as the hardware platform, but the optimizations can be generalized to other architectures.
1
INTRODUCTION
A Java compiler compiles Java source code into a verifiably secure and architecture-neutral format, called Java bytecodes. A JVM interprets the bytecodes at run time. In a high-performance implementation of a JVM, a JIT compiler translates Java bytecodes into native code at run time. Since translation is taking place during program execution, the compilation time is now part of the execution time. Contrast this to the traditional methodology of performance measurement, in which compilation time is ignored. As such, it is important for the JIT compiler to be conscious of compilation time. Hence, applying expensive optimizations to all methods is not always justified because not all of the methods are frequently executed. Lightweight optimizations have been shown to be effective and fast in terms of trading code quality for compilation speed [1]. The code quality, however, is sub-optimal due to the lack of intensive compilation analysis, which is extremely important for frequently executed methods. How to trade off code quality vs. compilation time is crucial in the design of a JVM. The Java language [12] provides exceptions as “a clean way to check for errors without cluttering code” [5]. At the point where an error is detected, an exception object is created and thrown. An exception handler can catch exceptions of a specific type. A stack trace containing all frames from the top to the bottom of the stack is constructed. After the object is created, the stack is traversed again starting at the active frame (top of the stack) and proceeding until
2
COMPILATION MODEL
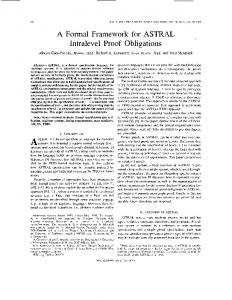
The compilation model of the MRL VM implements a dynamic recompilation mechanism. The key to our approach is to adaptively and selectively perform simple code translation in a timely fashion for cold methods and expensive optimizations solely for hot methods. The main goal is to generate optimized code for those methods whose previously compiled code is considered nonoptimized due to the lack of run-time value information, profiling information or available compilation time. Dynamic recompilation happens at run time and we need to make sure that the time spent on recompilation is paid off by the performance gain obtained from recompilation. Initially, all methods are compiled by a fast code generator that produces reasonably good code. Minimizing compilation time and gathering profiling information are the major concerns at this point, not producing the best code quality. As the program executes, the VM adaptively identifies hot (frequently executed or loop-intensive) methods and performs expensive optimizations to improve code quality. The structure of dynamic recompilation of the MRL VM is similar to the Jalapeño optimizing compiler [7], consisting of three major components: a fast code generator (baseline compiler), an optimizing compiler, and profiling information (as depicted in Figure 1). All methods are compiled to native code by the fast code generator when first invoked. Instrumenting code is inserted into the native code to collect profiling information. As the code is executed, the instrumenting code updates the profiling information. Later, based on the collected profiling data, some methods are identified as hot methods and then recompiled by the optimizing compiler, using the profiling information to guide optimizations. The VM registers the optimized code so that the subsequent invocations of the methods invoke the optimized versions instead of the old
1
All third party trademarks, tradenames, and other brands are the property of their respective owners.
Permission to make digital or hard copies of all or part of this work for personal or classroom use is granted without fee provided that copies are not made or distributed for profit or commercial advantage and that copies bear this notice and the full citation on the first page. To copy otherwise, or republish, to post on servers or to redistribute to lists, requires prior specific permission and/or a fee. PLDI 2000, Vancouver, British Columbia, Canada. Copyright 2000 ACM 1-58113-199-2/00/0006…$5.00.
13
(unoptimized) ones. The previously compiled code, if still referenced by existing stack frames, will be executed when the frames become active. Our current dynamic recompilation is not a staged compilation model [20][11], which performs most expensive analyses statically and postpones some optimizations until run time. In other words, the optimized code will not be considered for recompilation even if the program behavior changes. With the two compilers in the VM, the fast code generator and the optimizing compiler, the VM records the information pertaining to who the producer of the native code of a method is so as to invoke the right compiler to unwind the stack frame as well as report the live references for garbage collection.
Java operand stack. The second pass uses the lazy code selection approach to generate efficient native code and performs some lightweight optimizations (e.g., bounds checking and common subexpression elimination). Instrumenting code is inserted to gather profiling information as well as to trigger recompilation.
2.2
B y te co d e F ast co d e ge n era tor
O ptim izin g co m piler C o u nters
U no ptim ize d na tive
P ro filin g da ta re pre se n ta tio n
O ptim iz ed na tiv e
F igu r e 1 . S tructure of d y na m ic rec o m p ila tio n
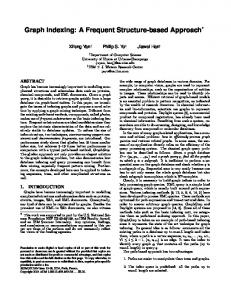
Figure 2 shows some of the relevant internal structure of the MRL VM. Associated with each method is a data structure called METHOD, which consists of name and descriptor of the method, pointer to an exception table, pointer to default native code, and a linked list of JIT information. Prior to recompilation, the default native code points to the unoptimized native code. As soon as the method is recompiled, the default native code is updated to point to the optimized code. Since multiple JIT compilers can exist at the same time, the VM maintains a linked list of JIT_INFO structures containing specific information for the method generated by the JIT compilers. The information is mainly for the purpose of handling exceptions, unwinding stack frames, enumerating the root set for GC, and collecting profile data. For example, the JIT_INFO on the right of Figure 2 is for the fast code generator, consisting of “Native” pointing to the unoptimized native code, and “Method info” pointing to GC mapping and profile data representation.
2.1
Fast code generator
Methods are initially translated into native code by the fast code generator. This approach has been shown to be fast and effective [1]. The main goal here is to produce native code quickly while maintaining reasonable code quality. It takes two passes over the bytecodes with linear time complexity: The first pass collects information such as basic block boundaries and the depth of the METHOD
Name
Optimized native code
Descriptor
...
Fast code generator versus interpreter
One possible implementation of dynamic recompilation is to replace the fast code generator with an interpreter. Namely, methods are interpreted until they are identified as hot [25][21]. The reason that we choose fast code generation instead of interpretation is twofold: • The interpreting approach reduces the compilation time dramatically at the price of performance degradation. The performance gap between interpreting bytecodes and running native code can easily reach orders of magnitude. With such a huge performance gap, it is crucial for the JVM to compile hot methods at the right point because lazy compilation incurs a huge performance loss due to interpreting, and eager compilation may end up compiling a lot of cold methods. The window of the right moment to trigger compilation could be so narrow that it is easily missed. Once the window is missed, the penalty is high. However, the performance gap between the fast code generator and the optimizing compiler is relatively small, around 30%, for computation intensive applications. Therefore, the window for triggering recompilation is wider than the interpreting approach, allowing more flexibility in terms of determining when to recompile. Besides, because the compilation time of the fast code generator is small, saving a small amount of compilation time is not worth a huge performance loss. • Applications running in debugging mode [24] require support from the JIT compilers to inspect the state of the execution of a program (e.g., printing or setting values of variables) and to control the execution (e.g., setting a breakpoint). That is, the compilers need to provide the addresses of variables and the native code offsets of bytecode locations. Providing this information in an optimizing compiler can be complicated because global optimizations and instruction scheduling can cause endangered or nonresident variables [2][3]. Always interpreting the program during debugging may not be acceptable to the users because of slow execution time. Another alternative is for the JVM to dynamically fall back to the interpreting mode on demand for a method compiled by the optimizing compiler when users want to debug the method. This transition process is called deoptimization, which is similar to [15]. The drawback of this approach is that the transition from native code to the interpreter can complicate the design of the JVM because the compiler needs to record the information for deoptimization. The fast code generator does not have the drawbacks of the two previous approaches because the fast code generator does not do any aggressive optimizations that could cause inconsistent run-time values.
Unoptimized native code
Default native Info
JIT_INFO
...
JIT id
Next
Next
... Exception table
Exceptions
Exceptions
Native
Native Method info
Profiling data representation
Profiling data
There are two kinds of locations where the fast code generator instruments code: method entry points and back edges. The former tells if a method is call intensive. The latter indicates if a method is loop intensive. When the optimizing compiler is invoked to recompile a method, the profiling information associated with the method is retrieved to guide optimization decisions such as inlining policies and code layout decisions. How the optimizer makes these decisions based on the profiling information is discussed in Section 4.
... Exception table
Method info
GC map
2.3
JIT_INFO
JIT id
Profile data GC map
Figure 2. Selected data structures of Intel VM
14
2.4
Optimizing Compiler
3
Global optimizations are highly effective in improving the code quality. However, they are expensive in terms of compilation time. We are willing to afford more time to apply global optimization to a method only if the method is identified as hot. The optimizing compiler takes a conventional compilation approach that builds an intermediate representation (IR) and performs global optimizations based on the IR.
Prepass Prepass
CCode ode expansion expansion
IR IR construction construction
Global Globalregister register alloc. alloc.
Inlining Inlining
GC GC support support
class sum { public static void main(String args[]) { sum i = new sum(); i.printSumOfInts(args); } public void printSumOfInts(String strArr[]) { try { int result = sumOfIntsAsStrings(strArr); System.out.println("The sum is " + result); } catch(NumberFormatException e) { System.out.println("Error!"); } } public synchronized int sumOfIntsAsStrings(String strArr[]) { int sum = 0; for(int i = 0; i < strArr.length; i++) sum += Integer.parseInt(strArr[i]); return sum; } }
CCode ode em emission ission
Global Globaloptimization optimization
EXCEPTION MODEL
Consider the following simple, if a bit silly, Java application.
This program interprets command line arguments as integer numbers and prints their sum. The exception mechanism is used to handle arguments that are not valid integers. If such an argument is found, an error message is printed. For illustrative purposes, we have made this program more complicated than necessary. For instance we have declared one of the methods as synchronized, even though there is no need for synchronization in this simple, singlethreaded program. In this example the code of the library method Integer.parseInt (not shown) creates and throws the NumberFormatException when its argument is not a valid integer number. The exception is caught by the handler declared in printSumOfInts and the error condition is handled there. Two points are worth noting: Method sumOfIntsAsStrings is declared as synchronized. That means that a monitor associated with the this object is entered when the method is entered and the monitor must be released when we exit the method. If the exception is thrown, the VM must make sure that the monitor is released as part of the exception throwing process. An exception object contains a stack trace that can be printed at any point, even after some of the stack frames referred to in the trace cease to exist. In our example we could add the following method invocation to the exception handler:
Profiling data Profiling data representation representation
Figure 3. Structure of th e optim izin g com piler
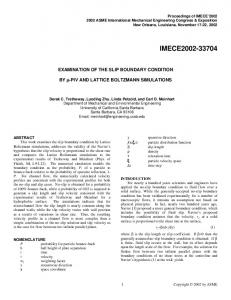
The structure of the optimizing compiler is depicted in Figure 3. There are several major phases. The profile information is used to guide optimization decisions such as inlining policy, where to apply expensive optimizations, and the code layout in code emission. The prepass phase is similar to the one described in [1], which traverses the bytecodes and collects information such as Java operand stack depth and basic block boundaries. The IR construction phase then uses the information to build the control flow graph and IR instruction sequence for each basic block. Local common subexpression elimination across extended basic blocks is done during construction. The inlining phase iterates over each instruction to identify which call sites are inlining candidates. The control flow graph and IR are constructed for the inlined call sites and then merged (grafted) into the caller’s, combined with exception tables. The global optimization phase performs copy propagation, constant folding, dead code elimination [4], bounds checking elimination and limited loop invariant code motion. With only 7 registers in IA32 [16], registers are considered precious resources. Thus, we avoid optimizations that are expensive and more likely to increase register pressure, such as code motion and partial redundancy elimination, because it is hard to justify that the optimizations can provide substantial performance speedup. The conceptual backend of the optimizing compiler starts from the code expansion phase. It expands (lowers) some IR instructions because there is no direct one-to-one mapping from the IR instructions to native instructions. For instance, a 64-bit (long) add instruction is done via two 32-bit instructions, one add and one adc (add with carry). 64-bit shift and division instructions are expanded into run-time calls. For the ease of detecting common subexpressions in the IR construction phase, those instructions are not expanded originally. Expansion facilitates gathering the GC map (liveness of references) because our GC support requires a one-toone mapping relationship between IR and native instructions [22]. Global register allocation assigns physical registers and generates spill code. The GC support phase computes the GC map at every instruction to make every instruction GC-safe. Simple compression techniques are used to reduce the size of the GC map. The code emission phase iterates over the instructions and emits native code and the compressed bit stream of the GC map.
e.printStackTrace();
which might produce the output: java.lang.NumberFormatException: badnumber at java.lang.Integer.parseInt at sum.sumOfIntsAsStrings at sum.printSumOfInts at sum.main if the string “badnumber” were entered as a command line argument to our application. The exact format of the stack trace output is implementation-dependent (Section 20.22.6 of the Java Language Specification [12]). The JVM specification ([19], Section 2.16.1) categorizes exceptions in three groups depending on the cause of the exception: An abnormal execution condition was synchronously detected by the Java VM. A throw statement was executed An asynchronous exception occurred. This classification is important in our work, because exceptions in the second category are more difficult to analyze and the description of lazy throwing of those exceptions is a major part of our paper. For the purpose of this paper, we call those exceptions user
15
exceptions, because they may be created and thrown from user code. By contrast, we will refer to exceptions in the other two groups as VM exceptions, because they are detected and thrown by the JVM.
3.1
caller’s context. This condition always occurs for native methods. The VM is responsible for maintaining a sufficient state to make this possible even though we assume no cooperation from the native code other than following a native interface like the Java Native Interface (JNI). The traversal of the stack is implemented as a loop starting with the context of the frame on the top of the stack and ending at the bottom of the stack in the case of the non-destructive unwind or at the frame with the correct handler for the destructive unwind. The most important operations are the method lookup and frame unwind functions. The method lookup function takes the instruction pointer (IP) as an argument and returns a pointer to JIT_INFO, a structure representing the method and the JIT compiler used to generate this code. JIT_INFO is described in Section 2 and visualized in Figure 2. In our VM every Java method is compiled to a contiguous area of memory. Given that assumption we organize our lookup table as a sorted array of IP ranges (start_IP..end_IP). The method lookup performs a binary search of the table. The frame unwind uses the information generated by the JIT compiler at compile time to unwind the stack frame to the frame belonging to the caller. The unwind process must restore the values of the IP, stack pointer (SP) and callee-saved registers. Note that a Java method may have been recompiled and in that case it is possible that at the same time there exist frames corresponding to the same method compiled by different compilers. Therefore the stack traversal loop must use the appropriate compiler to unwind every frame. This is possible because the JIT_INFO returned by the method lookup represents the method and the compiler used to compile it. The MRL VM uses the value of the IP register to determine if there are handlers registered for this value of the IP and if so whether the thrown exception is an instance of the catch type recorded in the exception table.
Interaction Between the Core VM and the JIT
The MRL VM has a well-defined interface between the core VM and the JIT compiler. There are two parts to the interface: compileand run-time. The compile-time interface is used by the VM to invoke the compiler for a specific method and by the compiler to get information needed to compile the method and to inform the VM what the exception table for the compiled method is. Our VM uses an exception table similar to the one defined by the JVM specification. However, the exception table created by the JIT compiler is expressed in terms of the generated native code and the JIT can add new entries to handle some optimizations (see Section 4.3) and delete some entries as the result of other optimizations. The run-time part of the interface (the JIT runtime) is used by the VM to ask the JIT compiler to perform JIT-dependent tasks: stack unwinding, enumeration of the root set for garbage collection, etc.
3.2
Unwinding Process
At the moment of throwing the exception in our example there are four frames on the stack. At the bottom of the stack is the sum.main method. Then methods printSumOfInts, sumOfIntsAsStrings and Integer.parseInt were invoked. The active frame corresponds to method Integer.parseInt. At this point in the execution an exception of type NumberFormatException is thrown. In general any of the methods on the call stack may have registered a handler compatible with the NumberFormatException type. In our example there is only one such handler, declared in printSumOfInts. A simple VM implementation would create an exception object of type NumberFormatException as soon as the appropriate condition is detected. As part of the exception object creation, a constructor of the object would be invoked. The constructor would create the stack trace and store it in the exception object. A stack trace is constructed in a non-destructive stack traversal. The stack trace contains all frames from the top to the bottom of the stack. After the object is created, the stack would be traversed in a destructive way starting at the active frame (top of the stack) and proceeding until either a compatible exception handler is found or the bottom of the stack is reached. The difference between non-destructive and destructive unwinding is that in the latter case as we unwind to the previous frame, we release various VM resources. After we destructively unwind from a frame, the execution can no longer resume in that context. Resources released by the VM during the destructive unwind include Java monitors (for synchronized methods) and internal VM data structures. In our example, the destructive unwind exits the monitor associated with the execution of the synchronized method sumOfIntsAsStrings. The unwinding process starts with a context of a thread and determines the context of the caller. If the active frame belongs to a Java method compiled by the compiler, the VM calls the compiler runtime to perform the unwind. This arrangement allows great flexibility in the frame layout used by a JIT compiler, because the frame is a “black box” to the VM and a new JIT compiler can be plugged into the core VM without any modifications to the VM. If the active frame does not belong to a Java method compiled by the JIT compilers, the VM uses its internal data structures to find the
4
STATIC OPTMIZATIONS
In this section, we discuss some key optimizations implemented in the optimizer that try to eliminate the run-time overhead statically.
4.1
Class initialization
The JVM Specification ( [19], Section 5.5) requires that a class is initialized at its first active use. The JIT compiler needs to make sure that the class is initialized before a non-constant field declared in the class is used or assigned. We take a simple approach to eliminate checks for class initialization. When building the IR for getstatic and putstatic bytecodes, we call a helper routine provided by the MRL VM to query if the class of the field has been initialized. If the class is not yet initialized at the current compile time, at run time right before the getstatic and putstatic, we check if a class is initialized. If the check fails, that field access is the first active use and the class is initialized.
4.2
Checkcast
A cast conversion must check at run time if the cast cannot be proven correct at compile time ([12], Section 5.5). The compiler generates a run-time helper call for checkcast. There are two methods we use to reduce the run-time overhead for checkcast. First, we use local common subexpression elimination to determine whether the helper call is necessary. As we build the IR for a checkcast bytecode that casts an object x of class A to the resolved type B, we check whether “x instanceof B” is
16
available at this point. In our implementation, we propagate the availability of an instanceof only if the instanceof is used as a control-flow condition. The availability of the instanceof is then propagated along the path on which the result of the instanceof is true. Second, we partially inline the commonly executed path of the helper call so as to eliminate the run-time call overhead along the path.
4.3
4.3.1
Policy
Cloning loops can easily cause a code explosion so the policy of applying bounds checking elimination is based on three parameters: code size, amount of bound checking code that can be potentially eliminated, and profiling information. The optimizing compiler only considers the innermost loops as the scopes for bounds checking elimination. For a given innermost loop, if the ratio of the total number of instructions and the number of candidates is below a certain threshold (which is set to 30 based on our empirical results), this optimization is turned off because eliminating all bounds checking code can only lead to a small percent speedup. The optimizing compiler computes the average trip count of the loop using the profiling information. If the trip count is not greater than 3, the optimization is turned off as well because the performance gain is small.
Bounds checking
The Java language specifies that all array accesses are checked at run time ([12], Section 10.4); an attempt to use an index that is out of bounds causes ArrayIndexOutOfBounds Exception exception to be thrown. The compiler can eliminate bounds checking code if it can prove that the index is always within the correct range. If the compiler cannot prove that, the array reference must include bounds checking code (one unsigned compare and one branch). Bounds checking code can be very expensive for computation-intensive applications that heavily involve arrays. The optimizing compiler performs analysis to figure out the range that an array might access within a loop. If the range is known, the compiler creates a cloned loop and eliminates the bounds checking code for the array accesses by inserting code outside the loop to check if both the lower and the upper limits are within the correct range (as depicted in Figure 4 (b)). If either one of the limit checks fails, the original loop with bounds checking code is executed because the array accesses might cause ArrayIndexOutOfBoundsException to be thrown. For simplicity, we use the notation @(j,arry,label) to indicate the bounds checking code which contains two instructions: “cmp arry.length,j” comparing the index variable j against the length of array arry, and “jbe label” branching to the label if j is greater than or equal to the length of arry. Comparing j against arry’s low limit (zero) is unnecessary because the code sequence also branches to the label when j is negative (below zero). The compiler performs code hoisting for the newly cloned loop to move invariant code out of the loop (e.g., load of a[i]). The code inserted in BB1 of Figure 4 might throw exceptions, possibly causing exceptions to be thrown out of order. The Java language requires precise exceptions: all effects of the statements executed and expressions evaluated before the point from which the exception is thrown must appear to have taken place ([12], Section 11.3.1). To ensure not to violate the requirement of precise exceptions, the compiler does not hoist code that can cause any side effects, e.g., array store or putfield. Thus, the compiler does not need to recover the old values of arrays, fields, and variables once an exception happens in BB1. Moreover, an exception handler, whose handler routine is the original loop, is created to catch any exception that might happen within BB1. Once the exception handler catches any exception, the transfer of control takes place (indicated by dotted arrows in Figure 4 (b)) and the original loop is then executed. During the execution of the original loop, exceptions are thrown in the right order. Let us consider an example. Assume that j/k throws ArithmeticException (division by 0) during the first iteration of the loop. That is, the execution of the original loop throws ArithmeticException. Also assume that “@(i,a,L0)” in BB1 throws NullPointerException. Once the exception handler catches NullPointerException, the original loop is executed. During the execution of the original loop, j/k throws ArithmeticException. As such, the precise exception is preserved.
4.4
INLINING
Inlining is a common and well-adopted technique used in compilers to reduce the overhead of method invocations. Inlining enlarges the compilation scope, exposes more optimization opportunities and eliminates the run-time overhead of creating a stack frame and passing arguments and return values. Method calls in Java are virtual (dynamically dispatched) unless their bytecodes are declared as static, final or special. Virtual method calls cannot be easily eliminated because the compiler generally has no idea which callee will be invoked. Before discussing the approaches of inlining a virtual method, we need to describe the object layout, which has a direct influence on how the method is inlined. Figure 5 depicts the object layout used in most implementations of object-oriented languages, e.g., C++ and j=x
@(j,a,label)
cmp a.length,j jbe label L0: L1: L2: L3: L4: L5: L6:
..j/k.. @(i,a,L15) t = a[i] @(j,t,L15) ..t[j].. j++ j < 100
L15: call out_of_bound
(a) Original code j=x
BB1 L7: L8: L9: L10:
Exception handler
@(i,a,L0) t = a[i] @(j,t,L0) @(99,t,L0)
original loop L0: L1: L2: L3: L4: L5: L6:
..j/k.. @(i,a,L15) t = a[i] @(j,t,L15) ..t[j].. j++ j < 100
cloned loop
L11: L12: L13: L14:
..j/k.. ..t[j].. j++; j < 100
L15: call out_of_bound
(b) After transformation
Figure 4. Bounds checking elimination
17
Java. x is a reference pointing to an object. The first field of the object points to the vtable (virtual method table). For each virtual method of the object, there is a dedicated entry in the vtable, pointing to the native code of the method. To get the address of a virtual method foo, we need to dereference the pointer twice (two memory accesses). The first one gets the vtable (t = [x]). The second one gets the address of foo ([t+64]).
OVERRIDDEN_RE offset ...
mov eax, DWORD PTR [eax] jmp _inlined_callee nop nop jnz _default_invocation _inlined_callee: // inlined callee
As the virtual method gets inlined, the JIT compiler generates a runtime test to verify if the inlined callee is the right instance to be invoked. The normal method invocation code sequence is executed if the verification fails. The run-time test is usually implemented in two ways [9]: one tests the vtable (discussed in Section 4.4.1) and the other checks the actual target address of the method invocation (discussed in Section 4.4.2). An inline cache approach object
...
m_handle cmp m_handle cmp
offset
length
eax, 0bc3508h offset
length
eax, 0bc3462h . . .
Figure 5. Dynamic patching path instead of the inlined path even though A’s foo is invoked every time.
vtable
4.4.2
Checking target address
The second approach inserts code to compare the actual method address that x.foo() is invoking with the address of A’s foo (as shown below).
x bar 64
mov eax, DWORD PTR [eax] // get vtable mov ecx, DWORD PTR [eax+64] // target addr cmp ecx, [BE762Ch] jnz _default_invocation // inlined callee . . . _default_invocation: // normal invocation code . . .
[t+64] foo
Figure 5. Object layout
[13] is not taken into account here because the generated stubs introduce one extra dereference, and a sequence of testing for polymorphic call sites may cause high run-time overhead. That approach is more applicable to languages that have high overhead for method invocation, such as SELF. In Section 5.1, we describe enhancements that further improve the inlining accuracy and the code sequence for the conditional test.
4.4.1
patch
_default_invocation: // normal invocation code
t = [x]
data
n_patch
This approach is more precise. However, the checking needs at least 2 memory accesses ([x] and [t+64]). In Just-In-Time compilation, a method is compiled right before its first execution. If A’s foo is not yet compiled, we have no idea what the actual address of A’s foo is. The compiler then has to allocate memory space in which we fill the address of A’s foo as soon as A’s foo is compiled. In such a circumstance, the test requires 3 memory accesses.
Checking vtable
The first approach compares the object’s vtable with the vtable of the class of the inlined method. The code sequence of this approach is shown in below. If the test succeeds, it is safe to execute the inlined code because the inlined method is the one that will be dynamically dispatched at run time. If the test fails, the regular dispatching code sequence is executed to invoke the virtual method call.
The optimizing compiler uses the first approach, testing vtable, because it requires only one memory access. However, we need to deal with the conservatism of the approach. We have implemented two mechanisms to alleviate the issue: type propagation and dynamic patching that is discussed in Section 5.1. In [13], type feedback is used to improve the accuracy of inlining predictions. In the MRL VM, we do not record a type profile for every call site. Instead, we propagate type information during copy propagation to track the actual class type of the object of the invoked method. Consider code x.foo(). If type propagation proves that the actual type of x is class B instead of class A, where A is a superclass of B, and the class hierarchy analysis [8] proves that there is no class in between A and B that overrides foo, then we generate the test for comparing x’s vtable against B’s.
mov eax, DWORD PTR [eax] // get vtable cmp eax, 0bc3508h jnz _default_invocation // inlined callee . . . _default_invocation: // normal invocation code . . . The benefit of this approach is that only one memory access ([x]) is involved to determine if either the inlined A’s foo or the regular call sequence should be executed. The original call overhead is reduced to one memory access, one comparison and one branch. But the drawback is that checking vtable is conservative. Consider the code x.foo(). Presumably, x can be either class A or B where A is a superclass of B and A’s foo is not overridden by B. If x’s dynamic type is always of class B but its static type is set to A, the checking always fails because class A and B have distinct vtables. The code shown above always executes the non-inlined
4.4.3
Policy
The inlining policy is based on the code size and profiling information. If the execution frequency of a method entry is below a certain threshold, the method is then not inlined because it is regarded as a cold method. To avoid code explosion, we do not inline a method with a bytecode size of more than 25 bytes. Inlining is performed in a recursive fashion. The compiler traverses the IR and determines which call sites need to be inlined. Then the
18
compiler builds the control flow graphs (CFG) and IR for those inlined methods. Before grafting the newly created CFGs into the caller’s, the compiler repeats the same inlining process for the inlined methods. To avoid inlining along a deep call chain, inlining stops when the accumulated inlined bytecode size along the call chain exceeds 40 bytes.
5
Finally, the first two bytes of the cmp are written atomically using xchg.
5.2
DYNAMIC OPTIMIZATIONS
In this section, we discuss some techniques applied at run time to deal with patching native code, reducing the GC map size, caching the stack frames, and avoiding creating exception objects.
5.1
Lazy GC map
The JIT compilers generate a GC map for each method, allowing the compilers to unwind stack frames for exceptions and compute the root set of live references for garbage collection. The root set consists of all objects pointed to by global pointers or by pointers in the active stack frames. Typically only a small number of methods are active when GC happens, which means the GC maps for the rest of the methods are superfluous. We would like to take a lazy approach that generates the GC map on the fly. Because computing the GC map requires recompiling methods, the approach of lazy GC map generation is solely applicable to the fast code generator. Instead of generating ordinary method info, the fast code generator produces small method info that comprises a profile data pointer, a GC data pointer set to null initially, and a bit vector for class initialization. Whenever a nonexistent GC map is needed, the method is recompiled to compute the GC map and set the GC data pointer (as depicted in Figure 7). The class initialization bit vector deserves additional explanation. As described in Section 4.1, the fast code generator also eliminates class initialization calls, whenever the VM indicates that the class has already been initialized at JIT compilation time. Therefore, the actual code that the fast code generator produces is not stateless—it depends on which class initializers have been executed at the time the method is compiled. This state is required for recomputing the GC map, and thus the class initialization bit vector is saved in the method_info when the method is first compiled.
Dynamic inline patching
Often, a method is not overridden from the time the JIT compiler inlines the method until the end of the program execution. The method is always the right instance of invocation if the class hierarchy does not change over time. We would like to generate code based on the assumption that the inlined method will probably never be overridden throughout the program execution. Nevertheless, Java allows classes to be dynamically loaded at run time, which is known as dynamic class loading. In other words, the class hierarchy may change. Dynamic patching is a technique that patches the native code to preserve the correctness of the program once the assumptions made by the compiler are invalidated. The optimizing compiler produces the inlining code sequence as shown in Section 4.4.1. Right before code emission, the compiler replaces the cmp with a jmp, directly to the inlined code (as illustrated in Figure 5), if the inlined method is not yet overridden at that time. The overhead of the conditional test, one cmp and one jnz, is reduced to one direct jump instruction. A patch entry is created for the cmp just replaced. The patch is composed of the method handle of the inlined method (callee), the code offset and length of the IA-32 cmp instruction, and the byte array for storing the cmp. Since the instruction length of the cmp is longer than the jmp, nops are filled in for the remaining bytes after the replacement. The compiler then invokes an API call, method_set_inline_ assumption(caller,callee), to notify the VM that the caller has inlined the callee with the overridden optimization enabled. An overridden_rec is created as part of caller’s method_info, containing all patches of the caller as well as the total number of the patches. A callback, method_was_ overridden(caller,callee), provided by the optimizing compiler, allows the VM to notify the compiler that the callee has been overridden and therefore fixing the caller’s code is required. method_was_overridden retrieves the caller’s overridden_rec and performs fixing for all the patches whose method handle matches callee’s. The code patching must be thread-safe because other threads may be executing the instruction that we are about to patch, i.e., the direct jump instruction. The code sequence the compiler uses to make code patching thread-safe is divided into three steps (shown in Figure 6): First, the direct jump instruction is substituted by a spinning jump (jump to itself). We use the xchg, instead of mov, instruction that exchanges two operands to write the spinning jump because mov is not an atomic operation. If a memory operand is referenced in xchg, the processor’s locking protocol is automatically implemented for the duration of the exchange operation [16]. The locking protocol ensures writing 0xFEEB (two bytes) has exclusive use of any shared memory—the operation is atomic. Other threads that happen to be executing the instruction will spin waiting for the completion of the patching. Second, the original cmp except the first two bytes are restored.
5.3
Caching Of The Unwinding Process
We speed up the stack traversal by using caches to eliminate duplication of work for the same frame. This optimization relies on the fact that often a set of frames remains on the stack long enough to be traversed by the exception code for multiple exception dispatches. We use two caches, one to improve the method lookup and another to improve the unwind itself. The method lookup cache is a direct mapped cache indexed by a hash value computed from the IP value. If the IP value in the cache matches the current value, the result is returned immediately, otherwise the binary search is performed (see Section 3.2) and the cache entry is updated before the result is returned. In our VM we Byte *code = method_get_code_block_addr(caller); Byte *first_byte_addr = code + patch->code_offset; // step 1: write a spinning inst __asm { mov eax, first_byte_addr mov cx, 0xFEEB // spinning xchg word ptr [eax], cx } // step 2: restore cmp inst except // the first two bytes for (int j = 2; j < patch->length; j++) code[patch->offset + j] = patch->orig_code[j]; // step 3: restore the first two bytes Byte *first_orig_addr = (Byte *)patch->orig_code; __asm { mov eax, first_byte_addr mov edx, first_orig_addr mov cx, word ptr [edx] xchg word ptr [eax], cx }
Figure 6. Code patching
19
use a cache of 512 entries. This size is larger than needed for the benchmarks discussed in this paper, but is chosen for the benefit of larger applications. The unwind cache is maintained by the JIT compiler. In our implementation, the core VM does not know the layout of stack frames corresponding to methods compiled by a compiler. The compiler is responsible for creating appropriate information to make the unwind process possible. A pointer to the appropriate unwind data structure is stored in the JIT_INFO structure from Figure 2. Our design requires that a JIT compiler provides a run-time function that, given a register context and a pointer to the unwind data created at compile time, must update the context to the caller’s context. That involves recovering the values of the stack pointer (SP), IP and callee-saved registers. The stack unwind function must be designed so that two, possibly conflicting, goals are met: The unwind data structures should be as small as possible. In our earlier paper [22] we describe how to minimize the size of the GC information. The same data structures hold information needed for GC and other stack unwinds, because there is much overlap between the root set enumeration and stack unwind functions. The process of the unwinding should be as fast as possible. In addition to implementing efficient compression schemes, we speed up the unwinding by using a cache in the compiler [22]. The unwind cache enables faster unwinds of frames corresponding to cached IP values.
5.4
Existing Java Virtual Machines create exceptions eagerly, i.e., as soon as an exceptional situation is observed, and the exception object is created and initialized. In the next step the VM searches the stack for the right handler. Our approach is to create exceptions lazily, i.e., initially assume that the exception object is not required, search for the handler and when one is found, consult data structures provided by the JIT compiler to determine if the exception object is live at the entry to the handler. If the compiler can prove that the exception object is dead, the object is never created. If, on the other hand, the exception object is live, we have to create the exception object. The difficulty is that the exception object must be initialized as if it were created in the context where the exception was thrown. The VM has however destructively unwound a (possibly empty) subset of the top stack frames. See Section 5.4.3 for a more complete discussion of the correctness issues. Lazy exception throwing is relatively easy for exceptions thrown by the VM itself. Those predefined run-time exceptions are required by the JVM semantics [19]. Examples include ArrayIndexOutOfBoundsException and NullPointerException. The operation of the exception object creation and
throwing is completely performed by the VM and therefore the order of the operations is not visible to the application. This simpler case is described in Section 5.4.1. Our design is more aggressive and attempts lazy exception throwing even for exceptions created by user code. This requires a more complete support in the compiler and is discussed in Sections 5.4.2 and 5.4.3. The lazy exception mechanism is implemented only in the optimizing compiler because analyses that ensure that the mechanism does not violate the semantics of Java are based upon IR.
Lazy Exceptions
We have noted that some Java applications use exceptions to change the control flow only. In those applications the exception object’s type is used to determine which handler catches the exception, but the content of the exception object is never accessed. In those cases creating the stack trace is unnecessary and we can save a substantial amount of work by never creating the exception object itself. Let’s revisit the code example in Section 3. The exception object is not used in the handler in printSumOfInts. Compiler analysis can trivially detect that the object is dead at the entry of the handler. Since the exception object is never used in this example, it would be JIT id
5.4.1
JIT_INFO
Next Exceptions ... Native Method info
Profiling data representation
5.4.2
GC map
S_METHOD_INFO
VM Exceptions
The implementation of lazy VM exceptions is relatively straightforward. When the VM detects an abnormal condition, it first performs a destructive unwind to find an appropriate handler and then queries its data structures whether the exception object is live at the entry of the handler. If the object is live then the object is created exactly the same way it would have been created in a standard VM implementation. If, on the other hand, the exception object is dead at the handler entry, its creation is skipped altogether. Since VM exceptions in our implementation have no side effects, the semantics of the application are not changed. Also, the constructors of our VM exceptions never throw exceptions themselves, so the extra difficulty described in Section 5.4.3.3 does not apply here.
User Exceptions
User exceptions are typically created with the following sequence of bytecodes: new dup [optionally push constructor arguments] invokespecial athrow Of course, in principle, these instructions do not have to be contiguous and they may span multiple basic blocks or even methods. In practice however, the complete instruction sequence is usually in the same basic block and its analysis is possible in an optimizing compiler. We could handle user exceptions the same way we handle VM exceptions if we knew that not executing the constructor or executing it in a different context would not change the semantics of the program.
Profile_data GC_data Class_initialization
Fast code generator
recompilation
Figure 7. Lazy GC map possible to avoid its creation. The problem is that the exception is thrown in a different method and at the time of the throw it is not known which handler will catch the exception and consequently it is not known whether it is necessary to create the object. Therefore, to the best of our knowledge, all Java VM implementations conservatively create all exception objects. Our technique of lazy exception throwing eliminates the need for creation of the exception object in certain, common cases.
20
5.4.3
arguments are already evaluated and are stored in local variables or on the Java stack. To decide if a constructor is side effect free, the compiler must analyze the constructor and recursively all the invoked methods. A constructor always invokes a constructor of the super class, which in turn invokes the constructor of its super class. Since ClassNotFound is a subclass of Exception, constructors of ClassNotFound, Exception, Throwable, and Object are invoked. Two other methods, Identifier.toString() and Throwable.fillInStackTrace() are also invoked. A detailed discussion of the more troublesome of those methods follows.
Side effects
Side effects may cause problems that violate semantics of the program. We have the obvious set of operations that we consider to have side effects: stores to fields and array elements, and invoke operations that have not been inlined. Because of the reasons discussed in Section 5.4.3.3, we also do not allow synchronization operations and operations that may cause exceptions. Using the lazy exception mechanism in javac requires complete side effect analysis, so we use it as a good illustration for our paper. That example is described below. The same techniques eliminate the creation of exception objects in many other applications and we believe that our implementation is as powerful as necessary and feasible given the restriction on how expensive compile time analysis can be in a JIT compiler. We will use javac, a Java compiler, as an example of an application that benefits from lazy exception creation and in which all exceptions thrown in a normal run are user exceptions. Javac is a relevant benchmark because: Javac is part of the SPEC JVM Client98 benchmark suite (also referred to as SPEC JVM98 [22]) and therefore performance of this benchmark is of interest to designers of Java VMs. Javac is a realistic Java application. It performs a relevant computation and is in use by many programmers worldwide (although note that versions of javac distributed with newer editions of Sun Microsystems’ JDK have likely been improved and expanded compared to the version included in SPEC JVM98). Here is the specific sequence of instructions from that application. For brevity, we omit package names, but note that all non-standard classes are declared in the spec.benchmarks._213_javac package. This code fragment comes from the Identifier.Resolve(Environment, Identifier) method. new dup aload_2 // push a constructor argument invokespecial athrow
5.4.3.1
Field updates
Our notion of side effects is standard but we relax it in one way. For the purposes of our analysis, we consider a sequence of instructions to have no side effects even if there are stores to fields of the object that is considered as a candidate for lazy creation. The rationale is that modifications to the state of an object that is dead have no observable side effects. One code fragment in the ClassNotFound(Identifier) constructor that could potentially have side effects is a store to the field name. aload_0 // this pointer aload_1 // constructor argument putfield This code fragment is an example of a store to a field of the exception object whose creation we want to eliminate. As discussed above, we do not consider such a store to have side effects.
5.4.3.2
Method invocations
An invocation of any method may have side effects. The compiler must prove that that is not the case. The optimizing compiler attempts to inline recursively all method invocations in the constructor. General strategy for inlining is followed with general restrictions on inlining assumed by the compiler (see Section 4.4). Virtual method invocations are also inlined, possibly with a runtime check. In that case, only the path along which we inlined the method is considered a candidate for the lazy exceptions mechanism. If a native method is invoked, the compiler must of course conservatively assume that the method may have side effects. There is a mechanism to override this default, conservative assumption. Every method has a flag associated with it that says if the method can be assumed to be side effect free without compiler analysis. Specifically, for the purpose of the lazy exception analysis, we set this flag to mark the native method java.lang.Throwable.fillInStackTrace() as side effect free. That assumption is valid because our VM implements fillInStackTrace() internally and the VM can guarantee that there are no side effects in this method.
This example follows the generic pattern presented earlier for user exceptions. The essence of the optimization is to delay the creation of the object of class ClassNotFound until the VM finds the right handler and determines that the exception object is indeed live in the handler. In many applications, exceptions are used for abnormal control flow, but the exception object is not used for anything other than selecting the right handler. In those applications, the compiler can often detect that the exception object is dead in the handler. This situation happens in javac. For the workload included in SPEC JVM98, javac throws 22,372 exceptions and all of those exceptions result in transferring control to handlers in which the exception object is dead. It is difficult to transform this code pattern into a lazy exception throw, because the constructor of the exception may have side effects. Of course, a constructor with side effects cannot be eliminated, so we use lazy exceptions only if the compiler can prove that there are no side effects in the constructor. Note that while in our implementation the arguments to the constructor are always evaluated, it would be possible for the VM to be even more aggressive and lazily evaluate arguments to the constructor. That would require additional compiler analysis for the side effects of the argument evaluation. In practice, it does not seem to be necessary, because in the applications we looked at, there are either no arguments to the constructor or (as in the above example)
Another code fragment of ClassNotFound(Identifier) with potential side effects is aload_0 aload_1 invokevirtual invokespecial Each of the two methods in this example presents different challenges. Identifier.toString() is invoked as a virtual method and needs a run-time check to make sure that the class of the object is indeed Identifier. This analysis is performed by
21
our compiler for inlining, so no new code had to be added to take care of that. The body of Identifier.toString() does not throw exceptions as long as its argument is not null; our compiler’s inlining infrastructure equates that argument with variable 2 of the Identifier.Resolve(Environment, Identifier) method. That variable can be shown to be non-null by virtue of its earlier uses, which dominate the exception throwing code. The second method, Exception(String), is difficult to analyze for a different reason. The invocation is not virtual, so inlining can be done without any extra effort. However, inlining of this method causes in turn another method, Throwable(String), to be inlined. This method is more problematic. One issue is that it modifies a field of the object being created, but this, as explained above, is a false side effect since it involves a modification of the very object we want to avoid creating. So the following code is assumed to have no side effects. aload_0 // this pointer aload_1 // constructor argument putfield
Exceptions in constructors The most important problem can be caused by exceptions thrown by the constructor of the exception object itself. The optimizing compiler ensures that the constructor will not throw any new exceptions that could be caught by a handler of a method whose stack frame is between the top of the stack and the frame of the method with the handler corresponding to the lazy exception. To understand why it is necessary, consider the following example. A calls B. B throws an exception of class foo lazily. There is no handler for foo in B, so the VM destructively unwinds the frame of B. Now, a handler for foo is found in A and the exception object is live in the handler. The VM now creates an object of type foo. This object is supposed to be constructed in the context of B, so if the constructor of foo throws a new exception, say, of class bar, there is a possibility that a handler for this exception exists in B and the control is supposed to be transferred there. We address this issue by only allowing lazy exceptions when the compiler can prove that the constructor will not throw exceptions.
Synchronization
Another more difficult problem in Throwable(String) is in the following code fragment.
Synchronized methods are another issue. In Java a method can be declared as synchronized. That means that a monitor associated with the object referenced by the this pointer is entered when the method is entered. A destructive unwind exits this monitor. But it is possible to write a program that throws an exception in such a way that the constructor of the exception object relies on the fact that the current thread entered a monitor for an object referenced by a this pointer of one of the methods on the stack. If we invoke the constructor lazily after we exit the monitor, a deadlock can occur or an incorrect result can be produced due to insufficient synchronization. We avoid the deadlock potential by not allowing lazy exceptions if the compiler analysis of the constructor detects any monitorenter bytecodes or any invocation of synchronized methods. Note that errors due to insufficient synchronization are not actually possible, because we do not allow side effects in constructors for lazy exceptions.
aload_0 invokevirtual We have already explained that our compiler can inline virtual method invocations (with a run-time check). The problem here is that Throwable.fillInStackTrace() is a native method and the JIT compiler conservatively assumes that all native methods may have arbitrary side effects. As described above, the VM, which implements this method, marks it as side effect free.
5.4.3.3
Using the right context
The optimizing compiler always evaluates all arguments to the constructor of the exception object even if the constructor is never invoked, so the execution of any code related to the evaluation of arguments is always performed at the right time and in the right context. However, the compiler must prove that the body of the constructor itself, including any methods invoked by the constructor, does not cause side effects. When the VM discovers the correct handler and finds that the exception object must be created, the context in which the exception was supposed to be executed may no longer exist, because some stack frames may have been destructively unwound. A simple solution would be to first find the handler using non-destructive unwinds, find out if the exception object is live, create the object if necessary in the correct context, and then traverse the stack again, using destructive unwinds. The drawback of this simple solution is that the stack is traversed twice and so throwing exceptions is actually slower if the exception object is live in the handler. We did not want to sacrifice performance and the extra stack traversal was not acceptable. Instead we are giving up expressive power and only using lazy exceptions when the compiler analysis can prove that it is safe to execute the constructor in the context of the handler. Two specific correctness issues are discussed below.
6
TRIGGERING RECOMPILATION
One important component of dynamic recompilation is the mechanism to trigger recompilation. Recompilation is expensive in terms of compilation time. We want to recompile hot methods as soon as possible while avoiding recompiling cold methods. In other words, the mechanism needs to make the decisions of when to recompile and what to be recompiled. The MRL VM has implemented two mechanisms.
6.1
Instrumenting
The first mechanism uses the instrumenting code to trigger recompilation. The initial values of counters are set to some threshold values. As code gets executed, the counters are decremented. We insert code to test the values of the counters against zero. As soon as the counters reach zero, the code immediately jumps to the routine that triggers recompilation. The threshold values for the method entry and the back-edge counters are set to 1000 and 10000 respectively. The benefit of the mechanism is that once a threshold is reached, recompilation is triggered immediately, and thus the newly optimized code can be used as soon as possible. Nevertheless, the drawback is that choosing the threshold is not trivial. If we would like to compile hot methods sooner, we need to set the threshold low. As a result, the
22
optimizing compiler may end up recompiling lots of non-hot methods and wasting the compilation time. If we want to avoid compiling non-hot methods, we need to set the threshold high. Consequently, performance may suffer because hot methods are not recompiled soon enough.
6.2
how many methods needed the GC map (listed in Table 1). The experimental results show that only a small portion of methods remain active when exceptions or GC occurs. For programs that do not involve a lot of exception throws and GC, the actual GC map used is around or below 5%. That is, most of the time and space spent on computing the GC map is wasted. Interestingly, 228_jack is an exceptional case; 30% of the total compiled methods need the GC map at run time. The lazy approach saves the size of the GC map substantially—86% on average. Our experimental results show that the incurred run-time overhead of recompilation is less than 0.2%.
Threading
The second mechanism is thread-based, aimed at curtailing the compilation time by overlapping compilation with program execution on a multiprocessor system, which is also known as continuous compilation [21]. The code that updates counters increments counters to update the profiling information rather than decrementing. A separate thread is created for recompilation, periodically scanning through the profiling information to determine which methods are hot and need to be recompiled. The thread can utilize cycles of an idle processor for recompilation. All counters are reset to zero during scanning so that no accumulated values are carried over to the next recompilation session. The thread is suspended and waits for a TIMEOUT event. When the timer goes off, the thread is woken up to analyze the profiling information of all methods. Based on our observation, most hot methods are executed frequently in the early execution of programs. Therefore, the TIMEOUT interval is short in the beginning, and is linearly increased as programs are running. The current timer is set to 1 second initially and increased by an extra 1 second for the next session. We stop increasing the timer when it reaches 8 seconds. There are two drawbacks of the approach: First, the thread needs to scan the profiling information of all methods to decide which methods are recompilation candidates. Second, hot methods are not immediately recompiled as they pass the thresholds. They have to wait until the next TIMEOUT event. # of compiled methods
% of used GC map
non-lazy GC map size
374
10.7%
436K
86.2%
201_comp.
309
4.2%
374K
89.8%
202_jess
744 327
5.2%
609K
88.6%
5.5%
394K
89.9%
213_javac
1100
8.5%
953K
76.5%
222_mpeg.
481
1.5%
573K
94.7%
227_mtrt
449
4.9%
486K
85.9%
228_jack
558
29.6%
631K
76.4%
201_comp.
22.29
22.38
22.47
202_jess
14.04
12.77
12.42
11.89
209_db
34.41
29.78
29.38
29.62
213_javac
21.89
18.91
18.52
16.68
222_mpeg.
23.75
19.32
18.58
18.60
227_mtrt
10.99
8.49
7.83
7.94
228_jack
20.23
17.93
17.91
17.14
total
154.61
129.49
127.02
124.34
of each program. The result of Table 2 shows that the dynamic recompilation outperforms the rest except in the case of 201_compress. For 201_compress, the compilation time is not an issue and the profiling information feedback does not help much to guide optimizations (static loop hierarchy analysis is good enough). One noticeable aspect from the table is that we do not see a significant improvement over the optimizing compiler for 201_compress and 209_db. There are a few reasons. First, many methods are compiled before the programs start the timer. The performance gain from dynamic recompilation for those methods is not seen in the result. Second, the optimizing compiler does not implement some expensive optimizations, e.g., code motion and code scheduling. Code scheduling is not implemented in the optimizer because the Pentium II processor detects dependences among instructions and does outof-order execution. Moreover, as mentioned earlier, code motion is not implemented because of the potential increase of register pressure on the IA-32, which has only a few registers. For this kind of architecture, code scheduling and code motion become less important. Nevertheless, for the architectures that can highly benefit by expensive optimizations to achieve good performance, e.g., IA64 [17], we expect that the dynamic recompilation technique will outperform the optimizing compiler significantly.
EVALUATION
We ran a collection of programs from the SPEC JVM98 [22] benchmark suite on the Intel VM. All experiments were performed on a system with two 450MHz Intel® Pentium® II Xeon™ processors. In our measurements, we did not fully follow the official run rules defined by the SPEC committee, so no SPEC number should be derived from the results, and no comparisons with other vendors’ JVM were evaluated. We chose an 80MB heap size.
7.1
29.30
Table 2. Dynamic recompilation
Table 1. Lazy GC map
7
Effectiveness of optimizations
We ran the experiments with 4 different configurations of our VM. The first configuration purely used the fast code generation approach with the lazy GC map. The second one solely used the optimizing compiler to generate native code without relying on the profiling information feedback. All optimizations, e.g., inlining and checkcast, were performed based on the static analysis of the program. The last two were for different mechanisms of triggering recompilation. The table below shows the execution time (seconds) fast dynamic recomp. opt. code gen thread instr.
% saved by lazy GC map
200_check
209_db
7.2
GC map size
We used the fast code generator to compile SPEC JVM98 and measured how many methods were compiled for each program and
23
For 202_jess, 213_javac and 228_jack, the threading mechanism is able to speed up (~11% for 213_javac) the running time by overlapping the compilation time with the program execution, because quite a few methods are recompiled. Overall, the dynamic instrumenting and threading approaches gain 2% and 4%, respectively, over the optimizing compiler. We ran another set of experiments to test the effectiveness of individual optimizations. The base line (the first column of Table 3) is the dynamic recompilation with the threading scheme, in which all optimizations are enabled except the overridden approach. We compare the running times of all but one optimization. The second column is the running time without the checkcast optimization. The optimization has 3.4% performance impact for 209_db, negligible influence for the rest. The third column shows the running time when the bounds checking elimination is turned off. The compiler still performs local bounds checking elimination during IR construction. Bounds checking elimination has only observable impact for 222_mpegaudio (~3%). The rightmost three columns evaluate inlining optimizations: The first one shows the running time of turning off the inlining optimization completely. The second one is for measuring the effectiveness of type propagation in the presence of inlining (discussed in Section 4.3.1). The last column indicates the running time of the dynamic patching approach (described in Section 5.1). When comparing the base line and no inlining columns, we see type propagation has little effect on the overall performance for all programs except 227_mtrt which would otherwise has ~11% performance loss. Dynamic patching yields fairly small performance gains (less than 0.5%) over the base line.
7.3
inlining no type prop.
thread
no check.
no bound
no inline
201_comp.
22.47
22.43
22.59
26.23
22.54
22.53
202_jess
11.89
12.02
11.85
12.97
11.79
11.63
209_db
29.62
30.63
29.67
30.39
29.63
29.61
213_javac
16.68
16.68
16.63
17.38
16.71
16.54
222_mpeg.
18.60
18.57
19.20
19.39
18.58
18.55
227_mtrt
7.94
7.91
7.89
10.06
8.82
7.71
228_jack
17.14
17.20
17.19
18.19
17.01
17.26
total
124.3 4
125.4 4
125.02
134.6 1
125.0 8
123.8 3
overriden
Table 3. Effectiveness of optimizations Although this paper focuses on the performance impact on exception throwing, the caching described in this paper will certainly improve the performance of applications with a lot of security-related stack unwinding. The benefit for garbage collection is small, because the total amount of work done during a GC cycle is much larger than the enumeration of the root set. A similar question can be posed about implementing lazy exceptions. Is it possible that this optimization will have a negative impact on the performance of some applications? There are two potential sources of overhead: the added cost of the analysis to determine at compile-time if an exception throw can be converted into lazy exception creation and the cost of executing an exception lazily after the handler has been found. We have not observed a negative impact on performance of lazy exceptions on any of the applications we have run. In addition to SPEC JVM98 we have also run a set of larger applications. We argue that this observation can be generalized for Java applications in general. The extra compile-time overhead in the optimizing compiler to detect lazy exceptions opportunities is minimal, because most of the work (e.g., inlining) is performed anyway to enable other optimizations and lazy exceptions-specific part of the analysis (detection of side effects, potential exceptions and synchronization) is not computationally intensive. More importantly, in our dynamic compilation scheme the optimizing compiler is invoked only on a small subset of methods that were determined to be hot. For those methods a more expensive analysis is acceptable.
Exceptions
Caching improves performance if exceptions are thrown multiple times with frames on the stack corresponding to the same contexts. Not all benchmarks have this property, but both jack and javac from SPEC JVM98 use exceptions for control flow in a way that benefits from caching. The natural question is whether caching could cause performance degradation for some benchmark. We believe that this would not happen. The first reason is that in our implementation the overhead of caching compared to the regular method lookup is negligible. We maintain a very simple, direct-mapped cache which can be checked against and updated efficiently. A regular lookup function must perform a binary search in a table of IP ranges and that cost would dwarf the cache overhead even if for a given application all lookups in a cache resulted in cache misses. The second part of the argument is that we believe that Java applications either do not use exceptions heavily and then the overhead of maintaining the cache is small or they use exceptions extensively and then it should be the case that at least the frames close to the bottom of the stack do not change quickly and their lookup will be sped up by the cache. And likely, as in the case of javac and jack, a large set of stack frames will remain constant from one exception throw to another and the benefit of caching will be significant. Stack unwinding is used for exceptions, garbage collection and for security-related stack walking. There may exist applications where the security-related stack unwinding is a bottleneck. For SPEC JVM98 it is not the case in our VM.
228_jack
30.41
22.28
eager lazy
20.07
22.28
Method lookup cache No unwind cache
eager
29.49
21.43
lazy
19.91
21.43
No method lookup cache Unwind cache
eager
21.32
18.72
lazy
19.11
18.72
Method lookup cache Unwind cache
eager
20.45
17.93
lazy
18.91
17.93
Table 4. Lazy exceptions and caching.
24
213_javac No method lookup cache No unwind cache
There is almost no overhead associated with saving the throw context so that when the VM detects that an exception thrown lazily is caught in a handler in which the exception object is live, the VM can execute the constructor in the correct context. The VM ensures that the right context exists by performing a copy of the original context once, before the stack unwinding process starts. We have instrumented our VM to collect statistics relevant to the performance. One of the numbers we collect is the count of exceptions thrown during the execution of the application. Out of 7 applications in SPEC JVM98 only two, javac and jack, throw any exceptions. But for those two applications exception counts are relatively high, 22,373 and 241,877 respectively. Those two programs belong in the category of irregular applications that are similar to many other real-life applications and are notoriously difficult to optimize. We show the performance results for javac and jack in Table 4. Jack does not benefit from lazy exceptions, so the “eager” and “lazy” numbers are identical. The two types of caching are described in Section 5.3. For SPEC JVM98, the configuration with both caching mechanisms enabled offers the best performance. A combination of caching and lazy exception creation results in speedups of 37% for javac and 20% for jack. The performance improvement from caching for javac is 6% if we use lazy exceptions and 33% if we use eager exceptions. The technique of lazy exceptions improves the performance of javac by 34% if we do not use any caching and by 8% if we use both forms of caching. Jack, with far more exception throws, does not benefit from the lazy exceptions optimization. Our investigation suggests that authors of jack must have realized the cost of exceptions and avoided much of the penalty by reusing the same exception object. The instrumentation shows that only 35 exceptions are actually created, 4 orders of magnitude less than are being thrown. One might speculate that if jack were written in the more natural way of creating an exception every time it is thrown, the impact of our optimization would be larger than for javac since the number of exceptions thrown is an order of magnitude higher and the running times of javac and jack are comparable.
8
run-time overhead introduced. The other two techniques deal with exceptions. Caching of the method lookup in the core VM and of the unwind process in the JIT speeds up stack unwinding and helps two of the SPEC JVM98 benchmarks. Lazy exceptions help programs like javac which throw a large number of exceptions. We have also described and evaluated two mechanisms, instrumenting and threading, for triggering recompilation. Experimental results show that the threading approach has a noticeable improvement over the instrumenting approach for programs that have a fair amount of recompiled methods. We expect the gap will enlarge if the target machine needs sophisticated/expensive algorithms to deliver good quality code, e.g., the IA-64 architecture.
9
ACKNOWLEDGEMENTS
We appreciate the feedback provided by the referees. We also thank Perry Wang, Yong-Fong Lee, Rick Hudson, Jesse Fang, Tatiana Shpeisman, and Aart Bik for their insightful comments on the paper.
10 REFERENCES [1] A. Adl-Tabatabai, M. Cierniak, G.-Y. Lueh, V.M. Parikh, and J.M. Stichnoth. Fast, Effective Code Generation in a Just-InTime Java Compiler. Conference on Programming Language Design and Implementation, May 1998, pp. 280-290. [2] A. Adl-Tabatabai and T. Gross. Detection and Recovery of Endangered Variables Caused by Instruction Scheduling. Conference on Programming Language Design and Implementation, May 1993, pp. 13-25. [3] A. Adl-Tabatabai and T. Gross. Source-Level Debugging of Scalar Optimized Code. Conference on Programming Language Design and Implementation, May 1996, pp. 33-42. [4] A. V. Aho, R. Sethi, and J. Ullman. Compilers: Principles, Techniques, and Tools. Addison-Wesley, Reading, MA, second edition, 1986. [5] K. Arnold and J. Gosling. The Java Programming Language. Second Edition. Addison-Wesley, 1997. [6] J. Auslander, M. Philipose, C. Chambers, S. Eggers, and B. Bershad. Fast, effective dynamic compilation. Conference on Programming Language Design and Implementation, May 1996, pp. 149-159.
CONCLUSIONS
This paper has presented the structure of dynamic recompilation of the Intel research VM, consisting of the fast code generator, the optimizing compiler and the profile data representation. When first executed, all methods are considered to be cold. The fast code generator compiles the methods using some lightweight optimizations in this cold phase. Some of the methods switch from the cold state to the hot state when they are executed often enough. Identified hot methods are recompiled using the optimizing compiler that performs heavyweight optimizations to improve the code quality. We have discussed some optimizations that eliminate run-time overhead and evaluated their effectiveness. We have proposed four new techniques. One is to use newly created exception handlers to maintain the precise exception order during optimization transformations, allowing the compiler to be aggressive in terms of hoisting loop invariant code as well as checking bounds outside loops. The second one is dynamic patching which preserves the correctness of the program in the presence of dynamic class loading. The paper has shown that the lazy GC map approach is able to reduce the size of the GC map by an average of 86% with very little
[7] M. Burke, J-D. Choi, S. Fink, D. Grove, M. Hind, V. Sarkar, M. Serrano, V. Sreedhar, H. Srinivasan, and J. Whaley. The Jalapeño Dynamic Optimizing Compiler for Java. Java Grande Conference, 1999, pp. 129-141. [8] J. Dean, D. Grove, and C. Chambers. Optimization of ObjectOriented Programs Using Static Class Hierarchy Analysis. ECOOP 1995, pp. 71-101. [9] D. Detlefs and O. Agesen, Inlining of Virtual Methods. ECOOP 1999, pp. 258-278. [10] D.R. Engler, W.C. Hsieh, and M.F. Kaashoek. ‘C: A language for high-level, efficient, and machine-independent dynamic code generation. Symposium on Principles of Programming Languages, January 1996, pp. 131-144. [11] B. Grant, M. Philipose, M. Mock, C. Chambers, and S. Eggers, An Evaluation of Staged Run-Time Optimizations in DyC. Conference on Programming Language Design and Implementation, May 1999, pp. 293-304.
25
[12] J. Gosling, B. Joy and G. Steele. Specification. Addison-Wesley, 1996.
The Java Language
[21] M. Plezbert and R. Cytron, Does “Just in Time” = “Better Late Than Never”? Symposium on Principles of Programming Languages, 1997, pp. 120-131.
[13] U. Hölzle, C. Chambers, and D. Ungar. Optimizing Dynamically-Typed Objected-Oriented Languages With Ploymorphic Inline Caches. ECOOP’91 conference proceedings, 1991. Published as Springer Verlag Lecture Notes in Computer Science 512.
[22] J.M. Stichnoth, G.-Y. Lueh, and M. Cierniak. Support for Garbage Collection at Every Instruction in a Java Compiler. Conference on Programming Language Design and Implementation, May 1999, pp. 118-127.
[14] U. Hölzle and D. Ungar. Optimizing Dynamically-Dispatched Calls with Run-Time Type Feedback. Conference on Programming Language Design and Implementation, Orlando, FL, June 1994, pp. 326-335.
[23] Standard Performance Evaluation Corporation. SPEC JVM98 Benchmarks. Available at http://www.spec.org/osg/jvm98 [24] Sun Microsystems, Inc. Java Virtual Machine Debug Interface Reference. Available at: http://java.sun.com/products/jdk/1.3/docs/guide/jpda/jvmdi-spec.html.
[15] U. Hölzle, C. Chambers, and D. Ungar. Debugging Optimized Code with Dynamic Deoptimization. Conference on Programming Language Design and Implementation, June 1992, pp. 32-43.
[25] Sun Microsystems, Inc. The Java Hotspot Performance Engine Architecture. Available at http://java.sun.com/products/hotspot/whitepaper.html.
[16] Intel Corp. Intel Architecture Software Developer’s Manual, order number 243192. 1997 [17] Intel Corp. Intel IA-64 Architecture Software Developer's Manual, order number 245319. 2000 [18] S. Lee, B.-Y. Yang, K. Ebcio÷lu and E. Altman. On-Demand Translation of Java Exception Handlers in the LaTTe JVM Just-In-Time Compiler. Workshop on Binary Translation. Newport Beach, CA. October 1999. [19] T. Lindholm and F. Yellin. The Java Virtual Machine Specification. Second Edition. Addison-Wesley, 1999. [20] M. Leone and R. K. Dybvig. Dynamo: A Staged Compiler Architecture for Dynamic Program Optimization. Technical Report #490, Indiana University, 1997
26