JOURNAL OF APPLIED PHYSICS 107, 033907 共2010兲
Precessional dynamics of Ni45Fe55 thin films for ultrahigh frequency integrated magnetics Jeffrey F. Godsell, Santosh Kulkarni, Terence O’Donnell, and Saibal Roya兲 Microsystems Centre, Tyndall National Institute, University College Cork, Lee Maltings, Cork, Ireland
共Received 29 July 2009; accepted 19 November 2009; published online 4 February 2010兲 Future monolithic point of load switched mode power supplies will be expected to meet the energy requirements of miniaturized, high functionality electronic devices. Recently, Ni45Fe55 has emerged as a potentially important material choice for use as a soft magnetic core material within high frequency integrated passive magnetic components. The operating frequency range of the integrated passives which form a key part of the point of load power supply must increase to allow for inductor/transformer miniaturization to become monolithic with power integrated circuits. In this work, an analysis of the high frequency permeability spectra of an electroplated Ni45Fe55 thin film has been carried out to quantitatively analyze the material’s high frequency performance. Complex permeability spectra of the film have been investigated at frequencies up to 9 GHz to identify both the film’s spectroscopic splitting factor 共g兲 and its effective dimensionless damping parameter 共␣兲. The Kittel equation is utilized to identify g as 2.128, while ␣ is determined to be approximately 0.045. The critically damped condition for the film is also examined to extract ␣ in the critically damped case under a range of externally applied bias fields. It is concluded that for monolithic power inductors, improved device performance can be achieved when the ferromagnetic core is in an underdamped state up to a critical frequency. © 2010 American Institute of Physics. 关doi:10.1063/1.3276165兴 I. INTRODUCTION
Magnetic thin films having high saturation magnetization, high permeability, and low losses at high frequencies have been intensively studied due to their significance in a range of applications. Examples include, integrated inductors, transformers, magnetic random access memory 共MRAM兲 elements, magnetic recording heads, and rf circuits. The ultrahigh frequency soft magnetic properties of core materials constitute some of the key requirements for thin film inductors,1 coupled inductors,2 and transformers3 to achieve increased efficiencies. This increases their applicability for use in monolithic voltage converter topologies embedded in miniaturized handheld electronic devices. In this work, we examine the high frequency permeability spectrum of Ni45Fe55 thin films to examine the limit of their usable frequency range. This information will become increasingly important as the material is pushed to operate at ever greater frequencies in such applications as monolithic on-chip inductors and transformers. To allow for the passive magnetic circuit elements to be integrated onto a silicon substrate, a reduction in the component’s physical size is needed. This size reduction necessitates an increase in the component’s operating frequency. Ni45Fe55 represents a potentially important alloy composition due to its higher saturation magnetization, higher anistropy field and lower conductivity when compared to Permalloy 共Ni80Fe20兲. These material qualities make Ni45Fe55 a more suitable choice for use as core material in monolithic on-chip microinductors or transformers. Electroplated a兲
Electronic mail:
[email protected].
0021-8979/2010/107共3兲/033907/8/$30.00
Ni45Fe55 was first introduced for use in hard disk write heads by IBM in 1997 and was adopted as a standard in the thin film write head industry after Permalloy,4 highlighting the material’s potential. Electroplated Ni45Fe55 thin films have also previously been incorporated into microinductors operating up to 100 MHz.5 While ferromagnetic resonance 共FMR兲 studies on Ni80Fe20 films have been widely reported,6,7 to date there have been very limited reports on losses in Ni45Fe55 thin films at gigahertz frequencies. At lower frequencies eddy currents and hysteresis loss dominate, however as the frequency is increased, further losses due to FMR may become important. For example, converters with switching frequencies as high as 480 MHz have already been reported8 and even higher operating frequencies may follow in the near future. It is known that the relaxation processes within a magnetic film determine the maximum permissible switching speed of the material. These processes become increasingly important for the design of passive magnetic circuit components as they are considered for operation into the gigahertz frequency range. The magnetic dimensionless damping parameter 共␣兲 for ferromagnetic thin films quantifies one of the limiting factors in the high speed switching of magnetic thin films at elevated frequencies. In this study, the effective dimensionless damping constant 共␣兲 of an electroplated Ni45Fe55 thin film is determined experimentally at operating frequencies up to 9 GHz. The spin dynamics of the material are described by the Landau–Lifshitz–Gilbert 共LLG兲 equation of motion 共1兲, ជ the where M the magnetization, ␥ the gyromagnetic ratio, H effective field, and 共␣兲 the phenomenological effective dimensionless damping parameter are input terms.9
107, 033907-1
© 2010 American Institute of Physics
033907-2
J. Appl. Phys. 107, 033907 共2010兲
Godsell et al.
冉
冊
ជ ជ M M ␣ ជ ⫻H ជ eff + eff M ជ ⫻ . = − ␥M t Ms t
共1兲
The spectroscopic splitting factor 共commonly referred to as the Landé g-factor兲 additionally provides information on the separation of the contributions from orbital and spin moments. The g-factor is important in FMR studies and is experimentally determined using the Kittel equation 共2兲10 共as outlined later兲, where f FMR is the ferromagnetic resonant frequency, ␥ is the gyromagnetic ratio, 0 is the permeability of free space, M s is the saturation magnetization, Hk is the anisotropy field, and Hbias is the bias field. f FMR = 共␥/2兲0冑M s共Hk + Hbias兲
共2兲
The use of electroplating for thin film deposition has the advantage of full integration compatibility with current complementary metal-oxide semiconductor fabrication technologies. This thin film deposition technique is also fast, inexpensive, and lends itself readily to the three dimensional topology of many device structures. By performing complex permeability measurements on the as electroplated samples and by deconvoluting the resulting spectrum into its real and imaginary components, the spectroscopic splitting factor of the as deposited films is identified. The effective damping parameter 共␣兲 is subsequently determined by comparing the experimentally measured permeability spectrum to a simulated spectrum, derived from a combined LLG and eddy current based model. Finally, critically damped conditions have been determined for a range of bias fields. II. EXPERIMENT
Ni45Fe55 films were galvanostatically deposited using a dc plating technique; details of the plating process have previously been reported.11 The films were electrodeposited at a constant current density of 3 mA/ cm2. Pt/Ti pieces were used as anode and silicon wafer pieces 共⬃2 cm2 area兲 with a sputtered Ti共20 nm兲/Cu共50 nm兲 seed layer were used as the cathode 共subsequently referred to as Si/Ti/Cu substrates兲. In determining the appropriate seed layer thickness a compromise was met: thin enough to minimize eddy current contributions from the seed layer while also being thick enough to facilitate the electrodeposition at the required current density. The films were deposited in the presence of a magnetic field ⬃13.5 kA/ m 共⬃170 Oe兲, in order to induce a uniaxial anisotropy in the film. The electrodeposited film was visually smooth, shiny, and showed good adhesion to the substrate. The surface morphology and compositions of the plated film was characterized using scanning electron microscopy and energy dispersive x-ray 共EDX兲 diffraction, respectively. The film composition was confirmed to be close to Ni45% Fe55% by EDX analysis. The static magnetic properties of a square sample were measured in an SHB Instruments hysteresis loop tracer 共model: Mesa 200HF兲. The use of a square sample minimized the effects of shape anisotropy. The complex permeability was measured using a wide band 共1 MHz–9 GHz兲 Ryowa permeameter 共model: PMM-9G1兲, operating on the vector network analyzer FMR technique 共VNA-FMR兲. The
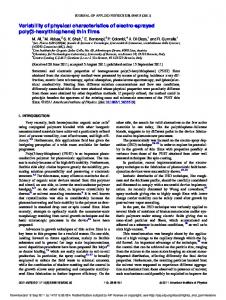
FIG. 1. Film thickness determined using a dual beam FIB. From the bottom up, the film layers are Si, Ti, Cu, NiFe, and Pt 共Pt was only deposited locally prior to FIB milling to ensure accurate layer thickness measurements兲.
film thickness was determined using a dual beam focused ion beam 共FIB兲 共model: FEI Nova 600兲, as shown in Fig. 1. The figure shows the thickness of the Ti/Cu seed layer to be approximately 29 nm Ti and 46 nm Cu with the NiFe electrodeposited thin film being approximately 390nm.
III. THEORETICAL FRAMEWORK FOR INDUCTOR DESIGN
When designing a thin film inductor core, the general premise is to find an optimum film thickness. One must balance the need for maximum inductance enhancement on the one hand and minimum eddy current loss on the other. Inductance is proportional to the thickness of the magnetic core as shown in the following equation:5 L=
N2tlcore , lm
共3兲
where L is the inductance in Henrys 共H兲, t is the thickness of the core in metres 共m兲, is the permeability of the core material 共H/m兲, N is the number of turns of the inductor, lcore is the core length 共m兲, and lm is the magnetic path length 共m兲. By incorporating a ferromagnetic core material into an integrated inductor, an inductance enhancement is achieved over a simple air core inductor. Coreless 共air core兲 inductors are popular for many applications in the rf range because of their high efficiencies at low power levels. These inductor cores performed quite well with high Q values 共⬃60兲 in the GHz frequency range without the need for a ferromagnetic core; however, due to their low energy density, air core inductors lack suitability for power applications. For these applications ferromagnetic cores are needed to increase the inductance on a given area footprint. In powering integrated circuits, monolithic inductors will generally be incorporated into buck converter or similar topologies.
033907-3
J. Appl. Phys. 107, 033907 共2010兲
Godsell et al.
The duty cycle of such a buck converter is given by D=
Vo Ton = , Vin Ton + Toff
共4兲
where D is the duty cycle, Vo is the output voltage for the buck converter, Vin is the input voltage to the buck converter, Ton is the on-time of the semiconductor switch in the converter, and Toff is the off-time of the switch. The required inductance to maintain the output voltage for a given ripple current across the inductor is dependent on the switching rate of the converter through Eq. 共5兲 as shown below VoToff , L= ⌬i
共5兲
where ⌬i is the ripple current across the inductor. To decrease the value of inductance required to meet the needs of the integrated buck converter, the value of Toff must be decreased as both Vo and ⌬i are fixed as constants by the application. The duty cycle too is fixed by the required output voltage according to Eq. 共4兲. An increase in the switching frequency of the buck converter will therefore be required. The inductance in henrys 共H兲 is related to the physical size of the inductor as shown by Eq. 共3兲. Increasing the switching frequency to decrease the physical size of an integrated passive magnetic component will bring with it an increase in the switching related loss mechanisms within the core such as eddy current losses. The cutoff frequency as shown in Eq. 共6兲 is the frequency at which the skin depth is equal to the film thickness. fc =
, t r o
共6兲
2
where is the resistivity, o is the permeability of free space, and r is the relative permeability. By targeting a particular operating frequency and using the following material properties of Ni45Fe55, = 45 ⍀ cm and r = 0.9t−0.5 for a thin film, Eq. 共6兲 can be rearranged as shown in Eq. 共7兲. The relation r = 0.9t−0.5 is an empirically derived relationship for Ni45Fe55 thin films as previously reported.5
冑冋 3
t=
共0.9兲f c0
册
2
共7兲
.
Equation 共7兲 can then be used to give the optimum film thickness at a particular operating frequency. For this study, an operating frequency of 500 MHz was targeted, which yielded a desired film thickness of 400 nm. This thickness represents an acceptable compromise core thickness between inductance enhancement and eddy current loss. Hence, a Ni45Fe55 film with an average thickness of ⬃390 nm was electrodeposited using the technique described earlier.
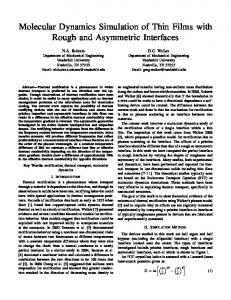
FIG. 2. 共Color online兲 Hysteresis loop measurement for Ni45Fe55 thin film sample as measured on SHB hysteresis loop tracer.
IV. RESULTS AND DISCUSSION
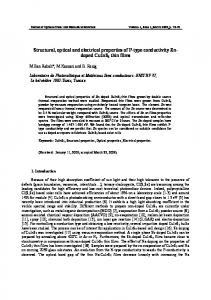
The as measured static magnetic properties of the Ni45Fe55 thin film are listed in Table I, while a typical hysteresis loop measurement for the easy and hard axes are displayed in Fig. 2. FMR occurs when the frequency of an applied microwave field matches the characteristic precessional frequency of the atomic magnetic spins within the film. Both the peak frequency 共f p兲 of the imaginary component of the complex permeability spectrum 共r⬙兲 and the zero crossing frequency 共f o兲 of the real component of the complex permeability spectrum 共r⬘兲 are generally considered to be a good estimate of the FMR frequency of the film 共as shown in Fig. 3兲. As evident in Fig. 3 and again later in the analysis in Fig. 6, a clear FMR peak is present across all the bias fields examined. The VNA-FMR technique was employed in the characterization of the permeability spectrum. This technique allows for operation over extended ac frequencies concurrent with the application of orthogonal static longitudinal bias fields. The calculation of complex permeability is hence enabled by the measurement of the standard microwave S-parameters on the VNA. The ac field is applied along the hard axis, while a range of static bias fields are applied in the same plane but perpendicular to the ac field, and parallel to the easy axis 共see Fig. 4兲. By incrementally increasing the static magnetic field strength parallel to the easy axis while sweeping the ac field in the plane of the hard axis, the FMR frequency is observed to increase in line with the static field as illustrated in Figs. 5 and 6.
TABLE I. Ni45Fe55 thin film properties. Hc easy axis 共A/m兲
Hc hard axis 共A/m兲
Hk 共A/m兲
Bs 共T兲
Thickness 共nm兲
232
192
674
1.6
390
FIG. 3. 共Color online兲 Typical graph of relative complex permeability for a 9950 A/m 共⬃125 Oe兲 bias field applied along the easy axis of the film.
033907-4
J. Appl. Phys. 107, 033907 共2010兲
Godsell et al.
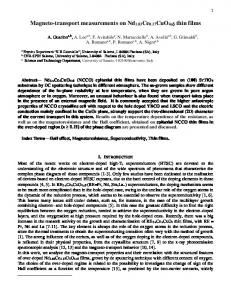
FIG. 4. 共Color online兲 Schematic representation of the experimental setup in a commercial Ryowa PMM-9G1. The sample is slid into the detection coil 共into the plane of the page兲 which is situated within the rf cavity which in turn is positioned within the center of a dc field coil. The field coil is one single coil and slides over the rf cavity and the sample after the sample is loaded.
The increase in the FMR frequency with field strength is due to the increased precessional frequency of the spins with larger externally applied field strengths consistent with the gyromagnetic effect. This effect describes how an increase in applied field strength will act to raise the frequency of precession, but in the theoretical undamped case will not act to bring the moment and field into parallel alignment. Hence the change in 共moment of the atoms兲 is perpendicular to both and to B 共magnetic field兲. Rather than turning toward B, the magnetic field causes the direction of to precess around B, the larger the value of B then the greater the speed of the precession. In Sec. IV A below the Kittel equation together with the measured FMR frequencies are utilized to determine the film’s g-factor.
A. Spectroscopic splitting factor „g-factor…
Apart from magnetic x-ray dichorism and magnetic neutron scattering, measurement of the g-factor is the only experimental method which provides information on the separation of the contributions from the orbital and spin moments to the total magnetic moment.12 Due to the innate difficulties associated with the calculation of Landé g-factors, an experimental approach to their determination is usually adopted.
FIG. 5. 共Color online兲 ⬘ vs frequency for a range of bias fields applied along the film’s easy axis.
FIG. 6. 共Color online兲 ⬙ vs frequency for a range of bias fields applied along the film’s easy axis.
Since ␥ from Eq. 共2兲 can be shown to be equal to
␥ = gB/ប,
共8兲
where g is the g-factor, B is Boltzmann’s constant, and ប is h / 2 where h is Planck’s constant. The g-factor can subsequently be determined from the experimental results through an isolation of the gyromagnetic ratio ␥. By rewriting Eq. 共2兲 in the form of the equation of a straight line 关as shown in Eq. 共9兲兴 and plotting the square of the experimentally measured FMR frequencies against the applied dc bias fields 共HBias兲 共as shown in Fig. 7兲, the value of g can be determined from the slope of the resulting line. f FMR2 =
␥ 2 02 M s ␥ 2 02 M sH k H + . Bias 42 42
共9兲
The square of the FMR frequencies can hence be exploited to identify the g-factor of the material in the as deposited thin film. The experimentally determined values of g using this approach are shown in Table II below. The slight difference between the g-factor calculated from the f p and f o may be accounted for by the variation in f p and f o, which in turn has been reportedly attributed to the possible existence of higher order magnetostatic modes within the film.10 The g-factor is, to a first order approximation, expected to range from 1 to 2.
FIG. 7. 共Color online兲 Graph showing square of FMR frequency vs applied bias field, squares and dots are from the measured values of f o and f p respectively, the solid line is the best fit line to the experimentally derived data points.
033907-5
J. Appl. Phys. 107, 033907 共2010兲
Godsell et al.
TABLE II. Experimentally determined g-factors based on f p and f o. g-factor extracted from f p data
g-factor extracted from f o data
Average g-factor
Average ␥
2.154
2.102
2.128
1.87⫻ 1011
When there is no resultant orbital contribution to the overall moment g = 2, whereas g = 1 when there is no resultant spin contribution to moment 共i.e., the spins cancel兲. g-factors greater than 2 exist due to the fact that in a crystal lattice, atoms interact through the crystalline field, which in turn quench the orbital moments. This quenching, however, can be seen to slightly lessen when spin orbit interactions are considered as the spins may carry an amount of orbital moment with them. Hence, if parallel orientations of the spin and orbital moments are favored by the sign of the spin orbit interaction, then g will exceed 2 and the total magnetic moment will be greater than that of spin alone. After the experimental measurement of the g-factor, all of the relevant material constants have been identified, allowing for the effective dimensionless damping constant 共␣兲 to be determined using the approach as outlined in the subsequent section. B. Dimensionless effective damping constant ␣
With the identification of the effective damping constant ␣, a material’s dynamic high frequency response can be fully predicted allowing for future passive magnetic circuit component’s design, prototyping and analysis. The FMR peak in the 共⬙兲 spectrum 共see Fig. 6兲 represents a loss within the material due to the conversion of the energy associated with the oscillatory motion of the electron spins to heat within the material. An analysis of the material’s damping is used to quantify this effect; if there is zero damping then the magnetization will never align with the applied field and will simply precess around the applied field direction. Conversely if the damping is very large, then the magnetization will align itself with the applied field; however, this will occur relatively slowly. Between the two extremes lies critical damping which results in the fastest permissible magnetic switching rate. In this study, the effective dimensionless damping parameter ␣ is identified by fitting a simulated spectrum, which is derived from a coupled LLG and eddy current model to the measured microwave permeability spectrum. Eddy current effects often complicate the analysis of the FMR phenomenon; however, their effects are included in the effective damping parameter reported here in Fig. 11. This is evident in a broader tail on the lower frequency side of the FMR peak on the ⬙ curve as opposed to the sharper tail on the higher frequency side of FMR peak as apparent in Fig. 6. In general, due to eddy current complications of the spectrum, the net cumulative effects of eddy currents are often dealt with by assuming quasistatic conditions or that the currents are accounted for in the damping parameter of the LLG equation itself. In this study, a built-in LLG and eddy current simulator available with the Ryowa permeameter was employed. This software combined the effects of eddy currents
FIG. 8. 共Color online兲 Measured and simulated complex permeability spectra for 9947 A/m 共⬃125 Oe兲 bias field applied.
and FMR in a method similar to that previously reported,13,14 which simultaneously solve Ampère’s 关Eq. 共10兲兴 and Faraday’s laws 关Eq. 共11兲兴 with the LLG Eq. 共1兲
ជ eddy ⬇ E, ⵜ⫻H
ជ = − 0 ⵜ⫻E
冋
共10兲
册
ជ applied M ជ H + . t t
共11兲
The following as measured input parameters were used in the simulation: film thickness= 390 nm, M s = 1.65 T, Hk = 674.2 A / m, resistivity 共兲 = 45 ⍀ cm, g = 2.128, while ␣ was allowed to vary as the free parameter. Figures 8–10 show an example fitting of measured data sets to simulated spectra 共critical damping curves are also included as discussed later兲, while Fig. 11 shows the both the value of ␣ and that of ␣critical resulting from a range of applied longitudinal dc bias fields. The good fitting of the simulated to the measured spectra as illustrated in Figs. 8–10 validates the assumption that FMR and eddy current effects are the dominant loss mechanisms. Any minor deviations between the spectra is likely attributed to such effects as, magnetic inhomogeneities, twomagnon contributions, scattering of the uniform precession mode, and various local FMR frequencies, etc. While these parasitic effects are relatively small in comparison to the
FIG. 9. 共Color online兲 Measured and simulated complex permeability spectra for 13 925 A/m 共⬃175 Oe兲 bias field applied.
033907-6
J. Appl. Phys. 107, 033907 共2010兲
Godsell et al.
FIG. 10. 共Color online兲 Measured and simulated complex permeability spectra for 17 904 A/m 共⬃225 Oe兲 bias field applied.
dominant loss mechanisms, their effects are likely to contribute toward the slight line broadening as illustrated in Figs. 8–10 below. By running the experiments with relatively large applied dc bias fields, the model was seen to consistently fit quite well with the measured permeability spectra. It was, however, noted that at lower bias fields the modeled and measured spectra were seen to be divergent regardless of the value of ␣. While the reasons for this lack of agreement between simulated and measure spectra remain unclear, it may be due to changes in film anisotropy with bias field or it may possibly be attributed to very large eddy current effects which are reported to significantly broaden the line widths, particularly for devices with thick Fe elements.15 However these large eddy current effects became progressively damped out at larger applied bias fields which could be similar to a high bias scenario in integrated inductors for power applications. The classical eddy current power loss equation16 in W / cm3 is given by P=
2t 2B 2 f 2 , 共6 ⫻ 1016兲
共12兲
where t is the thickness in centimeters, B is the flux amplitude at the surface in gauss, f is the frequency in hertz, and is the resistivity in ohm centimeters. It can be seen from Eq.
共12兲 above that eddy current power loss is proportional to B2. B in turn is related to the external bias field strength through the permeability , which will itself decrease with increased dc bias fields applied as illustrated in Fig. 5. The latter is attributed to the fact that when the bias field is aligned with the easy axis then the permeability can be written in first order approximation as r = 关M s / 共Hk + Hbias兲兴 + 1, as B = H = roH, increasing Hbias means that B will approach a roughly constant value. Figure 2 shows that the films are effectively saturated at a 2000A/m applied bias field. As such, all FMR experiments on the films are conducted with applied bias field strengths of several times that required to saturate the film. Eddy current contributions to the effective damping parameter will therefore decrease only marginally over the range of bias fields studied. Hence, the slight variation in ␣ as shown in Fig. 10 cannot be quantifiably attributed to any physical mechanisms, as the slight upward trend was small enough to be attributed to the inherent error associated with the experimental procedure. Figures 5 and 6 show that within the range of externally applied bias fields studied, the film’s permeability remains almost constant up to the point where the effects of FMR dominate. As previously stated, the value of ␣ is very important in modeling the high frequency dynamic response of the film as used in monolithic magnetic applications. Subsequent to the determination of the phenomenological value of ␣ for the Ni45Fe55 film, the resulting numeric value can be compared to the film’s theoretical optimum critical damping 共␣critical兲 value. It has previously been reported that the damping constants of thin magnetic films will appreciably change the bandwidth of the permeability spectra. For example, if the damping constant of CoFeN is increased fivefold from 0.02 to 0.1 then the spectral bandwidth of the permeability is also reported to increase fivefold.17 If the film is critically damped then this traditionally represents the optimum condition for high speed switching, where the system will reach equilibrium in the shortest possible time. The phenomenologically derived critical damping condition for a ferromagnetic thin film which results in the fastest permissible switching speed has previously been reported. Assuming a uniaxial anisotropy and small signal excitations, the critical damping condition is given by Eq. 共13兲 below.
␣critical = 2
冑
1 , 0
共13兲
where
0 =
FIG. 11. 共Color online兲 Effective dimensionless damping parameter plotted against applied bias field for the thin film, both experimentally derived and the theoretical critically damped values are shown.
Ms Hk + Hbias
共14兲
is the relative dc susceptibility10 and Hbias is the dc bias field applied along the easy axis. It is known that the damping will affect the manner in which the magnetization will relax toward equilibrium. For certain applications such as hard disk magnetic write heads, MRAM, band-stop filters, or read sensors, an increased damping may be desirable as it will reduce unwanted oscillations associated with ringing which will accompany high speed switching. For other applications such as notch filters,
033907-7
J. Appl. Phys. 107, 033907 共2010兲
Godsell et al.
a small damping is required. For the application under investigation 共planar inductors and transformers兲 where operating frequencies may potentially reach into the gigahertz frequency range, a rudimentary analysis of the effects of damping is warranted. For the NiFe film, at zero applied bias field the value of critical damping is calculated to be 0.0446. Here, ␣critical is calculated to range between 0.179 for an applied bias field of 9947 A/m up to 0.237 for an applied bias field of 17904 A/m; simulations of the critically damped film’s real and imaginary permeability spectra are included in Figs. 8–10. The measured permeability spectra are overlaid onto the simulated spectra for comparative purposes. It is seen that the film is in a strongly underdamped state, in fact since the value of ␣ is less than 0.18 for the plated thin film over all of the bias fields examined, the film remains at all times in the underdamped state. The latter is not uncommon and in fact, most magnetic thin films are reported to show underdamped behavior.17 In the underdamped case a ferromagnetic film will experience a classical underdamped ringing in the time domain upon switching. It can be seen in Figs. 8–10 that in the underdamped situation the permeability roll-off of the real part of the permeability spectra 共r⬘兲 occurs at higher frequencies than in the critically damped case. Conversely it can be seen that above a certain frequency the losses in the film 共as evident in the r⬙ curve兲 reach the largest magnitudes in the underdamped condition. For an inductor application both a high permeability roll-off frequency and a low film loss are desirable. With this in mind the underdamped condition appears to be more desirable than the critically damped case provided the device only operates within the range of frequencies where the device’s real permeability 共r⬘兲 remains constant. For example, in the case of the 9947 A/m applied bias field at frequencies of up to 1.5 GHz the underdamped condition provides a higher real permeability 共r⬘兲 and a lower imaginary permeability 共r⬙兲 than the critically damped cases. For a power inductor application where a lower power loss is more important than a faster switching speed, the underdamped condition will be more desirable than the critically damped one, as the lower the damping the lower the losses in the system up to a critical frequency 共f critical兲 as shown in Fig. 8. The critical damping value will increase as the in-plane net magnetic field along the easy axis is increased, hence, a more underdamped condition may be achieved by changing the external magnetic field strength. By increasing the net in-plane magnetic field strength through, for example, the use of shape or induced anisotropy effects, the possibility exists to increase the value of critical damping within the film, thereby leaving the film in a progressively more underdamped state. This can be explained through an examination of Eqs. 共13兲 and 共14兲, the anisotropy field of a sample can be modified by changing the shape of the material. This in turn can change the critical damping value of the sample, in the lower damping case 共more underdamped兲, the real part of the complex permeability spectra will in general display a higher roll-off frequency as illustrated in Fig. 5. From Fig. 11 it would appear that ␣experimental is relatively invariant with bias field applied. The latter
would imply that the changes in the permeability spectra associated with H 共Hbias or Hk兲 applied are primarily attributed to the reduction in o 共and hence 兲 with increasing H as outlined in Eq. 共14兲 and also to the increase in FMR frequency with H as outlined in Eq. 共2兲. Control of these bias/anisotropy field effects will allow for a tailoring of the film’s frequency domain permeability response to achieve improved characteristics for the final device at elevated frequencies. Further work may focus on optimizing the films to achieve the most desirable damped state, one which has both lower film losses and a constant value of r⬘ over the operating frequency range of the device. This has been shown to be characteristic of the underdamped case at low to subgigahertz frequencies. The design optimization of a film’s damping state is likely to become of increased importance in the future for monolithic inductor applications as ferromagnetic materials are incorporated into devices who’s frequency bandwidth will increasingly extend up into the gigahertz range. V. CONCLUSIONS
In this work the g-factor, complex permeability spectra and the effective damping constant have been reported for a Ni45Fe55 thin film electrodeposited onto Si/Ti/Cu substrates. The simulated contribution of the eddy current effects toward the dynamic behavior of the film, coupled with the LLG equation were employed in correlating simulated and measured results. This correlation was in turn utilized to identify the key material parameter dictating the system’s spin dynamics, principally the effective damping parameter ␣. The losses due to eddy currents were shown to be relatively invariant within the range of bias fields of interest. The film displayed FMR frequencies above 2 GHz highlighting this material’s potential for application in future integrated inductors operating up well into the hundreds of megahertz frequency range. A discussion on the damping present in the film postulated that an underdamped film state is likely to be the more desirable state for a monolithic inductor or transformer application. ACKNOWLEDGMENTS
This work has been financially supported by Science Foundation Ireland, Grant No. SFI–PI–06/IN.1/I98. Enterprise Ireland Grant for the competence centre in microelectronics 共MCCI兲 No. PHMIS CC-2008-2403 is further acknowledged. 1
N. Wang, T. O’Donnell, R. Meere, F. M. F. Rhen, S. Roy, and C. O’Mathuna, IEEE Trans. Magn. 44, 4096 共2008兲. 2 S. Prabhakaran, T. O’Donnell, C. R. Sullivan, M. Brunet, S. Roy, and C. O’Mathuna, J. Magn. Magn. Mater. 290–291, 1343 共2005兲. 3 N. Wang, T. O’Donnell, S. Roy, S. Kulkarni, P. Mccloskey, and C. O’Mathuna, IEEE Trans. Magn. 43, 2719 共2007兲. 4 P. C. Andricacos and N. Robertson, IBM J. Res. Dev. 42, 671 共1998兲. 5 T. O’Donnell, N. Wang, S. Kulkarni, R. Meere, F. M. F. Rhen, S. Roy, S. C. O’Mathuna, J. Magn. Magn. Mater. 共in press兲. 6 Y. Zhuang, M. Vroubel, B. Rejaei, and J. N. Burghartz, J. Appl. Phys. 97, 10N305 共2005兲. 7 N. Inaba, H. Asanuma, S. Igarashi, S. Mori, F. Kirino, K. Koike, and H. Morita, IEEE Trans. Magn. 42, 2372 共2006兲.
033907-8 8
J. Appl. Phys. 107, 033907 共2010兲
Godsell et al.
G. Schrom, P. Hazucha, J. Hahn, D. S. Gardner, B. A. Bloechel, G. Dermer, S. G. Narendra, T. Karnik, and V. De, Proceedings of the IEEE Power Electronics Specialists Conference 共PESC ‘04兲, Aachen, Germany, 2004, in PESC Record, p. 4702. 9 K. Seemann, H. Leiste, and A. Kovas, J. Magn. Magn. Mater. 320, 1952 共2008兲. 10 N. X. Sun, S. X. Wang, T. J. Silva, and A. B. Kos, IEEE Trans. Magn. 38, 146 共2002兲. 11 S. Roy, A. Connell, M. Ludwig, N. Wang, T. O’Donnell, M. Brunet, P. McCloskey, C. O’Mathúna, A. Barman, and R. J. Hicken, J. Magn. Magn. Mater. 290–291, 1524 共2005兲.
12
J. Pelzl, R. Mechenstock, D. Spoddig, F. Schreiber, J. Pflaum, and Z. Frait, J. Phys.: Condens. Matter 15, S451 共2003兲. 13 G. Hrkac, T. Schrefl, O. Ertl, D. Suess, M. Kirschner, F. Dorfbauer, and J. Fidler, IEEE Trans. Magn. 41, 3097 共2005兲. 14 L. Torres, L. Lopez-Diaz, E. Martinez, and O. Alejos, IEEE Trans. Magn. 39, 2498 共2003兲. 15 Y. V. Khivintsev, B. K. Kunar, I. Harward, R. E. Camley, and Z. Celinski, J. Appl. Phys. 99, 08P512 共2006兲. 16 B. D. Cullity and C. D. Graham, Introduction to Magnetic Materials, 2nd ed. 共Wiley, New York, 2009兲, p. 443. 17 N. X. Sun and S. X. Wang, IEEE Trans. Magn. 40, 253 共2004兲.