MOLECULAR AND CELLULAR BIOLOGY, July 1997, p. 4043–4050 0270-7306/97/$04.0010 Copyright © 1997, American Society for Microbiology
Vol. 17, No. 7
Precise Switching of DNA Replication Timing in the GC Content Transition Area in the Human Major Histocompatibility Complex TOYOAKI TENZEN,1* TETSUSHI YAMAGATA,1 TATSUO FUKAGAWA,1† KIMIHIKO SUGAYA,1‡ ASAKO ANDO,2 HIDETOSHI INOKO,2 TAKASHI GOJOBORI,1 ASAO FUJIYAMA,1 KATSUZUMI OKUMURA,3 AND TOSHIMICHI IKEMURA1 Department of Evolutionary Genetics, National Institute of Genetics, and The Graduate University for Advanced Studies, Mishima, Shizuoka-ken 411,1 School of Medicine, Tokai University, Bohseidai, Isehara, Kanagawa-ken 259-11,2 and Faculty of Bioresources, Mie University, Tsu, Mie-ken 514,3 Japan Received 10 February 1997/Returned for modification 28 March 1997/Accepted 9 April 1997
The human genome is composed of long-range G1C% (GC%) mosaic structures thought to be related to chromosome bands. We previously reported a boundary of megabase-sized GC% mosaic domains at the junction area between major histocompatibility complex (MHC) classes II and III, proposing it as a possible chromosome band boundary. DNA replication timing during the S phase is known to be correlated cytogenetically with chromosome band zones, and thus the band boundaries have been predicted to contain a switch point for DNA replication timing. In this study, to identify to the nucleotide sequence level the replication switch point during the S phase, we determined the precise DNA replication timing for MHC classes II and III, focusing on the junction area. To do this, we used PCR-based quantitation of nascent DNA obtained from synchronized human myeloid leukemia HL60 cells. The replication timing changed precisely in the boundary region with a 2-h difference between the two sides, supporting the prediction that this region may be a chromosome band boundary. We supposed that replication fork movement terminates (pauses) or significantly slows in the switch region, which contains dense Alu clusters; polypurine/polypyrimidine tracts; di-, tri-, or tetranucleotide repeats; and medium-reiteration-frequency sequences. Because the nascent DNA in the switch region was recovered at low efficiency, we investigated whether this region is associated with the nuclear scaffold and found three scaffold-associated regions in and around the switch region. termination, pausing, and/or slowing of DNA replication fork movement. The human major histocompatibility complex (MHC) is known at a high-resolution level to be composed of plural bands (49, 53) and is functionally divided into three distinct regions from telomere to centromere: 2-Mb class I, 1-Mb class III, and 1-Mb class II (10). We previously reported that the MHC is composed of megabase-sized GC% mosaic domains (32, 34). By conducting bidirectional chromosome walking across a 450-kb region (22, 41, 54) spanning HLA-DRA (the AT-rich class II side) and CYP21 (the GC-rich class III side), Fukagawa et al. (21, 22) defined a boundary of the megabasesized GC% mosaic domains disclosing a sharp GC% transition and predicted that this transition region would represent chromosome band boundaries. In the present study, we examined replication timing for classes II and III and found that the replication timing switches precisely in the GC% transition region, supporting our previous prediction. Some characteristic sequences existed there, and these could be candidates for signals to switch replication timing.
The genomes of warm-blooded vertebrates, including humans, are composed of large-scale compartmentalized structures, one of which consists of long-range G1C% (GC%) mosaic structures. The mosaics of long-range regions (.300 kb) homogeneous in GC% are called isochores by Bernardi et al. (5). Several groups, including ours, showed that the GC% mosaic structures are related to chromosome bands (1, 5, 23, 28, 29, 31, 44). Giemsa-dark G bands are composed mainly of AT-rich sequences, whereas T bands (a subgroup of Giemsapale R bands) are composed mainly of GC-rich sequences: ordinary R bands are heterogeneous and appear to be intermediate in G1C content (3, 4, 12, 32–34, 47). Another aspect of genome compartmentalization is the replication time zone. Mammalian DNA replication timing is roughly divided into early S (SE) and late S (SL) phases (16, 25, 38); G-band zones replicate primarily during SL, whereas R-band zones, including T bands, replicate in SE (27). Therefore, band boundaries have been presumed to be precisely assignable at the nucleotide sequence level by identifying the early-to-late switch point for replication timing. We would predict that this region is where regulatory signals for DNA replication exist. Band boundaries should also be suitable for studying the mechanisms involved in
MATERIALS AND METHODS Cell culture and labeling. Human myeloid leukemia HL60 cells were grown as suspension cultures in RPMI 1640 medium supplemented with 10% fetal calf serum (Gibco BRL). The cell cultures were labeled with 0.1 mM [14C]thymidine (2.11 GBq/mmol; Amersham) for 3 days and synchronized at the G1/S boundary by two successive treatments with 1 and then 5 mg of aphidicolin (Sigma) per ml, an inhibitor of DNA polymerase a, as detailed by Tribioli et al. (56) and Pedrali-Noy et al. (43). After being washed with fresh medium to release the block, the cells were labeled with 75 mM bromodeoxyuridine (BrdUrd), an artificial analog of thymidine, and 0.04 mM [3H]deoxycytidine (925 GBq/mmol; Amersham) at 1-h intervals from the onset of the S phase for 6 h. The cells were killed with 0.02% NaN3, collected by centrifugation, and stored at 270°C.
* Corresponding author. Mailing address: Department of Evolutionary Genetics, National Institute of Genetics, Yata 1111, Mishima, Shizuoka-ken 411, Japan. Phone: 81-559-81-6788. Fax: 81-559-81-6794. E-mail:
[email protected]. † Present address: Department of Biochemistry, University of Oxford, Oxford, United Kingdom. ‡ Present address: National Institute of Radiological Sciences, Anagawa, Chiba-ken 263, Japan. 4043
4044
MOL. CELL. BIOL.
TENZEN ET AL.
TABLE 1. Primers used for PCR amplification Locus
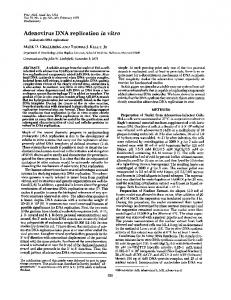
FIG. 1. Loci examined for replication timing in MHC classes II and III. Numbers indicate positions in the 450-kb region, spanning HLA-DRA to TNX, in kilobases. TNFA is 500 and 870 kb away from TNX and HLA-DRA, respectively.
Isolation of nascent DNA. Nascent DNA was purified by the method of Yoon et al. (57) and Contreas et al. (11). Nuclei isolated from the labeled cells were loaded directly onto 5 to 30% alkaline sucrose density gradients for size fractionation, and all the pooled fractions containing short DNA with high 3H but low 14C counts (mainly shorter than 5 kb) were subjected to CsCl density gradient centrifugation in a Beckman SW50.1 rotor (42,000 rpm for 48 h at 21°C). The fractions with high 3H but low 14C counts were again pooled and dialyzed against TBSE (10 mM Tris-HCl [pH 7.5], 150 mM NaCl, 0.1 mM EDTA). Nascent DNA was further purified on an immunoaffinity chromatography column with anti-BrdUrd antibodies (11). The eluate was treated with proteinase K, phenol, and chloroform followed by ethanol precipitation. All the steps were performed in the dark to prevent photodamage to BrdUrd DNA. Quantitation of nascent DNA by competitive PCR. Competitor DNA for individual genome sites was prepared by the method of Diviacco et al. (15) and was cloned into pT7Blue(R) (Novagen) to be introduced into Escherichia coli by transformation. The plasmids thus obtained were linearized with a restriction enzyme and were quantitated by spectrophotometric measurements. A constant 3 H disintegrations per minute for nascent DNA from each interval was coamplified with a constant amount of the competitor DNA in a single tube by using PCR with 32 cycles of 15 s at 94°C, 15 s at 56 to 60°C, and 20 s at 72°C in a model 9600 thermal cycler (Perkin-Elmer). Different PCR conditions (annealing temperature and ratio of nascent DNA to competitor DNA) were also tested. Each amplified product from the nascent DNA was 190 to 200 nucleotides (nt) in length, and the competitor DNA had an additional 17-nt insertion in the middle of the amplified region. PCR products were separated by electrophoresis through 8% polyacrylamide gels and stained with the fluorescent dye CYBR GREEN I (Molecular Probes Inc.). Bands were visualized and quantitated with a FluorImager SI (Molecular Dynamics). The amount of nascent DNA was then calculated by comparison with the competitor band. Isolation of SARs. Scaffold-associated regions (SARs) were isolated by the method developed by Jackson et al. (35, 36). HL60 cells were encapsulated in low-melting-temperature agarose and treated with 0.5% Triton X-100 either in the physiological buffer (35, 36) or in a solution containing 2 M NaCl, 10 mM Tris-HCl (pH 7.5), and 1 mM EDTA. The nuclear halos obtained in either solution were then treated with a restriction endonuclease (EcoRV or HaeIII) for 20 min at 32°C, and half was subjected to electrophoresis to purify fragments containing an SAR. The other half was not electroeluted, permitting recovery of the total chromosomal DNA. After treatment with proteinase K (200 mg/ml), both agarose samples were melted and DNA was recovered with QIAEX II (Qiagen). The DNA content of the two samples for each site was determined by using the aforementioned competitive PCR protocol. Nucleotide sequence accession no. The 5.7-kb sequence between the SR and NCT loci has been deposited in the GenBank database under accession no. AB000565.
RESULTS GC% distribution in MHC classes II and III, and sites examined for DNA replication timing. Figure 1 shows the genomic structure of the 450-kb region where we previously conducted bidirectional chromosome walking (22, 54). By analyzing the GC% distribution in the 450-kb region and other parts of the MHC compiled in the international DNA databases, Fukagawa et al. (22) defined the boundary for megabase-sized mosaic domains as a sharp GC% transition region (see Fig. 4). We postulated this transition to be a chromosome band boundary (22). Although we have not determined the complete sequence of the 450-kb region, sequences obtained to date have revealed several class III genes such as NOTCH4,
Sequence (59 3 39)
DRA
AAGAACATGTGATCATCCAG GCGCTTTGTCATGATTTCCA
CP
TGCACCTACTATATACCCAT TCTTTCACCGGGGGACCTGT
PL
CATTAGTTATTTGCTGGGAA AGTGCCTAGCACAGTGCACA
LINE CLUSTER
AGTGTTCCTACACTCTACTT TTTATTGAGACCTAGCTTAC
PN112
CTCTTCGTCCTGAATGTGTC AGCAGCAAGAAGTATTCCTA
PCD
CCACCTATGACGTAGCCTTG TTGTTGAAGAAATGGCTTGT
NA
CACAACCAGTGTCACTGGAG TGTCAGGTTGGGGGAGAGGC
SR
TGGGACTGTAACAAAAGAGC ATGGCCATCAAATACATGAA
NCT
AACCTGTGTACCCCTTATTC CCACACCCCTACCATCTCTA
CTG REPEAT
TTAGGAGGATGATCAGTGGG GTTCTTCCTGGAGGTGGGCA
INT3A
GAATCCAGACAACTGTGTCA AGGGGACGAGGGCTAAGGCT
INT3B
AAGACAAGGGTGGGCTGGAT GGACTCAGGCAGTGGGACAA
AGER
AACACAGGCCGGACAGAAGC GGTAGACACGGACTCGGTAG
TNX
CCCAGTATGCTCTAACCTCC AGGTTAATGCGGTGGGTGAA
TNFA
CCAATGCCCTCCTGGCCAAT GCAGAGAGGAGGTTGACCTT
PBX2, AGER, and TNX (41, 54, 55) (Fig. 1). The following characteristic genomic structures were found around the sharp GC% transition region: a pseudoautosomal boundary-like sequence (PABL), a 30-kb dense LINE-1 cluster, and a 20-kb dense Alu cluster (22) (Fig. 1). Fukagawa et al. (22) defined the PABL as an approximately 650-nt sequence, highly homologous (approximately 80% nucleotide identity) with the human pseudoautosomal boundary (PAB), which is the interface between sex-specific and pseudoautosomal regions in the sex chromosomes (17–19). In the present work, replication timing for these genes and unique sequences flanking the characteristic genomic motifs were examined. DNA replication timing changes exactly in the GC% transition region. To examine the replication timing for specific regions during the S phase, we used a method based on accurate quantitation of nascent DNA from the region of interest. This method is suitable for examining absolute replication timing for genomic sites at the nucleotide sequence level. HL60 cells that had incorporated [14C]thymidine in advance were synchronized at the G1/S boundary by two successive treat-
VOL. 17, 1997
REPLICATION TIMING SWITCHES IN GC% TRANSITION REGION
4045
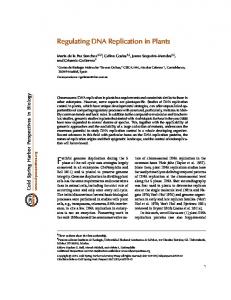
FIG. 2. Competitive PCR products separated by electrophoresis through an 8% polyacrylamide gel. The constant 3H disintegrations per minute of BrdUrdsubstituted DNA (usually 100 to 300 dpm in a tube) was coamplified with constant amounts of competitor DNA (usually 1,000 to 5,000 molecules in a tube), which have a 17-nt insertion in the amplified genomic sequence. The band pattern of each site was not affected by the change of PCR conditions such as the annealing temperature and the ratio of nascent DNA to competitor DNA. Bands from the competitor DNA and the BrdUrd-substituted nascent DNA are indicated by hollow and solid arrowheads, respectively. The lanes represent 0 to 1 h (lane 1), 1 to 2 h (lane 2), 2 to 3 h (lane 3), 3 to 4 h (lane 4), 4 to 5 h (lane 5), and 5 to 6 h (lane 6). Bands of weaker intensity appeared at adjoining time intervals, presumably due to (i) incomplete cell synchronization (although it was synchronized twice) or (ii) genuine cell-to-cell variation in replication timing. Faint bands at other time intervals are presumably due to the imperfect separation of BrdUrd-labeled DNA from unlabeled DNA.
ments with aphidicolin. The S phase was initiated by removing aphidicolin, and the cells were labeled with both [3H]deoxycytidine and BrdUrd at 1-h intervals with the purpose of examining the replication timing for megabase-sized mosaic domains, each of which is most likely to be composed of multiple replicons whose origins are activated simultaneously (42). Incorporation of [3H]deoxycytidine continued at high levels for 6 h after the onset of the S phase; then it dropped to about one-fourth of the previous level during the next 2 h, indicating good cell synchronization (data not shown). In the present study, samples from the first 6 h were used. The 3H- and BrdUrd-labeled short DNA (mainly shorter than 5 kb) for each time interval was separated from the long and light 14Clabeled genomic DNA as described above. To quantitate precisely a small amount of the nascent DNA corresponding to the genome region of interest, competitive PCR (15, 24, 51), which is more sensitive and accurate than Southern blot hybridization, was used. Using 15 sets of PCR primers (Table 1), which yielded a single band from the human genomic DNA, nascent DNA from six time intervals was coamplified with the corresponding competitor DNA containing a 17-nt insertion in the middle of the amplified region, followed by electrophoresis through polyacrylamide gels (Fig. 2). In all four sites located in the 180-kb AT-rich class II region (DRA, CP, PL, and LINE CLUSTER), the fourth time interval showed the strongest band of the BrdUrd-substituted nascent DNA whereas the intensities of competitor bands were
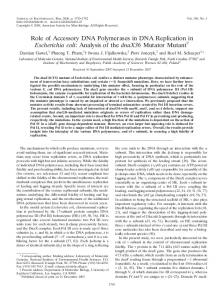
essentially constant for all the time intervals. This means that these loci are replicated mainly during the fourth hour of the S phase. The accurate amounts of nascent DNA corresponding to individual sites were quantitated by comparison with competitor bands, and three independent PCRs were performed (Fig. 3). In two sites located in the 150-kb class III region with higher GC% (TNX and AGER), the second time interval was amplified most effectively (Fig. 2 and 3). This shows that these sites are replicated mainly during the second hour of the S phase and hence about 2 h earlier than the AT-rich class II side is replicated. Another class III gene, TNFA, which is also in a GC-rich region and about 500 kb away from TNX (Fig. 1), was found to be replicated during the first interval of the S phase, again showing that a GC-rich region is replicated early. As the switch region of replication timing was localized within the 100-kb region between LINE CLUSTER and AGER (Fig. 4), eight PCR primer sets in the intervening region were designed more closely (PN112, PCD, NA, SR, NCT, CTG REPEAT, INT3A, and INT3B). Their band patterns and graphs are intermediates between classes II and III (Fig. 2 and 3). Figure 4 shows that the switch region can be quite precisely assigned and that replication timing is strongly correlated with the GC% distribution. The midpoint of the switch region is located about 220 kb telomeric from DRA (i.e., between the dense Alu cluster region and NOTCH4 gene) and coincides precisely with the major GC% transition region (Fig. 4). It should be noted that the replication timing appears
4046
TENZEN ET AL.
MOL. CELL. BIOL.
FIG. 3. Quantitative analysis of nascent DNA. The proper PCR conditions such as the annealing temperature and the ratio of nascent DNA to competitor DNA were determined in advance. The change of PCR conditions did not affect the graph pattern of each site. Competitive PCRs under a single condition optimized for each individual locus were conducted three times. The number of nascent DNA molecules containing each locus in 1 dpm of DNA was calculated by comparison with the intensity of the competitor band. The x axis represents the labeling intervals, and the y axis represents the number of molecules in 1 dpm of nascent DNA. Graphs represent the mean values calculated from three sets of independent experiments. Each bar in the graph represents the maximum and minimum values.
to differ by 1 h between PCD and INT3A, which are 16 kb apart. The finding that replication timing changes precisely in the GC% transition region supports our hypothesis that the boundary of the long-range GC% mosaic domains in the MHC corresponds to a chromosome band boundary (22). Mapping of SARs and other characteristic sequences. The peak height of the graphs in Fig. 3, which represents the amount of nascent DNA, was significantly lower at a few sites in the switch region than at sites in other regions. Tight association of the respective sites with the nuclear scaffold may have resulted in a low recovery of nascent DNA during alkaline-sucrose density gradient or CsCl density gradient centrifugation (see Discussion). To examine this possibility and to elucidate molecular mechanisms for switching of replication
timing, we searched for SARs in the switch region by the method developed by Jackson et al. (35, 36). Cells were encapsulated alive in agarose, permeabilized with 0.5% Triton X-100 either in physiological buffer (35, 36) or in solution containing 2 M NaCl, 10 mM Tris-HCl (pH 7.5), and 1 mM EDTA, and washed in the physiological buffer to form structures known as nuclear halos (Fig. 5). SARs are known to remain in the nuclei, whereas chromatin corresponding to nonSARs is diffuse. The use of 2 M NaCl seems to make the halos spread more widely than the use of the physiological buffer, and DNA from nuclear halos obtained in 2 M NaCl was digested more easily with a restriction endonuclease than was DNA obtained in the physiological buffer (Fig. 5). Half of the treated nuclei were electroeluted to remove the DNA frag-
VOL. 17, 1997
REPLICATION TIMING SWITCHES IN GC% TRANSITION REGION
FIG. 4. Correlation between replication timing and GC% distribution in human MHC classes II and III. (a) Replication timing. The y axis represents the replication timing; the time when the S phase was started by removing aphidicolin from the medium was taken as 0. The interval corresponding to the highest peak of each graph in Fig. 3 is assigned as the replication timing of the respective locus, and the midpoint of the interval was plotted. For PN112, PCD, INT3A, and INT3B, however, the differences between the highest and second-highest intervals were so small (mostly within 10% [Fig. 3]) that a boundary of the two adjoining intervals is plotted. The overlapped dots situated about 210 kb from DRA correspond to the three closely located sites; NA, SR, and NCT (Fig. 1). (b) The GC% distribution in the junction area between MHC classes II and III is from reference 22. The GC% transition around the Alu cluster was designated the L/H transition.
ments of non-SARs, and other half were not electroeluted and hence contained the total DNA. For each site examined for replication timing (Fig. 1), DNA of both fractions were quantitated by competitive PCR and the ratio of DNA content in the SAR fraction to the total genomic DNA was taken as an index of the vicinity of each site to the proximal SAR (Fig. 6 legend). Independent of the buffer (physiological buffer or 2 M NaCl) or the restriction enzyme (EcoRV or HaeIII) used, three SARs were mapped in and around the switch region (Fig. 6); two of them are located in the middle of the switch region, and the other is located near the end of the switch region in the late-replicating region. The sequence of the 100-kb region between LINE CLUS TER and AGER, which contains the switch region and its flanks, has not been determined completely yet. However, we have obtained the sequence for the 5.7-kb region where replication timing changes maximally. The middle SAR was mapped between SR and NCT in this 5.7-kb region (Fig. 6 and 7). Between the two sites, there existed a ca. 460-nt AT-rich (71% A1T) segment, in which T3–6 or A3–4 tracts appear repetitively (Fig. 7c). These sequence motifs have been found in the canonical SARs isolated to date, suggesting that this 460-nt segment would be an SAR. The 5.7-kb region is biased in the purine/pyrimidine ratio (Fig. 7a). One reason for this bias is the dense clustering of Alu elements, whose purine/ pyrimidine ratio is known to be biased (Fig. 7b). Besides Alu elements, polypurine/polypyrimidine tracts are clustered. Only the complete forms of the polypurine/polypyrimidine tracts are
4047
FIG. 5. Nuclear halos before and after the treatment with restriction endonuclease. Nuclear halos were made from HL60 cells in low-melting-temperature agarose (36). Cells in agarose were soaked in the physiological buffer (I) or in 2 M NaCl (II) to obtain nuclear halos. In this picture, the halos obtained in either buffer were then treated with EcoRV (800 or 50 U/ml, respectively) at 32°C for 20 min followed by electroelution. The use of different restriction enzymes produced similar halos. Nuclear halos were stained with 49,6-diamidino-2-phenylindole (DAPI), and fluorescence images were captured with a charge-coupled device camera.
listed in Fig. 7b, but much longer although imperfect tracts of more than 50 nt are also present in this region. Polypurine/ polypyrimidine tracts can potentially form non-B-form structure such as triplex DNA, which is known to arrest the replication fork movement in vitro (2, 8, 14, 45). Although these functions have not been confirmed in vivo, the sequences with biased composition found in the switch region may play roles in regulating DNA replication fork movement (see Discussion). Figure 8 lists other characteristic sequences found in and around the switch region; for example, di-, tri- and tetranucleotide short tandem repeats (e.g., AT, GAA, CTG, ATT, GGAA, and ATTT repeats) and new types of medium reiteration frequency sequences (MERs) (37) were found around the switch region. There also exist an Alu cluster, a LINE1 cluster, and a PABL as reported previously (22, 54). DISCUSSION Assay of replication timing. The method used here was originally designed to determine replication timing within a replicon to map its replication origin (6, 15). To that end, a labeling time of several minutes was used. A labeling time of 1 h was chosen to investigate the replication timing for the megabase-sized GC% mosaic domains, each of which presumably consists of multiple replicons coordinately replicating during a certain S-phase period (42). Replication timing assayed by this method is thought to be minimally influenced by primer locations within a single replicon since replication within individual replicons in the mammalian genome is assumed to be completed within 1 h if the replicon size is 50 to 100 kb and the replication fork proceeds at a speed of 50 nucleotides per second bidirectionally (20, 30). Therefore, the adjoining sites examined showed equivalent replication timings, except for the switch region where the replication fork movement seemed to
4048
TENZEN ET AL.
FIG. 6. Mapping of SARs. Two cases are shown here. (a) Nuclear halos made in physiological buffer were digested with HaeIII. (b) Nuclear halos made in 2 M NaCl were digested with EcoRV. The y axis represents the ratio of the DNA remaining after electroelution to the total DNA without electroelution. There is a significant possibility that the PCR primer sites are not on the restriction fragment harboring the SAR exactly, especially when we used a four-base cutter enzyme. Taking this into account, the nuclear DNA was partially digested; therefore, the values we obtained reflect the approximate distance between the examined locus and the SAR. The ratio of the recovered SAR DNA to the total genomic DNA would be influenced by the distribution of recognition sites of the restriction endonuclease near the site examined. This is why different restriction enzymes were used. Ratio differences among the sites in the switch region which is examined in detail are thought to be meaningful, and dots representing such sites are connected by lines. The switch region between PN112 and INT3B, which shows different timing from classes II or III regions, is indicated by the solid box.
terminate (pause) or slow significantly (discussed below). We expect that experiments with shorter labeling intervals would reveal minute replication timing differences and possibly the replication fork direction, since a detailed inspection of the graphs in Fig. 3 (e.g., the ratio between the highest and the second highest points of the nascent DNA amount) appears to provide such information. For example, TNX and CTG REPEAT appear to be replicated slightly earlier than AGER and NCT, respectively. In this study, we focused on the junction of MHC classes II and III. The replication timing in the entire 4-Mb MHC has been examined independently by another method in which the copy numbers of individual genome sites in interphase nuclei were measured by fluorescence in situ hybridization. The replication timing was shown again to change around the GC% transition region between MHC classes II and III, corroborating our data (42a). Switching mechanisms for replication timing and possible signals. There is about a 2-h difference in replication timing between LINE CLUSTER (the class II side) and AGER (the
MOL. CELL. BIOL.
FIG. 7. Characteristic features of the 5.7-kb region containing the middle SAR (GenBank accession no. AB000565). (a) Purine/pyrimidine ratio. The Window size is 100 nt. (b) Characteristic sequences. Solid arrows indicate the position and direction of Alu elements, and four polypurine/polypyrimidine tracts are shown. Bars written as NA, SR, and NCT indicate regions amplified by competitive PCR. (c) The 462-bp AT-rich (71% A1T) sequence between SR and NCT. AT tracts are boxed. The position of this sequence is shown by the bracket in panel b, and the 59-end is proximal to SR.
class III side), which are about 100 kb apart (Fig. 4). Interestingly, a 1-h difference was observed between two sites (PCD and INT3A) that are only 16 kb apart (Fig. 4). The replication fork movement from INT3A to PCD is thought to terminate (or pause) or to slow to less than 1/10 of the normal speed of 50 nt per second (20, 30), i.e., 16- kb of movement for 1 h. It should be noted that a total difference in replication timing between classes II and III of 2 h may not be due to a single termination (or pause) site, since the replication timing appears to change appreciably in the region from LINE CLUSTER to PN112 and from INT3B to AGER. The replication fork may terminate or pause at multiple sites or proceed very slowly in the respective regions. Little is known about the way in which the replication fork movement in higher eukaryotes terminates or pauses. The identified switch region has some characteristic sequences, which we assume to be candidates for causing the termination (or pausing) of replication fork movement. One is a polypurine/polypyrimidine tract, some of which are known to arrest the replication fork movement in vitro (2, 8, 14, 45), although the function in vivo has been scarcely examined. The other candidate is an SAR. The low peaks of graphs in the switch region (Fig. 3) suggested low recovery of nascent DNA and caused us to consider the existence of SARs in this region. We then mapped three SARs in and around this region. It may be worthwhile to note that we observed low peaks in the switch region, although we used alkaline-sucrose density gradient
VOL. 17, 1997
REPLICATION TIMING SWITCHES IN GC% TRANSITION REGION
FIG. 8. Di-, tri-, or tetranucleotide short tandem repeats and MERs in and around the switch region. MERks3, PN112, and MERks2 are the new MERs. MERks3 showed homology to an STS of human X chromosome (GenBank accession no. HUMSWX270) and an intron of retinoblastoma susceptibility gene (GenBank accession no. HUMRETBLAS). The 1.7-kb PN112 showed homology to two human ESTs (expressed sequence tag), EST05686 (EMBL accession no. HS7963) and EST00737 (EMBL accession no. HSXT00737). The 270-bp MERks2 showed homology to the 59 flanking region of CD22 gene (EMBL accession no. S61408). The switch region between PN112 and INT3A is bracketed.
centrifugation in preparing nascent DNA. This would suggest that the switch region was bound tightly to the nuclear scaffold. In both structural and functional aspects, different types of SARs should exist along the genome. For example, some SARs have been presumed to be bound very tightly (perhaps covalently) to the nuclear scaffold, making it impossible to dissociate in the presence of detergents such as Sarkosyl or sodium dodecyl sulfate (7, 9, 13, 46), and simian virus 40 DNA replication is known to terminate at the nuclear matrix (48). It is conceivable that the SARs found in the switch region may play roles in the control of replication fork movement. The replication arrest has been reported in E. coli (26) and Saccharomyces cerevisiae (39). In human rRNA genes, a termination/pause region that encompasses a dense Alu cluster, polypurine/polypyrimidine tracts, and a length polymorphism resulting from the duplication of 600- to 800-nt segments was identified (40). As noted above, the switch region assigned in the present study includes densely clustered Alu repeats, polypurine/polypyrimidine tracts, and di-, tri-, or tetranucleotide repeats (Fig. 7 and 8), among which the CTG repeat near NOTCH4 is highly polymorphic (55). The temporal order of DNA replication in the murine MHC was previously studied by Spack et al. (52) with various genome segments as Southern hybridization probes. While they provided no direct data for an approximately 400-kb region harboring the junction of MHC classes II and III owing to a lack of hybridization probes, extrapolation of their data predicted a replication switch point in the junction between classes II and III. By extensively analyzing mouse MHC sequences compiled in the GenBank database, we previously reported that a border of the long-range GC% mosaic is also present in the junction area between classes II and III in the mouse MHC (32). These sequences indicate that the structures of the replication time
4049
zones and of the long-range GC% mosaic have been conserved during evolution. Band boundary and evolutionary process to produce segmental GC% distribution. Chromosome bands are structures that can be observed through microscopes, and when only this view is emphasized, the precise location of their boundaries appears to be meaningless. However, considering that various genome features have been connected with chromosome band zones, band boundaries can presumably be assigned precisely by putting informative landmarks on genomic DNA. The present study shows that the switch region for DNA replication timing can be assigned precisely to the GC% transition region. This also indicates that the long-range GC% mosaic is a structure with profound biological significance. If the long-range GC% mosaic is the structure which was formed without significant associated functions through evolution, the boundary may be neither sharp nor precisely correlated with replication timing because of the randomization due to a large number of neutral mutations accumulated in the course of evolution. Conspicuous correlation between the replication timing and segmental GC% distribution indicates that the long-range GC% mosaic structure has a biological function(s) and/or that the molecular mechanisms for evolutionary formation of the mosaic structure are still at work. It is worth noting that regional fluctuations in GC% are also seen in yeast in accordance with replication timing; GC-rich regions are replicated early in the S phase (50), although the degrees of the GC% differences, as well as sizes of the compartmentalized domains, are much smaller than those of warm-blooded vertebrates. One explanation for the correlation is that differences in replication timing have caused the different GC% distributions through certain mutation or repair mechanisms during evolution (e.g., differential mutation rates and/or patterns related to replication timings), which may still be at work. We propose the methods used in this and the previous studies as a general strategy for defining band boundaries at the molecular level and for putting valuable landmarks on mammalian genomes. The studies may help us to better understand molecular and cytogenetic observations of mammalian genomes. ACKNOWLEDGMENTS We are very grateful to N. Saitou, T. Horiuchi, H. Maki, and N. Nishikawa for valuable suggestions, discussions, and comments and to K. Ueda and Y. Miyauchi for technical assistance. We are also grateful for access to the computers at the DDBJ and the Human Genome Center of Japan. T.F. was supported by JSPS Fellowships for Japanese Junior Scientists. This work was supported by a Grant-in-Aid for Creative Basic Research (Human Genome Project) and for Scientific Research on Priority Areas (Genome Informatics) and by a Grant-in-Aid for Scientific Research from the Ministry of Education, Science, and Culture of Japan. REFERENCES 1. Aota, S., and T. Ikemura. 1986. Diversity in G1C content at the third position of codons in vertebrate genes and its cause. Nucleic Acids Res. 14:6345–6355. 2. Baran, N., A. Lapidot, and H. Manor. 1991. Formation of DNA triplexes accounts for arrests of DNA synthesis at d(TC)n and d(GA)n tracts. Proc. Natl. Acad. Sci. USA 88:507–511. 3. Bernardi, G. 1989. The isochore organization of the human genome. Annu. Rev. Genet. 23:637–661. 4. Bernardi, G. 1993. The isochore organization of the human genome and its evolutionary history—a review. Gene 135:57–66. 5. Bernardi, G., B. Olofsson, J. Filipski, M. Zerial, J. Salinas, G. Cuny, M. Meunier-Rotival, and F. Rodier. 1985. The mosaic genome of warm-blooded vertebrates. Science 228:953–958. 6. Biamonti, G., G. Perini, F. Weighardt, S. Riva, M. Giacca, P. Norio, L.
4050
7. 8. 9. 10. 11. 12. 13. 14. 15.
16. 17. 18. 19.
20.
21.
22.
23. 24. 25. 26. 27. 28. 29. 30. 31. 32. 33.
TENZEN ET AL.
Zentilin, S. Diviacco, D. Dimitrova, and A. Falaschi. 1992. A human DNA replication origin: localization and transcriptional characterization. Chromosoma 102:S24–S31. Bodnar, J. W., C. J. Jones, D. H. Coombs, G. D. Pearson, and D. C. Ward. 1983. Proteins tightly bound to HeLa cell DNA at nuclear matrix attachment sites. Mol. Cell. Biol. 3:1567–1579. Brinton, B. T., M. S. Caddle, and N. H. Heintz. 1991. Position and orientation-dependent effects of a eukaryotic Z-triplex DNA motif on episomal DNA replication in COS-7 cells. J. Biol. Chem. 266:5153–5161. Brotherton, T., D. Zenk, S. Kahanic, and J. Reneker. 1991. Avian nuclear matrix proteins bind very tightly to cellular DNA of the b-globin gene enhancer in a tissue-specific fashion. Biochemistry 30:5845–5850. Campbell, R. D., and J. Trowsdale. 1993. Map of the human MHC. Immunol. Today 14:349–352. Contreas, G., M. Giacca, and A. Falaschi. 1992. Purification of BrdUrdsubstituted DNA by immunoaffinity chromatography with anti-BrdUrd antibodies. BioTechniques 12:824–825. Craig, J. M., and W. A. Bickmore. 1993. Chromosome bands—flavours to savour. BioEssays 15:349–354. Cress, A. E., and K. M. Kurath. 1988. Identification of attachment proteins for DNA in Chinese hamster ovary cells. J. Biol. Chem. 263:19678–19683. Dayn, A., G. M. Samadashwily, and S. M. Mirkin. 1992. Intramolecular DNA triplexes: unusual sequence requirements and influence on DNA polymerization. Proc. Natl. Acad. Sci. USA 89:11406–11410. Diviacco, S., P. Norio, L. Zentilin, S. Menzo, M. Clementi, G. Biamonti, S. Riva, A. Falaschi, and M. Giacca. 1992. A novel procedure for quantitative polymerase chain reaction by coamplification of competitive templates. Gene 122:313–320. Drouin, R., G. P. Holmquist, and C.-L. Richer. 1994. High-resolution replication bands compared with morphologic G- and R-bands. Adv. Hum. Genet. 22:47–115. Ellis, N., and P. N. Goodfellow. 1989. The mammalian pseudoautosomal region. Trends Genet. 5:406–410. Ellis, N., P. Yen, K. Neiswanger, L. J. Shapiro, and P. N. Goodfellow. 1990. Evolution of the pseudoautosomal boundary in Old World monkeys and great apes. Cell 63:977–986. Ellis, N. A., P. J. Goodfellow, B. Pym, M. Smith, M. Palmer, A.-M. Frischauf, and P. N. Goodfellow. 1989. The pseudoautosomal boundary in man is defined by an Alu repeat sequence inserted on the Y chromosome. Nature 337:81–84. Falaschi, A., M. Giacca, L. Zentilin, P. Norio, S. Diviacco, D. Dimitrova, S. Kumar, R. Tuteja, G. Biamonti, G. Perini, F. Weighardt, J. Brito, and S. Riva. 1993. Searching for replication origins in mammalian DNA. Gene 135:125–135. Fukagawa, T., Y. Nakamura, K. Okumura, M. Nogami, A. Ando, H. Inoko, N. Saitou, and T. Ikemura. 1996. Human pseudoautosomal boundary-like sequences: expression and involvement in evolutionary formation of the present-day pseudoautosomal boundary of human sex chromosomes. Hum. Mol. Genet. 5:23–32. Fukagawa, T., K. Sugaya, K. Matsumoto, K. Okumura, A. Ando, H. Inoko, and T. Ikemura. 1995. A boundary of long-range G1C% mosaic domains in the human MHC locus: pseudoautosomal boundary-like sequence exists near the boundary. Genomics 25:184–191. Gardiner, K., B. Aissani, and G. Bernardi. 1990. A compositional map of human chromosome 21. EMBO J. 9:1853–1858. Gilliland, G., S. Perrin, K. Blanchard, and H. F. Bunn. 1990. Analysis of cytokine mRNA and DNA: detection and quantitation by competitive polymerase chain reaction. Proc. Natl. Acad. Sci. USA 87:2725–2729. Goldman, M. A., G. P. Holmquist, M. C. Gray, L. A. Caston, and A. Nag. 1984. Replication timing of genes and middle repetitive sequences. Science 224:686–692. Hidaka, M., M. Akiyama, and T. Horiuchi. 1988. A consensus sequence of three DNA replication terminus sites on the E. coli chromosome is highly homologous to the terR sites of the R6K plasmid. Cell 55:467–475. Holmquist, G., M. Gray, T. Porter, and J. Jordan. 1982. Characterization of Giemsa dark- and light-band DNA. Cell 31:121–129. Holmquist, G. P. 1989. Evolution of chromosome bands: molecular ecology of noncoding DNA. J. Mol. Evol. 28:469–486. Holmquist, G. P. 1992. Chromosome bands, their chromatin flavors, and their functional features. Am. J. Hum. Genet. 51:17–37. Huberman, J. A., and A. D. Riggs. 1968. On the mechanism of DNA replication in mammalian chromosomes. J. Mol. Biol. 32:327–341. Ikemura, T. 1985. Codon usage and tRNA content in unicellular and multicellular organisms. Mol. Biol. Evol. 2:13–34. Ikemura, T., and S. Aota. 1988. Global variation in G1C content along vertebrate genome DNA: possible correlation with chromosome band structures. J. Mol. Biol. 203:1–13. Ikemura, T., and K. Wada. 1991. Evident diversity of codon usage patterns
MOL. CELL. BIOL. of human genes with respect to chromosome banding patterns and chromosome numbers; relation between nucleotide sequence data and cytogenetic data. Nucleic Acids Res. 19:4333–4339. 34. Ikemura, T., K. Wada, and S. Aota. 1990. Giant G1C% mosaic structures of the human genome found by arrangement of GenBank human DNA sequences according to genetic positions. Genomics 8:207–216. 35. Jackson, D. A., P. Dickinson, and P. R. Cook. 1990. The size of chromatin loops in HeLa cells. EMBO J. 9:567–571. 36. Jackson, D. A., J. Yuan, and P. R. Cook. 1988. A gentle method for preparing cyto- and nucleo-skeletons and associated chromatin. J. Cell Sci. 90:365–378. 37. Jurka, J. 1990. Novel families of interspersed repetitive elements from the human genome. Nucleic Acids Res. 18:137–141. 38. Klevecz, R. R., B. A. Keniston, and L. L. Deaven. 1975. The temporal structure of S phase. Cell 5:195–203. 39. Kobayashi, T., M. Hidaka, M. Nishizawa, and T. Horiuchi. 1992. Identification of a site required for DNA replication fork blocking activity in the rRNA gene cluster in Saccharomyces cerevisiae. Mol. Gen. Genet. 233:355– 362. 40. Little, R. D., T. H. K. Platt, and C. L. Schildkraut. 1993. Initiation and termination of DNA replication in human rRNA genes. Mol. Cell. Biol. 13:6600–6613. 41. Matsumoto, K., M. Arai, N. Ishihara, A. Ando, H. Inoko, and T. Ikemura. 1992. Cluster of fibronectin type III repeats found in the human major histocompatibility complex class III region shows the highest homology with the repeats in an extracellular matrix protein, tenascin. Genomics 12:485– 491. 42. Nakamura, H., T. Morita, and C. Sato. 1986. Structural organizations of replicon domains during DNA synthetic phase in the mammalian nucleus. Exp. Cell Res. 165:291–297. 42a.Okumura, K. Unpublished data. 43. Pedrali-Noy, G., S. Spadari, A. Miller-Faure´s, A. O. A. Miller, J. Kruppa, and G. Koch. 1980. Synchronization of HeLa cell cultures by inhibition of DNA polymerase a with aphidicolin. Nucleic Acids Res. 8:377–387. 44. Pilia, G., R. D. Little, B. Aı¨ssani, G. Bernardi, and D. Schlessinger. 1993. Isochores and CpG islands in YAC contigs in human Xq26.1-qter. Genomics 17:456–462. 45. Rao, B. S. 1994. Pausing of simian virus 40 DNA replication fork movement in vivo by (dG-dA)n z (dT-dC)n tracts. Gene 140:233–237. 46. Razin, S. V., V. V. Chernokhvostov, A. V. Roodyn, I. B. Zbarsky, and G. P. Georgiev. 1981. Proteins tightly bound to DNA in the regions of DNA attachment to the skeletal structures of interphase nuclei and metaphase chromosomes. Cell 27:65–73. 47. Saccone, S., A. De Sario, J. Wiegant, A. K. Raap, G. Della Valle, and G. Bernardi. 1993. Correlations between isochores and chromosomal bands in the human genome. Proc. Natl. Acad. Sci. USA 90:11929–11933. 48. Schirmbeck, R., and W. Deppert. 1991. Structural topography of simian virus 40 DNA replication. J. Virol. 65:2578–2588. 49. Senger, G., J. Ragoussis, J. Trowsdale, and D. Sheer. 1993. Fine mapping of the human MHC class II region within chromosome band 6p21 and evaluation of probe ordering using interphase fluorescence in situ hybridization. Cytogenet. Cell Genet. 64:49–53. 50. Sharp, P. M., and A. T. Lloyd. 1993. Regional base composition variation along yeast chromosome III: evolution of chromosome primary structure. Nucleic Acids Res. 21:179–183. 51. Siebert, P. D., and J. W. Larrick. 1992. Competitive PCR. Nature 359:557– 558. 52. Spack, E. G., E. D. Lewis, B. Paradowski, R. T. Schimke, and P. P. Jones. 1992. Temporal order of DNA replication in the H-2 major histocompatibility complex of the mouse. Mol. Cell. Biol. 12:5174–5188. 53. Spring, B., C. Fonatsch, C. Mu ¨ller, G. Pawelec, J. Ko ¨mpf, P. Wernet, and A. Ziegler. 1985. Refinement of HLA gene mapping with induced B-cell line mutants. Immunogenetics 21:277–291. 54. Sugaya, K., T. Fukagawa, K. Matsumoto, K. Mita, E. Takahashi, A. Ando, H. Inoko, and T. Ikemura. 1994. Three genes in the human MHC class III region near the junction with the class II: gene for receptor of advanced glycosylation end products, PBX2 homeobox gene and a Notch homolog, human counterpart of mouse mammary tumor gene int-3. Genomics 23:408– 419. 55. Sugaya, K., S. Sasanuma, J. Nohata, T. Kimura, T. Fukagawa, Y. Nakamura, A. Ando, H. Inoko, T. Ikemura, and K. Mita. Gene organization of human NOTCH4 and (CTG)n polymorphism in this human counterpart gene of mouse proto-oncogene Int3. Gene, in press. 56. Tribioli, C., G. Biamonti, M. Giacca, M. Colonna, S. Riva, and A. Falaschi. 1987. Characterization of human DNA sequences synthesized at the onset of S-phase. Nucleic Acids Res. 15:10211–10232. 57. Yoon, Y., J. A. Sanchez, C. Brun, and J. A. Huberman. 1995. Mapping of replication initiation sites in human ribosomal DNA by nascent-strand abundance analysis. Mol. Cell. Biol. 15:2482–2489.