Nov 6, 2005 - antiproton collisions at 1.8 TeV centre-of-mass energy, by observing the reaction pp â tt X, tt â ... lepton universality is shown in Figure 1 (right). ... Also shown is the contour curve corresponding to the direct ... boson, and to a small extent also on the hadronic vacuum polarisation (small arrow labeled. âα).
arXiv:hep-ex/0511018v1 6 Nov 2005
UCD-PHYC/051101 hep-ex/0511018 6 November 2005
Precision Tests of the Standard Model Martin W. Gr¨ unewald UCD School of Physics University College Dublin Belfield, Dublin 4 Ireland Abstract Recent published and preliminary precision electroweak measurements are reviewed, including new results on the mass of the top quark and mass and width of the W boson. The experimental results are compared with the predictions of the Standard Model and are used to constrain its free parameters, notably the mass of the Higgs boson. The agreement between measurements and expectations from theory is discussed.
Invited talk presented at the EPS HEPP conference, Lisboa, Portugal, July 21st to 27th, 2005
1
1
Introduction
On the level of realistic observables such as measured cross sections, ratios and asymmetries, the electroweak precision data consist of over thousand measurements with partially correlated statistical and systematic uncertainties. This large set of results is reduced to a more manageable set of 17 precision results, so-called pseudo observables, in a largely model-independent procedure, by the LEP and Tevatron Electroweak Working Groups. The pseudo observables updated for this conference are briefly reviewed and Standard Model analyses [1] are performed, where the hadronic vacuum polarisation at the Z pole and “constants” such as the Fermi constant GF are used as well. 2
Measurements
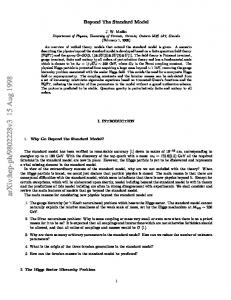
About 3/4 of all pseudo observables arise from measurements performed in electron-positron collisions at the Z resonance, by the SLD experiment and the LEP experiments ALEPH, DELPHI, L3 and OPAL. The Z-pole observables are: 5 observables describing the Z lineshape and leptonic forward-backward asymmetries, 2 observables describing polarised leptonic asymmetries measured by SLD with polarised beams and at LEP exploiting tau polarisation, 6 observables describing b- and c-quark production at the Z pole, and finally the inclusive hadronic charge asymmetry. The Z-pole results and their combinations are final and by now published [2]. The remaining pseudo observables are: the mass and total width of the W boson measured by CDF and DØ at the Tevatron and by the four LEP-II experiments, and the top quark mass measured at the Tevatron. Mass of the Top Quark Ten years ago the Tevatron experiments CDF and DØ discovered the top quark in protonantiproton collisions at 1.8 TeV centre-of-mass energy, by observing the reaction pp → tt X, tt → bbW+ W− . The published results based on data collected during Run-I (1992-1996) and the preliminary results based on Run-II data (since 2001) presented at this conference [3] are combined by the Tevatron Electroweak Working [4]: Mt = 172.7 ± 1.7 (stat.) ± 2.4 (syst.) GeV. Mass and Width of the W boson Final results on MW and ΓW from CDF and DØ are available for the complete Run-I data set and are combined taking correlations properly into account [5]. No results are available for Run-II data yet. The results from ALEPH, DELPHI and L3 are preliminary, while OPAL has recently published final results for their complete LEP-II data set [6]. The combined results of the Tevatron (MW = 80.452 ± 0.059 GeV) and LEP-II (MW = 80.392 ± 0.039 GeV) are in very good agreement. Z Decays to b and c Quarks The heavy-flavour results at the Z-pole were the last precision electroweak Z-pole results to become final. Details on the various heavy-flavour measurements at the Z pole are given in [2]. The combination has a rather low χ2 of 53 for (105−14) degrees of freedom: all forward-backward asymmetries are very consistent, and their combination is still statistics limited. The combined 0,c values for A0,b fb and Afb are compared to the SM expectation in Figure 1 (left), showing that A0,b fb agrees well with the SM expectation for an intermediate Higgs-boson mass of a few hundred 0,b GeV. The mutual consistency of the measurements of Ab , Afb = (3/4)Ae Ab and Aℓ assuming lepton universality is shown in Figure 1 (right). Compared to the experimental uncertainties, the SM predictions are nearly constant in Aq , in contrast to the situation for Aℓ . This is a consequence of the SM values of electric charge and iso-spin of quarks. 2
Effective Electroweak Mixing Angle Assuming the SM structure of the effective coupling constants, the measurements of the lept in Figure 2 (left). The average of all six various asymmetries are compared in terms of sin2 θeff 2 lept 2 lept sin θeff determinations is sin θeff = 0.23153±0.00016, with a χ2 /dof of 11.8/5, corresponding to a probability of 3.7%. The enlarged χ2 /dof is solely driven by the two most precise deterlept , namely those derived from the measurements of Aℓ by SLD, dominated minations of sin2 θeff by the left-right asymmetry result, and of A0,b fb at LEP. These two measurements differ by 3.2 standard deviations. This is a consequence of the same effect as shown in Figure 1 (right). 3
Global Standard Model Analysis
Within the framework of the SM, each pseudo observable is calculated as a function of five main relevant parameters, which are the running electromagnetic and strong coupling constant evaluated at the Z pole, αem and αS , and the masses of Z boson, top quark and Higgs boson, MZ , Mt , MH . Using the Fermi constant GF allows to calculate the mass of the W boson. The running (5) electromagnetic coupling is represented by the hadronic vacuum polarisation ∆αhad , as it is this (5) contribution which has the largest uncertainty, ∆αhad = 0.02758 ± 0.00035 [7]. The precision of the Z-pole measurements requires matching precision of the theoretical calculations. The dependence on Mt and MH enters through radiative corrections. The predictions are calculated with the computer programs [8] TOPAZ0 and ZFITTER, which incorporate state-of-the-art calculations. Using the Z-pole measurements of SLD and LEP-I in order to evaluate electroweak radiative corrections, the masses of the two heavy particles, the top quark and the W boson, can be predicted. The resulting 68% C.L. contour curve in the (Mt , MW ) plane is shown in Figure 2 (right). Also shown is the contour curve corresponding to the direct measurements of both quantities at the Tevatron and at LEP-II. The two contours overlap, successfully testing the SM at the level of electroweak radiative corrections. The diagonal band in Figure 2 (right) shows the constraint between the two masses within the SM, which depends on the mass of the Higgs boson, and to a small extent also on the hadronic vacuum polarisation (small arrow labeled ∆α). Both the direct and the indirect contour curves prefer a low value for the mass of the SM Higgs boson. The best constraint on MH is obtained by analysing all data. This global fit has a χ2 of 17.8 for 13 degrees of freedom, corresponding to a probability of 16.6%. The pulls of the 18 measurements entering the fit are shown in Figure 3 (left). The single largest contribution to the χ2 arises from the A0,b fb measurement discussed above, with a pull of 2.8. The fit yields MH = 91+45 GeV, which corresponds to a one-sided 95% C.L. upper limit on MH of 186 GeV −32 including the theory uncertainty as shown in Figure 3 (left). The fitted MH is strongly correlated with the fitted hadronic vacuum polarisation (correlation of −0.51) and the fitted top-quark mass (+0.52). The strong correlation with Mt implies a shift of 20% in MH if the measured Mt changes by 3 GeV (about one standard deviation). Thus a precise measurement of Mt is very important. Also shown are the χ2 curves obtained with the more precise but theory-driven evaluation of (5) ∆αhad [9], yielding a correlation of only −0.2 with MH , or including the results obtained in lowQ2 interactions: atomic parity violation [10], Moller scattering [11], and NuTeV’s measurement of deep-inelastic lepton-nucleon scattering [12]; with the two former measurements in agreement with the expectations but the latter differing by 3 standard deviations. Both analyses yield nearly the same upper limits on MH .
3
0.08
1
∆α
mt
mH
0.07
Ab
Afb
0,c
SM
0.9
SM
68% CL 95% CL 0.06 0.095
0.1
0.8
0.105
68.3 95.5 99.5 % CL
0.14
0.145
0,b
Afb
0.15
0.155
Al
0,c Figure 1: Left: Contour curves in the (A0,b fb , Afb ) plane. Right: Bands of ±1σ showing the combined results of Aℓ , Ab , and A0,b fb = 3/4Ae Ab . The SM expectations are shown as the arrows (5) for Mt = 172.7 ± 2.9 GeV and MH = 300+700 −186 GeV and ∆αhad = 0.02758 ± 0.00035. 0,l
0.23099 ± 0.00053
Al(Pτ)
0.23159 ± 0.00041
Al(SLD)
0.23098 ± 0.00026
Afb
0,b
0.23221 ± 0.00029
0,c Afb had Qfb
0.23220 ± 0.00081
0.23153 ± 0.00016
mH [GeV]
χ /d.o.f.: 11.8 / 5 2
3
LEP1 and SLD LEP2 and Tevatron (prel.) 68% CL
0.2324 ± 0.0012
Average 10
80.5
mW [GeV]
Afb
80.4
80.3
10
2
0.23
mH [GeV] 114 300 150
∆α(5) had= 0.02758 ± 0.00035 mt= 172.7 ± 2.9 GeV
0.232
lept
∆α
1000 175
200
mt [GeV]
0.234
sin2θeff
Figure 2: Left: The effective electroweak mixing angle from asymmetry measurements. Right: Contour curves of 68% C.L. in the (Mt , MW ) plane for the direct measurements and the indirect determinations. The band shows the correlation between MW and Mt expected in the SM. Measurement
Fit
0.02758 ± 0.00035 0.02767
mZ [GeV]
91.1875 ± 0.0021
91.1874
ΓZ [GeV]
2.4952 ± 0.0023
2.4959
0 σhad
41.540 ± 0.037
41.478
20.767 ± 0.025
20.742
Rl 0,l
Afb
Al(Pτ) Rb
0.1465 ± 0.0032 0.1721 ± 0.0030
0.1723
0.0992 ± 0.0016
0.1038
0.0707 ± 0.0035
0.0742
0.923 ± 0.020
0.02749±0.00012 2
4
incl. low Q data
0.668 0.1480
sin θeff (Qfb) 0.2324 ± 0.0012
0.2314
mW [GeV]
80.410 ± 0.032
80.377
ΓW [GeV]
2.123 ± 0.067
2.092
mt [GeV]
172.7 ± 2.9
173.3
2 lept
3
0.935
0.670 ± 0.027 0.1513 ± 0.0021
Ac
(5)
0.02758±0.00035
0.21629 ± 0.00066 0.21579
0,c Afb
Ab
∆αhad =
5
0.1480
0,b
Al(SLD)
Theory uncertainty
0.01714 ± 0.00095 0.01643
Afb
Rc
6
2
[nb]
meas fit meas |O −O |/σ 0 1 2 3
∆χ
(5)
∆αhad(mZ)
2 1 0
1
2
0
3
Excluded 30
100
mH [GeV]
300
Figure 3: Left: Pulls of the measurements used in the global SM analysis. Right: ∆χ2 curve (5) as a function of MH . Also shown are the curves using a theory-driven evaluation of ∆αhad , or including the low-Q2 measurements. 4
The theoretical uncertainty on the SM calculations of the observables is visualised as the thickness of the blue band. It is dominated by the theoretical uncertainty in the calculation of the effective electroweak mixing angle, where a completed two-loop calculation is needed. The shaded part in Figure 3 (left) shows the MH range up to 114.4 GeV excluded by the direct search for the Higgs boson at 95% confidence level. Even though the minimum of the χ2 curve lies in the excluded region, the uncertainties on the Higgs mass value are such as that the results are well compatible. 4
Conclusions
During the last 15 years many experiments have performed a wealth of measurements with unprecedented precision in high-energy particle physics. These measurements test all aspects of the SM of particle physics, and many of them show large sensitivity to electroweak radiative corrections at loop level. Most measurements agree well with the expectations as calculated within the framework of the SM, successfully testing the SM at Born and at loop level. There are two “3 standard deviations effects”, namely the spread in the various determinations of the effective electroweak mixing angle, within the SM analysis apparently disfavouring the measurement of A0,b fb , and NuTeV’s result, most pronounced when interpreted in terms of the on-shell electroweak mixing angle. For the future, precise theoretical calculations including theoretical uncertainties are needed, in particular a completed two-loop calculation for the effective electroweak mixing angle. Experimentally, the next few years will bring improvements in the measurements of W and top masses, and the long-awaited discovery of the Higgs boson. Acknowledgements It is a pleasure to thank my colleagues of the Tevatron and LEP electroweak working groups, members of the E-158, NuTeV, SLD, ALEPH, DELPHI, L3, OPAL, CDF and DØ experiments, as well as T. Riemann and G. Weiglein for valuable discussions. References [1] LEP-EWWG, http://www.cern.ch/LEPEWWG. [2] ALEPH, DELPHI, L3, OPAL, SLD, and the LEP-EWWG, hep-ex/0509008. [3] Koji Sato, these proceedings. [4] CDF, DØ, and the TEV-EWWG, hep-ex/0507091. [5] CDF, DØ, and the TEV-EWWG, PRD 70 (2004) 092008. [6] Ambreesh Gupta, these proceedings; Raimund Str¨ ohmer, these proceedings. [7] H. Burkhardt, B. Pietrzyk, PRD 72 (2005) 057501. [8] G. Passarino et al., CPC 117 (1999) 278; D. Bardin et al., CPC 133 (2001) 229. [9] J.F. de Troconiz, F.J. Yndurain, PRD 71 (2005) 073008 [10] J. Ginges, V. Flambaum, Phys. Rept. 397 (2004) 63. [11] P. Anthony et al., E158 collaboration, PRL 95 (2005) 081601. [12] G.P. Zeller et al., NuTeV collaboration, PRL 88 (2002) 091802, erratum 90 (2003) 239902.
5