Predictability & Criticality Metrics for Coordination in Complex Environments Rajiv T. Maheswaran
Pedro Szekely
Information Sciences Institute Univ. of Southern California 4676 Admiralty Way, #1001 Marina Del Rey, CA 90292
Information Sciences Institute Univ. of Southern California 4676 Admiralty Way, #1001 Marina Del Rey, CA 90292
[email protected]
[email protected]
ABSTRACT
that an activity will take much longer or is more likely to fail than originally anticipated. The team might find unexpected and significant new tasks to perform in the middle of execution. Under these conditions, the initial plan becomes invalid and agents must coordinate in real time to get a high quality solution. Other domain characteristics include distribution and subjectivity. As execution evolves, each agent can observe the outcomes of only some activities. As agents modify their policies, each agent is only aware of the changes to its policy. Agents only have partial knowledge of the team reward function involving their activities and those with direct dependencies. Thus, agents must share information to choose the appropriate policy modifications. Any coordination technology must work within the pace of execution, and the bounded communication and bounded rationality limitations of the infrastructure and equipment available. When coupled with dynamism, centralization is not a viable strategy, especially as the problem scales. Also, having a single point of failure is risky and undesirable. As the number of agents increases, it becomes infeasible to share all information among all agents without incurring delays that exceed the times at which decisions must be made. The shared information must be processed and subsequent policy modifications must be analyzed using the reasoning cycles available between decision points. Thus, time-critical domains restrict the number of contingencies that can be considered. The impact of these difficulties are greatly magnified due to global nonlinearity in the team reward function. We consider domains where the team reward is defined in terms of a task decomposition hierarchy where tasks are decomposed into subtasks using conjunction (all subtasks must succeed) and disjunction (at least one subtask must succeed) among others. The leaves of the hierarchy represent activities that the agents can perform. The reward is calculated bottom-up from the activities: successful execution of an activity yields some positive amount of quality (a real number), and failure yields zero quality. Quality flows up to the root through the intermediate subtasks. Each subtask applies various operators such as sum, max, and min to aggregate the quality of its subtasks. Our domains of interest also feature links between tasks in different parts of the hierarchy. Enables links will zero out the quality of the target task if the source task fails to obtain positive quality; conversely, disable links zero out the target quality if the source task obtains positive quality before agents start the activities under the target task. The result is a non-linear reward function where small perturbations in the execution of an activity can greatly affect the team reward. If an activity fails or obtains quality too soon or late, it can cause other tasks to obtain zero reward, and that zero can travel up and forward in the decomposition network zeroing out many tasks.
We address the problem of coordinating the activities of a team of agents in a dynamic, uncertain, nonlinear environment. Bounded rationality, bounded communication, subjectivity and distribution make it extremely challenging to find effective strategies. In these domains it is difficult to accurately predict whether potential policy modifications will lead to an increase in the value of the team reward. Our Predictability and Criticality Metrics (PCM) approach errs on the side of safety, and advocates considering policy modifications that are guaranteed to not harm the current policy, and uses simple metrics to choose from within that set a modification that increases the team reward. In the context of the DARPA Coordinators program, we show how the PCM approach yielded a system that significantly outperformed several competing approaches in an extensive independent evaluation.
General Terms Algorithms
Keywords Multi-Agent, Uncertainty, Dynamism, Coordination, Scheduling
1.
M. Becker, S. Fitzpatrick, G. Gati, J. Jin, R. Neches, N. Noori, C. Rogers, R. Sanchez, K. Smyth, C. Vanbuskirk
INTRODUCTION
The coordinated execution of activities of a multi-agent team in dynamic and uncertain environments is of critical interest in domains such as large-scale disaster rescue, joint military operations and project management, among others. There are many characteristics of these domains that make effective coordination extremely challenging. The team begins with an initial plan of activities which have uncertainty in duration and outcome. As uncertainties are resolved through execution, agents may need to modify their plans, e.g., change timings or perform alternate activities. As the scale of the problems increases, it becomes infeasible to calculate and store an optimal set of policies that prescribe appropriate plan changes for all contingencies. This introduces one form of dynamism, where agents must modify their policies over time. A second form of dynamism occurs when agents’ models of the world or the team reward function changes during execution. An agent might discover Cite as: Predictability & Criticality Metrics for Coordination in Complex Domains, R. T. Maheswaran, P. Szekely, M. Becker, S. Fitzpatrick, G. Gati, J. Jin, R. Neches, N. Noori, C. M. Rogers, R. Sanchez, K. Smyth, and C. VanBuskirk , Proc. of 7th Int. Conf. on Autonomous Agents and Multiagent Systems (AAMAS 2008), Padgham, Parkes, Müller and Parsons(eds.),May,12-16.,2008,Estoril,Portugal,pp.647-654. c 2008, International Foundation for Autonomous Agents and Copyright Multiagent Systems (www.ifaamas.org). All rights reserved.
647
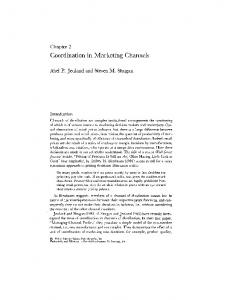
Uncertainty and dynamics often cause small disruptions, such as a delays, which don’t directly cause failure, but the cumulative effect may lead to failures that propagate to many tasks resulting in many tasks failing. Even if such events are infrequent, detecting and preventing them is crucial for good team performance. This is challenging because bounded communication forces agents to reason with imperfect information, and bounded rationality forces agents to act without completely understanding the full impact of proposed policy modifications. As scale grows, the task networks grow, and avoiding such failures becomes more difficult. We illustrate the key concept in Figure 1, where the horizontal axis represents all the possible modifications that could be made to the agent policies, and the vertical axis represents the team reward obtained at the end of execution. The team reward plot has many “ravines" where the reward of some policies is significantly lower than that of similar policies. For example, two policies may differ on the start time of a single activity, but the delay will trigger an unwanted nonlinear effect. Ideally, the agent team should select the policy modification labeled a, which yields the highest reward. However, if agents use approximate computations, they could be selecting b or c, when they are attempting to choose a. Our hypothesis is that conventional techniques for solving these classes of problems compute a general approximation of the policyto-reward function that perhaps follows the true function to a large extent, but often smooths over the deep ravines in the function (the dotted line in Figure 1.) In contrast, our PCM approach focuses on creating a criticality metric (dashed line) which may only be applicable on a certain (predictable) subset of the policy modification space where we are able to detect the ravines (e.g., d and e). Our experiments show that even though we don’t compute a good approximation of the true policy-to-reward function, knowing the ravines allows our system significantly outperforms the systems that attempt to compute a general approximation of this function. Our main contribution is the predictability and criticality metrics (PCM) approach for solving problems with these characteristics. Predictability advocates restricting policy modifications to classes where nonlinearities can be understood. Criticality metrics refer to focused information that reveal features of the team reward function and help decide if a policy modification will trigger an unwanted nonlinear effect. Predictability and criticality are closely related. We recognize that it is difficult to design criticality metrics that accurately reveal the reward ravines across all potential policy modifications. For example, one metric can reveal ravines d and e, but not b or c. The PCM approach dictates that we carve up the space of all policy modifications into subspaces where a set of criticality metrics can consistently reveal the ravines. The agents are then restricted to choose policy modifications from those subspaces, using the criticality metrics to avoid bad policies. For example, in Figure 1, agents would not be able to choose policy a, which yields the maximum reward, rm , because policy a is not in the predictable region. However, agents following the PCM approach would be guaranteed to choose a policy modification that yields at least reward r0 . We formulated this methodology while developing our CriticalitySensitive Coordination (CSC) system for the DARPA Coordinators program in a domain with the characteristics discussed here. While our system work is interesting and useful in its own right, we view it mainly as an illustration and evaluation of our PCM approach which is extremely effective for this coordination application. This was verified by an independent evaluation where our CSC system significantly outperformed prominent competing approaches. Figure 2 shows that only our system was able to decidedly outperform
Nonlinear Reward Function General Approximation Criticality Metric
rm
Reward
r0
Policy Modification Space
d
e
b a c
Predictable Policy Modification Space
Figure 1: Evaluating Nonlinearity CSC
98
Flexible Scheduling
80
Baseline Distributed MDPs
77 56
Figure 2: Comparison of Four Coordination Approaches a simple baseline. The chart shows average normalized scores over an independently generated problem set.
2.
THE PCM APPROACH
We propose an approach based on predictability and criticality metrics (PCM). Predictability refers to the types of policy modifications one should consider. Because nonlinearities have the potential to severely punish solution quality and agents do not have a full understanding of the consequences of their actions, policy modifications should be limited to classes where potential impact can be identified as accurately as possible. Criticality metrics refer to the information used to trigger and evaluate potential policy modifications. Even when considering a small class of policy modifications, it is difficult to assess whether they increase or decrease the global reward. To do this, we use criticality metrics to provide different features of the unknown reward function. In order to function in a dynamic, uncertain, distributed nonlinear environment, criticality metrics must have the following properties: Timely: Agents operate in a dynamic environment, so criticality metrics must be updated as the environment changes. It is crucial to update metrics before decisions need to be made. This is challenging as bounded communication limits how fast metrics can be updated when they depend on information from other agents. Bounded: In order to scale to large numbers of agents and activities, the size required to store a metric must not grow beyond a fixed limit. Thus, it shouldn’t be a function of number of agents, number of nodes or time horizon. For example, a metric that calculates the exact quality distributions for tasks over time would have a domain that could be immense for nodes near the root. Bounded computation and communication would make such criticality metrics impractical for large problems. Global: The purpose of a criticality metrics is to provide information about features of the global reward that can be achieved from the current state. Consequently, they must incorporate information from many agents as individual agents only know small portions of the reward and the global state. Accurate: Figure 1 highlights the difference between accurate
648
and approximate. A general approximation could be considered a better estimate of the true reward than the criticality metric. However, given our focus on nonlinearities, the criticality metric is more accurate with respect to an important feature of the reward. If we want to consider a particular type of policy modification, we must bring it into the predictable space and that will require developing (timely, bounded, global and accurate) criticality metrics to detect nonlinearities within that space. Otherwise, the modification, even though it may have tempting promise of improvement, should be ignored to avoid pitfalls of nonlinearity. Because each criticality metric estimates a single feature of the reward, it is important to use multiple criticality metrics when evaluating policy modifications. Predictability and criticality metrics can also be considered generalizations of a philosophy of doing no harm first, then within that restriction, choosing what does the most good.
3.
THE COORDINATORS PROBLEM
The goal of the DARPA Coordinators program is to create “distributed intelligent software systems that will help fielded units adapt their mission plans as the situation around them changes and impacts their plans." 1 The problem is formally modeled using a version of the TAEMS (Task Analysis, Environment Modeling, and Simulation) framework [3] called CTAEMS [1]. Agents have a set of activities, known as methods, that they can perform, but they can execute only one at a time. Methods have probabilistic outcomes for duration (how long to complete if executed) and quality (obtained after completion). If an activity can be performed by multiple agents, each of those agents has a unique method for that activity. Methods yield zero quality if started before a release time or completed after a deadline that can be unique to each method. The team reward function is represented using a task decomposition graph. The root task represents the mission quality. Tasks can be decomposed into many levels of subtasks. Leaf nodes represent methods that can be executed by agents in the team. Each task is associated with a quality accumulation function (QAF) that captures how its quality is calculated from the qualities of its children. The Max, Sum, and SyncSum QAFs represent disjunctive decompositions where a task can be achieved by performing one or more subtasks. The SyncSum QAF represents synchronization: the quality of the parent is the sum of the qualities of the children that start at the same time. The Min and SumAnd represent conjunctive decompositions. The ExactlyOne QAF represents exclusive-or decompositions. Agents cannot simply compute an optimal schedule for a given set of methods. Disjunctive QAFs force agents to choose which methods to execute, creating a combined planning and scheduling problem. All methods yield zero quality until they are completed. The quality of the root task is ultimately a function of the qualities of all the methods. The goal is to maximize the quality achieved at the root at the end of the mission. Additional relationships between nodes (tasks and methods) are represented using directional links, known as non-local effects (NLEs). The enables NLE requires that the target of the link start execution after the source has achieved positive quality. Otherwise, the target receives zero quality. The disables NLE precludes the target from achieving positive quality if it starts after the source achieves positive quality. The facilitates NLE modifies the quality and duration distributions of the target to make methods take less time and yield more quality, in proportion to the quality achieved by the source. The hinders NLE has the opposite effect. If the target of an NLE is a task, it is interpreted as multiple NLEs from the source to all the 1 http://www.darpa.mil/ipto/Programs/coordinators/
649
target’s descendant methods. With these elements (QAFs and NLEs), one can create highly nonlinear reward functions. For example, methods that enable tasks, or children of Min and SumAnd tasks, can be far more critical than others. In these situations, small changes to the success likelihood of individual methods can impact the success likelihood of many tasks, thus having a large impact on team reward. Agents are not given the full task decomposition graph, and thus have incomplete knowledge of the team reward function. Instead of the complete graph, known as the objective view, they are given a subgraph or subjective view. The subgraph is composed of (1) methods they own, (2) ancestors of these methods and (3) nodes that are sources or targets of NLEs with a node in (1) or (2). Agents only know quality and duration distributions for methods in their subjective view. Each agent is also given an initial schedule (methods and start times) calculated by an oracle that has the objective view. While agents are free to share this information, unanticipated delay and failure (getting zero quality) forces the team to modify the policies they generated from the schedule. Exogenous events such as distribution changes, release/deadline changes and new tasks can alter the reward function during execution and force agents to modify their plans.
4.
THE CSC SYSTEM
We developed Criticality-Sensitive Coordination (CSC) system for the Coordinators program using the PCM approach. Each problem that CSC solves is represented in CTAEMS. The full task decomposition, NLEs, method duration and quality distributions, and an initial schedule for each agent are specified in a single file called the objective view. The objective view also contains dynamic changes that will occur during execution and the times when they will be revealed to the subset of agents who are affected. A Simulator reads the CTAEMS objective view, instantiates the agents and partitions the objective view into subjective views. It then gives each agent its subjective view and an initial schedule for its methods. The simulator accepts commands from agents to start or abort methods that it can execute. It keeps track of the execution clock and informs agents about the passage of time and the quality achieved by a method when it completes execution. The Simulator draws the method outcome, duration and quality randomly from the probability distributions defined in the objective view. The simulator verifies that execution is valid according to the rules of CTAEMS (e.g., enabling activities completed successfully, execution request is after the release time) and records the quality accrued at the root task. The initial schedule that agents receive consists of a set of methods and associated start times. This schedule is brittle because duration uncertainty may prevent agents from starting methods at specific times. We use the initial schedule to construct a more robust policy, where the time points are extended into intervals. Figure 3 shows the architecture of CSC agents. The Execution Controller is responsible for executing the policy. It interprets the method start intervals and priorities and sends commands to the Simulator to start or abort methods as dictated by the policy. It also receives observations about the environment from the Simulator such as the passage of time or the qualities of executed methods. The Execution Controllers in multiple agents communicate to wait for enablers to accumulate quality before starting a method. It also communicates with other agents to wait for synchronized methods to be ready to start before starting any of them. To accommodate these delays, the Execution Controller can move the start times of methods to any time within the intervals defined in the policy. Policy modifications are made through various Activity Man-
CSC Agent 1 Meta-Manager Opportunistic Inserter
Activity Manager
CSC Agent 2 Meta-Manager Opportunistic Inserter
State Manager Criticality Metrics
T1 Min
Activity Manager T2 Max
State Manager Criticality Metrics
Policy
Observations
M2
M3
M4
M5
M6
M7
M8
M9
Execution Controller Policy
Observations
Figure 4: Example Coordination Problem in CTAEMS
Policy
bone and backbreaker values. Backbone Value: The backbone value estimates how crucial a particular node (method or task) is for the success of the root task. Specifically, the backbone value for a node estimates the probability that the root task will fail (get zero quality), if the node fails (gets zero quality). If a node has achieved positive quality, its backbone value is zero, since it cannot fail. Otherwise, its backbone value can be calculated simply as follows. We distinguish two types of backbone values: (1) the backbone value from ancestry is calculated along parent/child relationships. (2) the backbone value from enablement is calculated along enables links. If the node QAF is conjunctive (Min, SumAnd) where all children must succeed for a node to succeed, the backbone value from ancestry of the children is identical to that of the parent. If the node QAF is disjunctive (Max, Sum, SumAnd, ExactlyOne), the backbone value from ancestry of the children is the backbone value of the parent divided by the number of children who can still achieve positive quality. If a child node is assured to fail, it does not have a backbone value. Some children may not be able to achieve quality due to expired deadlines, undesired outcomes or disablement. Because the children able to accrue quality and node qualities change during execution, the backbone values are dynamic. Backbone value can also arise from enablement. If a node is the source of an enables NLE, then its backbone value from enablement for that NLE is the backbone value of its target. The total backbone value for a node is calculated by aggregating the backbone value from ancestry and the backbone value from enablement for all outgoing enables NLEs. Different aggregation functions lead to different criticality metrics that give different projections of the state and reward function. Using maximum as an aggregator gives the backbone value along the single-most critical path. Using summation identifies nodes that have multiple outgoing enables. If the maximum backbone value of a method is one, then it must succeed in order for the problem to be successful. Consider the example shown in Figure 4, where the link between M6 and M7 is an enables NLE. Agent 3 may not be able to identify, from its subjective view, that M6 was absolutely necessary for the team to achieve positive quality. By using the backbonevalue criticality metric, Agent 3 can identify M6 as critical and the Opportunistic Inserter would insert it at the first available opportunity, if it was not in the current policy. Also, If M1 and M2 failed, then M3 would be the only child of T2 that could achieve positive quality, and its backbone value would become one. Thus, the backbone value, which changes dynamically, can identify methods whose criticality arises during execution. Because the backbone value of a node depends on the backbone values of neighboring nodes and no agent has the objective view of the graph, agents must forward updated backbone values to other agents. Because the calculations involved are simple and the information flows are unidirectional (down from parents, backwards via NLEs), backbone value computation is timely. It is bounded as it is a single real number. It is global as it aggregates information from
Simulator
Figure 3: CSC Agent Architecture agers. Each Activity Manager is responsible for investigating a specific type of policy modification. When an Activity Manager is triggered, it uses criticality metrics to determine if a policy modification (of the type it is responsible for) should be made. Activity Managers live within a Meta-Manager to ensure that they do not make interfering parallel policy modifications. The State Manager is responsible for computing criticality metrics. This involves incorporating observations from the Execution Controller along with collecting, aggregating and sharing criticality metrics from other State Managers. The State Manager also maintains the current policy, records all modifications by the Activity Managers, and updates the Execution Controller with the latest version. While CSC has many Activity Managers, we focus on the Opportunistic Inserter to demonstrate the PCM approach.
5.
T4 Min
Policy M1
Execution Controller
T3 Sum
OPPORTUNISTIC INSERTER
Method insertion refers to a class of policy modifications whereby new methods are inserted into existing policies. Even within this class there are many types of modifications: Do you allow additions over multiple agents simultaneously? Do you add one method or multiple methods? Can you add methods with windows in the future? The more complex the modification, the more difficult it is to predict the consequences. Our approach of not wandering where we cannot see advises focusing on simple insertions whose effects we can predict. The Opportunistic Inserter only considers single method additions to the policy of the agent where it resides. It can only add a method to start at the current time, i.e., the method’s window must include the current time, and it can only do so if no methods in the current policy are running or can start at the current time. Essentially, if there is nothing else to do, the Opportunistic Inserter can insert a method that can start immediately. Even this focused class of policy modifications can be dangerous. Method insertion can delay the execution of other methods and cause failure. To avoid this danger, the Opportunistic Inserter inserts methods at a low priority. Methods from the initial schedule are added with high priority. The Execution Controller will abort a low priority method if it has not completed and a higher priority method becomes ready to execute. This class of insertions is more predictable in the sense that it cannot delay high priority methods in the future. While it will not harm the mission through delay, we still need to select a method from the set of methods that can start immediately. Our approach advocates creating criticality metrics that reveal the nonlinearities of the reward function: what is the most critical method to insert that is not in the current policy? what is the most critical method to avoid inserting? We describe two types of coordination metrics that help make these decisions: the back-
650
the entire reward graph and accurate with respect to the specific purpose for which it was constructed. Backbreaker Value: The backbreaker value estimates how detrimental a particular node is for the success of the root task. It estimates the probability that the root task will fail (get zero quality), if the node succeeds (gets positive quality). If a node has positive quality, its backbreaker value is zero, since it cannot do further damage. Otherwise, its backbreaker value can be calculated in a manner similar to the backbone value. If a node is a source of a disables NLE, its backbreaker value from disablement is the backbone value of its target. If a node is a child of a node that has positive backbreaker value, its backbreaker value from ancestry can be calculated similarly to backbone values, except parents with disjunctive QAFs give all their backbreaker value to their children and parents with conjunctive QAFs split their backbreaker values among children who are able to accrue positive quality. In the example, if the link between M6 and M7 was a disables NLE, Agent 3 would know from the backbreaker value that it should never insert M6, even if the opportunity arises. The Opportunistic Inserter uses low priority and immediate insertion to enhance the predictability of policy modification. It uses criticality metrics such as the backbone and backbreaker values (among others) to identify nonlinearities. . The backbone and backbreaker values allow an agent to see very far in a focused direction. It knows whether a method is critical, even though its criticality may arise in places of the reward function that it cannot see directly, and from the state of agents it does not communicate with directly. The criticality metrics allow agents to coordinate implicitly. The agent who inserts a backbone method does not explicitly coordinate with affected agents at the time it considers inserting the method. Explicit coordination would require coordinating with all the agents that contribute to the backbone value. The number of such agents can be arbitrarily large, so this would be difficult. Implicit coordination is much simpler and more timely.
6.
STN constraints in order to make such insertions feasible. They use quality estimates to negotiate constraint modifications with other agents and accept constraint modifications when the quality gains of one agent are greater than the quality reductions in other agents. The system uses expected quality and expected duration estimates to establish the STN and negotiate with other agents. Other: Earlier approaches to TAEMS problems include Generalized Partial Global Planning (GPGP) [3] and Design-To-Criteria (DTC) [9]. This approach used a notion of commitments whereby an agent promises to achieve quality on certain nodes by specified times. Agents maintain local policies to achieve their commitments and re-negotiate commitments when they cannot keep them or when the opportunity arises to achieve better quality. Our work on criticality metrics shows that it is crucial to reason and quantify why it is important to achieve or not achieve quality on a node. Any agent that can see a node can see the criticality metrics allowing them to coordinate implicitly. Our approach resembles more a well trained football team. When the players see a situation, they recognize what is important and what is not, and they all know what to do. They don’t need to talk to renegotiate their commitments. Alternate scheduling models that address uncertainty are Simple Temporal Problems with Uncertainty (STPU) [8] and Probabilistic Simple Temporal Problems (PSTP) [7]. STPUs model uncertain durations using lower and upper bounds. A polynomial algorithm can compute activity start times that satisfy all constraints as execution unfolds. If the constraints cannot be satisfied, STPUs provide no measure of the extent to which the constraints cannot be solved. PSTPs extend STPUs by using probability distributions to quantify duration uncertainty. PSTPs cannot be solved in polynomial time, so are not useful for constructing timely metrics. A Distributed Constraint Optimization Problem (DCOP) based solution to CTAEMS problems is addressed in [6]. Uncertainty modeling in DCOPs leads to state space explosion, making it infeasible to find solutions with current algorithms. The timeliness of full centralization, partial centralization and decentralization schemes for multi-agent systems in dynamic domains and solving problems with graphical reward functions was investigated in [2]. Centralization is shown to be a poor strategy under bounded rationality and communication. However, partial centralization that takes advantage of reward structure can make information sharing more timely.
RELATED WORK
Two other approaches were also investigated in the Coordinators program. They represent two distinct and prevalent schools of thought in addressing multi-agent coordination of activities. MDPs: This approach uses distributed Markov Decision Processes (MDPs) as an underlying formalism [4]. When applying this approach under the constraints of the domain, it is infeasible to base a policy on the entire state space even if restricted to that of a single agent. One solution is to choose a subset of possible states that are reachable from the current state, and update this subset periodically; this process is referred to as “unrolling". The reasoning to determine the best actions for these states is based on the subjective view of the reward function. Values for the frontier of the unrolled state space are determined through a fast greedy search. To address inter-agent coupling, negotiated commitments are allowed to bias the reward function obtained from the subjective view to induce desired coordinated behavior [10]. An important difference in the approximation techniques is that whereas MDPs often discard the least probable states, the PCM trims out policies that cannot be accurately analyzed with respect to severe failures. Distributed Scheduling This approach uses a Simple Temporal Network (STN) to create time windows that indicate feasible start times for methods intended for execution [5]. As execution evolves, the system uses STN constraint propagation to update the start intervals of the methods in the schedule. When the STN becomes infeasible, methods complete, or exogenous events arrive, agents engage in speculative schedule modifications. Agents first determine profitable method insertions, and necessary changes to the
7.
EXPERIMENTS
The three approaches were evaluated under two experiments. The data set for the first experiment used CTAEMS scenarios constructed by an independent third party, assisted by two of the original designers of TAEMS. The second experiment used three sets of CTAEMS scenarios: one created by us, and the other two created by the proponents of the Flexible Scheduling and Distributed MDP approaches. These data sets were run with the CSC system, the two systems built according to the Flexible Scheduling and Distributed MDP approaches, a centralized solver that used the objective view, and several baseline systems that we created. The independently created data set consists of 13 groups of scenarios, each group containing 32 similar scenarios, for a total of 416 scenarios. The scenarios were produced using a scenario generator that randomly combined a variety of templates. Each template produces a CTAEMS structure that captures a specific coordination challenge. Examples include (1) Synchronization, where agents must maximize activities started at the same time, (2) Dynamics, where the task structure, NLEs and other constraints are changed after execution has started, and (3) NLE-Chains, where a group of tasks are connected by a variety of randomly chosen NLEs. Each scenario group contains a different mix of instances
651
of these templates. Each group also differs on the settings of scenario generator parameters that controls failure rates, distributions of method outcomes, tightness of release/deadline constraints and activity overlap. The scenarios have between 25 and 70 agents, 848 and 4,752 nodes, and 104 and 781 NLEs2 . Proponents of each approach submitted 64 scenarios each, intended to highlight the strengths of their approach. Some scenarios were handcrafted and others were created by the scenario generator used for the first data set, and subsequently edited. All scenarios contain an initial schedule produced by a centralized scheduler. The simulations for the main systems were run on a cluster of Intel Core Duo machines connected by a Gigabit network. Each agent and the simulator ran on a different machine3 . Message throughput was limited as all inter-agent messages were sent via the simulator where logs were kept. In the 100-agent simulations, agents are able to send between 25 and 65 messages per second. The simulator marked time with pulses that were one second long. Scenarios had horizons between 373 and 1,728 pulses. Method durations varied, but over 95% of them are between 3 and 14 pulses. In scenarios with many agents, several methods could complete on each pulse, i.e.,, dynamism was on the order of a second. The score of a simulation is the quality achieved at the root task at the end of a simulation run. The scores on different scenarios varied significantly from a few hundred to tens of thousands. To normalize each scenario, the best score obtained by any system or baseline was set to100, and the scores of the other system and baselines were scaled accordingly. To give some context to the performance of the systems and to gain further insights into the PCM approach, we created a set of baseline systems that use simple approaches: (1) Coordinated Execution: agents execute only methods in the initial schedule but adjust start times to wait for executing methods and enablers to complete; agents also wait to synchronize, and remove disabled or expired methods. (2) Random Insertion: when idle, agents insert a method randomly chosen from those that could get positive quality, if started immediately. (3) Quality Insertion: when idle, agents insert the method with the potential for the highest quality gain, if started immediately. (4) CSC Insertion: when idle, agents insert the method that would be chosen by the Opportunistic Inserter from the CSC system, according to its criticality metrics. No other Activity Manager functionality was included. All insertion baselines have all the capabilities of Coordinated Execution. We additionally parameterized these baselines by the priority at which methods are inserted. In low-priority (LP) insertion mode, the inserted method will be aborted if it does not finish by the time any method in the initial schedule needs to start. This ensures that inserted methods cannot delay execution of a method in the initial schedule. In high-priority (HP) insertion mode, the agent will wait for inserted methods to finish. All baselines and CSC were run on the complete set of scenarios twice: once with the initial schedule (IS) and once without the initial schedule. We have no data on the performance of the Flexible Scheduling and Distributed MDP approaches without an initial schedule because we don’t have access to the software for the corresponding systems. Figure 5 shows the results. Rows represent systems and columns represent scenario groups. The num-
bers in parenthesis represent the number of agents in each scenario in a group. The cells show the average normalized scores for all systems by scenario group. In the third-party scenarios, each cell shows the average normalized score over 32 similar scenarios. In the team scenarios, each cell shows the average normalized score for the 64 scenarios each team submitted. The rows are partitioned into three groups. The first two show the scores for the baselines, with and without the initial schedule. The third group shows the scores for the main approaches. We show two rows for the CSC system to compare scores with and without the initial schedule. The cells are shaded to show performance with respect to two baselines marked as BAR 1 and BAR 2. BAR 1 shows the scores of random method insertion on a blank schedule. BAR 2 shows the scores of random insertion on an initial schedule that was constructed using a centralized scheduler with access to the full objective view. BAR 1 is the simplest possible baseline. Any cell with a score not significantly better than BAR 1 has a white background (worst performance)4 . The BAR 2 baseline is also extremely simple, but benefits from the initial schedule. All scores that are not significantly better than the BAR 2 scores are shaded in light gray (second worst). All systems had access to the same initial schedule, so they would be expected to perform better than BAR 2. Scores significantly better than the BAR 2 baseline are colored in the next shade of grey (expected performance). They represent scores that outperform this baseline. Scores that beat BAR 2 and are over 90 are shaded in dark grey (good performance). Finally, the best score in each scenario group has a white border around it.
8.
DISCUSSION
Coordinated Execution: Coordinated Execution with the initial schedule shows that the data set has many scenarios where simply executing the initial schedule without modification leads to mediocre results (Average: 38). If the evolution of the schedule is very unpredictable (Contingent, Dynamic, Real World), this strategy leads to complete failure. Random Insertion (LP): Random Insertion (LP) (BAR 2) is a very simple instantiation of our approach. It has predictability but lacks criticality metrics. It is a predictable policy modification because low priority method insertion cannot cause delays on the existing schedule. The only possible negative effect is that inserted methods may disable or hinder other methods that may be important in the future. This strategy significantly improves over Coordinated Execution (Average: 77 vs 38). However, in the Negative NLEs group, which has scenarios with high density of disables and hinders NLEs, Random Insertion (LP) lost significantly to Coordinated Execution (52 vs 80). This shows the need for a criticality metric to avoid insertion of damaging methods. The use of the CSC criticality metrics (CSC Insertion (LP)) boosts the score significantly over Coordinated Execution (96 vs 80). The Random Insertion (LP) result is remarkable. Even though it lacks any criticality metrics, its score is extremely close to Flexible Scheduling (Average: 77 vs 80) and much higher than Distributed MDP (Average: 77 vs 56). Both of these approaches use a significantly larger set of policy modification techniques. We hypothesize that the reason these approaches don’t perform better is because they cannot accurately predict whether policy modifications are indeed improvements. The inaccuracies allow agents to fall in ravines frequently enough to undo any gains accrued through
2 A scenario group with 100 agents, ∼13,000 nodes and ∼700 NLEs was also used (CSC:100, MDP:96, Scheduling:94). We didn’t run our baselines on them as each one ran for over 4 hours. 3 The baselines were run on a different configuration where all agents ran on a single machine as Java threads. We ran a subset of scenarios in both configurations and verified that the average score differs by less than 0.1%.
4 Significantly better means that the score difference is greater than the sum of standard errors. Thus, some scores have the same color even with slightly higher values than the baseline.
652
Figure 5: Experimental Results: Average Normalized Scores for Systems and Baselines Over Different Groups of Scenarios. (LP) with and without initial schedules are similar (Average: 97 vs 96). We argue that when techniques are weak, the initial schedule is a useful crutch. But, when techniques are stronger, the initial schedule adds little, and can sometimes hurt: CSC Insertion in the Distributed MDP group: 38 (without IS) vs 23 (with IS). Centralized: The Centralized system is not as constrained by bounded rationality. It can stretch pulses to be as long as needed to compute its next policy modification. It is also not constrained by bounded communication as it has access to the full state and the objective view. However, this system reasons with expected quality and expected duration. So, even though its metrics are timely, bounded and global, they are not accurate. The scores of the Centralized system are lower than the CSC Insertion baseline in all scenario groups except Negative NLEs. In Negative NLEs, the CSC system can identify the key methods that are both backbones and backbreakers. It knows the method should be inserted, however, it lacks a good metric to determine when the method should be inserted. CSC: The full CSC system builds on the CSC Insertion baseline by adding several policy modification strategies using the PCM approach. The improvement over CSC Insertion is small, except in the scenarios submitted by our own team. The reason is that to maintain predictability we had to significantly narrow the set of policy modifications that these strategies were allowed to make. The resulting policy modifications were seldom relevant in the third party scenarios, but they played a crucial role in the scenarios that our team submitted. By following our PCM approach, we ensured that the additional policy modifications that the full CSC system can perform have no detrimental effect, and they yield significant improvements on some scenarios. Team Scenarios: Each team contributed scenarios that highlighted capabilities of their approaches. CSC scenarios required agents to quickly notice situations where methods should be abandoned. Our criticality metric that detects ability to contribute to the root identified such situations, and the Remover Activity Manager enacted the required policy changes. This is why only the full CSC system was able to do well in these scenarios. The Distributed MDP team contributed scenarios where the MDP can be fully unrolled to find the optimal solution. The scenarios contain sequential lotteries where complete uncertainty and reward knowledge is required to solve the problem. Their sys-
a wider class of policy modifications. In Flexible Scheduling, policy modifications are based on metrics calculated from expected quality and expected duration of methods. This can dampen nonlinearities arising from method failure and conjunctive QAFs. In Distributed MDP, the policy modifications are based on two inadequate approximations: (1) The behavior and states of other agents are folded into the local reward function and are not revised frequently enough as states change. (2) The frontier of the unrolled state space is evaluated with a greedy technique leading to inaccurate valuations of possible future states. Both introduce many “blind spots" to nonlinear effects. Random Insertion (HP) and Quality Insertion (HP): Random Insertion (HP) and Quality Insertion (HP) are variations of Random Insertion (LP) where we drift away from PCM by weakening predictability. They insert methods at high priority so they are more likely to damage the existing policy. Though HP and LP Random Insertion achieved the same score (Average: 77), the largest difference favored Random Insertion (LP) (Real World-1: 39 vs 32), suggesting that predictability is a worthwhile feature. The dismal performance of Quality Insertion (HP) against Random Insertion (LP) without initial schedules (Average: 5 vs 48) suggests that the culprit is nonlinearity rather than unpredictability. Highquality methods are on average only twice as long as the shorter methods, yet it appears they are long enough that agents cannot perform critical methods leading to complete failures. CSC Insertion: CSC Insertion extends Random Insertion (LP) by replacing randomness with selection based on criticality metrics. Thus, it more completely instantiates the PCM approach. CSC Insertion uses multiple criticality metrics. A criticality metric which estimates a method’s ability to contribute to the root is used to prune methods that are deemed useless, even though they can accumulate quality. The backbone and backbreaker metrics are used to select methods that must be done and must be avoided. Other criticality metrics about probability and quality break ties when the backbone and backbreaker effects are mild. The results are striking. CSC Insertion outperforms Random Insertion in all scenario groups by a significant margin (Average: 97 vs 77). Initial Schedules: Weak baselines (without criticality metrics) obtained significantly higher scores in scenarios with initial schedules (Average: 77 vs 48 in Random Insertion (HP), 60 vs 5 in Quality Insertion (HP)). However, the scores of CSC Insertion
653
10.
tem performed well on these problems because they were relatively small, and the embedded lotteries were confined to a single agent. Therefore, they bypassed the bounded rationality and communication limitations that arise in general problems. These scenarios show that the focused lights of our current criticality metrics cannot see features in the Distributed MDP scenarios to determine the appropriate course of action. The more general versions of these scenarios are challenging because it is difficult to produce timely and bounded metrics to characterize the situation.
9.
ADDITIONAL AUTHORS
Marcel Becker (Kestrel,
[email protected]), Stephen Fitzpatrick, (Kestrel,
[email protected]), Gergely Gati, (ISIS, Vanderbilt,
[email protected]), Jing Jin, (ISI, USC,
[email protected]), Robert Neches, (ISI, USC,
[email protected]), Nader Noori, (ISI, USC,
[email protected]), Craig M. Rogers, (ISI, USC,
[email protected]), Romeo Sanchez, (ISI, USC,
[email protected]), Kevin Smyth (ISIS, Vanderbilt,
[email protected]) and Chris Van Buskirk (ISIS, Vanderbilt,
[email protected])
CONCLUSION AND FUTURE WORK
11.
Our work suggests that real-time multi-agent problems involving uncertainty, dynamism and a nonlinear reward function involve challenges that are not addressed well by extensions of traditional techniques such as MDPs and scheduling algorithms. These problems are so computationally intensive that all practical algorithms must use heuristics and approximation techniques. However, as expected, the type of approximation has a significant impact in the quality of the results. We show that in these problems it profitable to reason precisely about features of the nonlinear reward function that can significantly amplify failures. The criticality aspect of PCM involves computing criticality metrics (timely, bounded, global and accurate) that identify some feature of the nonlinear reward function that agents can use avoid the amplification of failures. The backbone metric measures how the failure of an activity or task affects the failure of higher level tasks. If the backbone value is close to one, agents should not let that activity fail, even though they do not understand why or how the higher level failure comes about. The backbone and backbreaker metrics reason only about the network structure of the reward function. They do not consider other aspects of the reward involving uncertainty, time or quality. Thus, PCM advocates creating many metrics addressing these other features. Taken together, a collection of criticality metrics to steer agents toward policy modifications that avoid failures that the nonlinear reward will amplify. Backbones consider the significance of a node without considering how likely the node is to fail. It may be more important to support a low backbone activity that has a low probability of success rather than a high backbone activity that is sure to succeed. Thus, we defined criticality metrics that measure how the success of any activity or task affects the probability of success of higher level tasks. To address the quality of activities, we defined criticality metrics that measure the maximum amount of quality that any activity or task should obtain. Quality beyond that maximum cannot contribute to the overall team reward. This metric is zero for useless activities, thereby allowing agents to remove them and work on new tasks. The predictability aspect of PCM advocates considering only subsets of all potential policy modifications, i.e., only those for which criticality metrics can accurately evaluate modifications that lead to unwanted nonlinear effects. PCM is the first step towards solving these difficult problems in distributed, dynamic, uncertain, nonlinear environments. Independent evaluation and our additional experiments show the effectiveness of this approach. We significantly outperform random baselines, distributed-MDP and distributed scheduling-based approaches, and even a centralized system based on a traditional scheduler. Additionally, the alternative approaches are either below or similar to the random baseline. 5 .
REFERENCES
[1] M. Boddy, B. Horling, J. Phelps, R. P. Goldman, R. Vincent, A. C. Long, B. Kohout, and R. Maheswaran. CTAEMS language specification: Version 2.04, 2007. [2] T. Harbers, R. T. Maheswaran, and P. Szekely. Centralized, distributed or something else? Making timely decisions in multi-agent systems. In Proceedings of the Twenty-Second AAAI Conference on Artificial Intelligence, pages 738–743, Vancouver, BC, Canada, July 2007. [3] V. Lesser, K. Decker, T. Wagner, N. Carver, A. Garvey, B. Horling, D. Neiman, R. Podorozhny, M. N. Prasad, A. Raja, R. Vincent, P. Xuan, and X. Q. Zhang. Evolution of the GPGP/TAEMS domain-independent coordination framework. Autonomous Agents and Multi-Agent Systems, 9(1-2):87–143, 2004. [4] D. J. Musliner, E. H. Durfee, J. Wu, D. A. Dolgov, R. P. Goldman, and M. S. Boddy. Coordinated plan management using multiagent MDPs. In Proceedings of the 2006 AAAI Spring Symposium on Distributed Plan and Schedule Management, March 2006. [5] S. Smith, A. T. Gallagher, T. L. Zimmerman, L. Barbulescu, and Z. Rubinstein. Distributed management of flexible times schedules. In Proceedings of the Sixth International Joint Conference on Autonomous Agents and Multi Agent Systems (AAMAS 2007), Honolulu, HI, May 2007. [6] E. Sultanik, P. J. Modi, and W. C. Regli. On modeling multiagent task scheduling as a distributed constraint optimization problem. In Proceedings of the 20th International Joint Conference on Artificial Intelligence, pages 1531–1536, Hyderabad, India„ January 2007. [7] I. Tsamardinos. A probabilistic approach to robust execution of temporal plans with uncertainty. In Proceedings of the Second Hellenic Conference on Artificial Intelligence, pages 97–108, Thessaloniki, Greece, April 2002. [8] T. Vidal and H. Fargier. Handling contingency in temporal constraint networks: From consistency to controllabilities. Journal of Experimental and Theoretical Artificial Intelligence, 11:23–45, 1999. [9] T. Wagner and V. R. Lesser. Design-to-criteria scheduling: Real-time agent control. In Agents Workshop on Infrastructure for Multi-Agent Systems, 2000. [10] S. Witwicki and E. Durfee. Commitment-driven distributed joint policy search. In Proceedings of the Sixth International Joint Conference on Autonomous Agents and Multi Agent Systems (AAMAS 2007), Honolulu, HI, May 2007. for Governmental purposes notwithstanding any copyright annotation thereon. The views and conclusions contained herein are those of the authors and should not be interpreted as necessarily representing the official policies or endorsements, either expressed or implied, of any of the above organizations or any person connected with them.
5 The work presented here is funded by the DARPA COORDINATORS Program under contract FA8750-05-C-0032. The U.S.Government is authorized to reproduce and distribute reports
654