Procedia Social and Behavioral Sciences
Available online at www.sciencedirect.com
Procedia - Social and Behavioral Sciences 00 (2011) 000–000
www.elsevier.com/locate/procedia
Euro Working Group on Transportation
Predicting Air Travel Demand Using Soft Computing: Belgrade Airport Case Study Milica Kalić*, Slavica Dožić, Danica Babić Faculty of Transport and Traffic Engineering, Vojvode Stepe 305, Belgrade 11000, Republic of Serbia
Abstract Travel demand forecast models for three stages (trip generation, trip distribution and airline choice) in the sequential air transportation planning process are developed. In this paper passenger demand will be forecasted using soft computing (fuzzy logic) as well as traditional technique (regression analysis), in order to get more efficient system in terms of route network, flight frequencies and airline fleet capacity. Short term forecast for years 2012 and 2015 is done for Belgrade Airport and its incumbent airline based on historical data and survey data from 2001 to 2010. Airline market share considering competitive airlines will also be determined on the obtained O&D matrix. This paper confirms again that the set of techniques used to predict travel demand can be broadened by fuzzy logic.
© 2011 Published by Elsevier Ltd. Selection and/or peer-review under responsibility of [name organizer] Keywords: Forecast; Travel Demand; Fuzzy Logic; Airline Market Share
1. Introduction The main goal of an airline is to harmonize its offer with passenger demand. In order to realize this airline need to predict travel demand which will facilitate designing of appropriate route network and determining required capacity for corresponding market conditions. For an airline, demand forecasts, together with market share and traffic forecasts, represent the main basis for further revenue, costs, profit and cash flow forecasts, as well as for operational planning. Once an airline posses the corresponding forecast level of demand in a targeted market, its main decision is whether to serve it with non-stop,
* Corresponding author. Tel.: +381-11—30-91-227; E-mail address:
[email protected]
2
Milica Kalić, Slavica Dožić, Danica Babić / Procedia - Social and Behavioral Sciences 00 (2011) 000–000
multi-stop, online, interline connecting or code-shared flights and also, whether this service should be offered at a high frequency (smaller aircraft, higher unit costs) or at low frequency (larger aircraft, lower unit costs). However, each of these options for an airline carries a different set of operational costs and implications on passenger demand, because each offers customers a different set of benefits and costs (shorter travel time, waiting at the airport for transfer, etc). What will be the market share in an O&D market of an airline depends mostly on the following factors: overall demand on the market, the size and structure of the output that airline produces in the market and the size and structure of the output produced by its competitors (Holloway, 2003). The four-stage sequential process of passenger demand planning is common used for predicting passenger demand in the particular market. In the air transport market this process can be reduced on three stages: 1. trip generation that represents the number of passengers generated/attracted by particular airport, 2. trip distribution that represents the traffic flows between the airports, 3. airline choice that represents passenger distribution by airlines. In this paper, the approach to the problem of trip generation in air transportation will be done using multiple regression analysis. Multiple linear regression method will be applied to relate the variation in traffic at Belgrade Airport “Nikola Tesla” to the variation of two independent variables, GDP in Republic of Serbia and number of foreign tourist arrivals. Those two variables are recognized that may influence the future travel demand at this airport and we will use them for short-term forecast to predict the travel demand in years 2012 and 2015. Traffic flows at Belgrade airport could be clustered into two groups, the one that have strong flows and the one with the thin flows. In this paper, we will only consider the group with the strong flows and it is numbered 14 airports in 11 countries. Traffic flows are determined according to the historical data and survey data from 2001 to 2010. Trip distribution for years 2012 and 2015 will be done according to historical data and expert opinion in respect of the conditions on the market. Passengers as a decision makers choose an airline whose service they will use for travel and they are influenced by many factors such as: flight frequency, travel cost, waiting time to be served etc. Those parameters are very easy to determine and passengers often have precise information about them. However, we considered that travel cost and flight frequency, specially compared to the competition service, could be viewed as a perceived travel cost and perceived flight frequency. Defined like that, they are most often “fuzzy” amounts, and passenger might appraise a certain travel cost as being “cheaper”, “similar” or “more expensive” compared to the offer of competing airline. Similar to that, passenger might appraise a certain flight frequency as being “low”, “similar” or “high”. The basic idea of this paper is to develop an airline choice model that suitable describes the fuzziness in the perceived values of parameters that influence airline choice (expressed as airline share on the particular route). The model is based on the rules of approximate reasoning that is, on principles of fuzzy logic. It evaluates airline share on individual route when information is available regarding passenger flows between origins and destinations, travel costs and flight frequencies. Many papers have shown that the fuzzy logic can successfully be applied in sequential procedure of passenger demand forecasting (Teodorović & Kalić, 1995, Kalić & Teodorović, 1999, Kalić & Tošić, 2000, Kalić & Teodorović, 2003). Those papers considered every phase in the transportation planning process (trip generation, trip distribution, modal split and route choice) separately. Kalić & Tošić (2000) developed trip distribution model in air transportation under irregular conditions, when business and recreational trips were almost totally absent (Belgrade Airport case study between 1991 and 2000). The basic assumption in this paper was that the main influence on trip distribution was the number of people emigrating out of the country. Following these researches we developed three-stage sequential air travel demand model that covers 2001-2011 period characterized by very different political and market
3
Milica Kalić, Slavica Dožić, Danica Babić / Procedia - Social and Behavioral Sciences 00 (2011) 000–000
conditions (better political situation, partially open air market, existence of competition, entrance of low cost carriers, etc.) as well as standard of living increase. This paper has 5 sections. After introduction and review of earlier experiences, trip generation model for Belgrade Airport “Nikola Tesla” is presented with short term forecast. In the third section we determined passenger flows by countries and in the fourth section flow share for incumbent airline is obtained by using fuzzy logic. In the last section we gave some concluding remarks and further research. 2. Trip Generation Making a short term forecast for number of passengers, needs to incorporate some of factors influencing on demand. One of the most important drivers for trip generation is GDP. If people earn more money, they will have more surpluses to allocate, and more money to spend for travelling. In order to estimate number of passengers from Belgrade Airport for years 2012 and 2015, we considered GDP per capita. Also we take into consideration foreign tourists arrivals, because this factor is recognized to have important influence on air trip generation at Belgrade Airport. GDP per capita in USD (World Bank, 2012) and foreign tourist arrivals for Republic of Serbia (Statistical Office of the Republic of Serbia, 2012) for 10 years period (2001-2010) are given in Table 1. Table 1. Input and output data for multiple linear regression analysis (2001-2011)
Year
Foreign tourists arrivals (thousands)
GDP per capita (USD)
Real number of passengers (thousands)
Estimated number of passengers (thousands)
Relative error (%)
2001
446
1518
1522
1525
0.2
2002
503
2014
1622
1716
5.8
2003
509
2614
1849
1812
2.0
2004
539
3169
2045
1955
4.4
2005
578
3391
2032
2070
1.9
2006
586
3943
2222
2162
2.7
2007
696
5277
2513
2587
3.0
2008
646
6498
2650
2648
0.1
2009
645
5484
2384
2505
5.1
2010
683
5269
2699
2557
5.3
2011
764
5374
3125
2749
11.2
Taking into consideration those factors as independent variables we used multiple linear regression analysis to forecast value of dependant variable - number of air passengers. The estimating equation that describes the relationship between these variables is given by (1): Pax[t] = 342.45 + 0.002 * Tarr[t] + 0.14 * GDPpc[t], where Pax[t] is expected number of passengers in year t, Tarr[t] is number of foreign tourists arrivals in year t and GDPpc[t] is GDP per capita in year t. Based on (1) we calculated number of passengers from Belgrade Airport for the period 2001-2010, and 2011 was taken as testing year (Tbl. 1). From Table 1 it can be seen that real and estimated number of passengers have the same trend – increasing from year to year, but decreasing only in 2009 because of the effects of economic crisis. Also, we can see that values of relative error are from 0.1 to 11.2 percent,
(1)
4
Milica Kalić, Slavica Dožić, Danica Babić / Procedia - Social and Behavioral Sciences 00 (2011) 000–000
which presents acceptable result. Multiple R is equal to 0.979, while R-square is 0.9584, and adjusted Rsquare is 0.9466. In order to predict total number of passengers in years 2012 and 2015 we needed forecasted values for chosen variables. According to WTO (World Tourist Organization, 2000) tourist arrivals in Serbia are expected to increase 10% per year in the period 2010-2015, which means that number of foreign tourist arrivals in Serbia for 2012 an 2015 will be 841 and 1119 thousands, respectively (Tbl. 2). Expected GDP per capita values are taken from Trading Economics (2012) and for 2012 and 2015 will be 6390 and 8300 USD, respectively (Tbl. 2). Considering these values and equitation (1) we calculated number of passengers at Belgrade Airport which is about 3 millions in 2012 and almost 4 millions in 2015 (Tbl. 2). Table 2. Forecasted values of variables and number of passengers Year
Foreign tourists arrivals (thousands)
GDP per capita
Estimated number of passengers (thousands)
2012
841
6390
3056
2015
1119
8300
3926
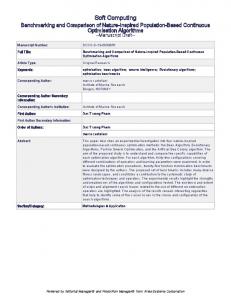
We plotted real values versus estimated values of number of passengers together with the line presenting ideal situation (Fig. 1). From Fig. 1 it can be seen that deviation from ideal is not unacceptable. The output from the first stage – trip generation will be used as input for the next stage – trip distribution. 4500
4000
Estimated number of passengers
3500
3000
2500
2000
Real value Estimated value
1500
1000
500
0 0
500
1000
1500
2000 2500 3000 Real number of passengers
Figure 1. Comparison of real and estimated number of passengers (thousands)
3500
4000
4500
Milica Kalić, Slavica Dožić, Danica Babić / Procedia - Social and Behavioral Sciences 00 (2011) 000–000
3. Trip Distribution Data available for trip distribution was data from Statistical Office of the Republic of Serbia (2012) for period 2004-2009. We took 14 countries with the strongest passenger flows from Belgrade Airport. Those flows for 6 years period are given in Tbl. 3. Table 3. The strongest passenger flows (thousands) from Belgrade Airport (2004-2009) Country
2004
2005
2006
2007
2008
2009
Austria
90
110
111
127
148
145
Denmark
27
25
27
0
28
24
France
106
108
119
123
127
130
Greece
43
87
71
106
115
98
Holland
28
24
30
0
42
27
Italy
141
108
139
165
137
123
Germany
226
257
309
479
473
487
United Kingdom
110
111
118
65
129
124
FRY Macedonia
36
27
41
47
40
42
Russian Federation
85
100
118
123
130
126
Swiss
137
142
165
193
197
187
Bosnia and Herzegovina
33
20
23
26
30
24
Turkey
64
75
67
104
110
125
-
-
-
490
507
385
*
Montenegro
Considering official airport data about annual number of passengers it was possible to calculate flow share by countries in total passenger flow from Belgrade Airport for period 2004-2009 (Tbl. 4). For the years 2012 and 2015 share was obtained by expert opinion taking into account existing competitors and market trends. It is assumed that the flow share (in percent) will be the same in both 2012 and 2015 years. From Tbl. 4 it can be seen that some flow shares for 2012 and 2015 (Denmark, France, Holland, FRY Macedonia, Bosnia and Herzegovina and Greece) are almost the same as flow shares of previous years. For some destinations we can notice increasing trends: Austria, Italy, Germany, United Kingdom, Russian Federation, Swiss and Turkey. Characteristic of these destinations is existence of low cost carrier, expanding airline (Turkish Airlines) and strong hubs (Zurich, Frankfurt and Munich) which induces more passengers and stronger flows. Based on estimated number of passengers at the Belgrade Airport in the years 2012 and 2015, and estimated flow share, we calculated number of passengers for chosen destination in 2012 and 2015 (Tbl. 4). Next step was to identify destination cities in chosen countries and to forecast passenger flows from Belgrade. It was founded 17 destination cities (Tbl. 5).
*
Montenegro became independent country in May, 2006
5
6
Milica Kalić, Slavica Dožić, Danica Babić / Procedia - Social and Behavioral Sciences 00 (2011) 000–000
Table 4. Flow share in total passenger flow from Belgrade Airport
Country
Flow (percentage)
Estimated flow (%)
Estimated flow (thousands) 2012
2004
2005
2006
2007
2008
2009
2012/2015
Austria
4.4
5.4
5.0
5.0
5.6
6.1
6.5
199
255
Denmark
1.3
1.2
1.2
1.1
1.0
1.15
35
45
France
5.2
5.3
5.3
4.9
4.8
5.4
5.4
165
212
Greece
2.1
4.3
3.2
4.2
4.3
4.1
4
122
157
Holland
1.4
1.2
1.3
1.6
1.1
1.2
37
47
Italy
6.9
5.3
6.3
6.6
5.2
5.1
5.5
168
216
Germany
11.1
12.6
13.9
19.1
17.9
20.4
21
642
824
United Kingdom
5.4
5.4
5.3
2.6
4.9
5.2
5.5
168
216
FRY Macedonia
1.8
1.3
1.8
1.9
1.5
1.7
1.7
52
67
Russian Federation
4.1
4.9
5.3
4.9
4.9
5.3
5.5
168
216
Swiss
6.7
7.0
7.4
7.7
7.4
7.8
8
244
314
Bosnia and Herzegovina
1.6
1.0
1.1
1.0
1.1
1.0
1
31
39
Turkey
3.1
3.7
3.0
4.1
4.1
5.3
5.5
168
216
Montenegro
-
-
-
19.5
19.1
16.2
17
519
667
Table 5. Predicted number of passengers in thousands for 2012 and 2015 by cities City
2012
2015
Vienna
199
255
Copenhagen
35
45
Paris
165
212
Athens
98
126
Amsterdam
26
33
Frankfurt
212
272
Munich
212
272
London
168
216
Skopje
52
67
Moscow
168
216
Zurich
244
314
Sarajevo
31
39
Istanbul
168
216
Rome
109
140
Milan
59
76
Tivat
286
367
Podgorica
234
300
2015
Milica Kalić, Slavica Dožić, Danica Babić / Procedia - Social and Behavioral Sciences 00 (2011) 000–000
The way of passenger flow determination is described as follows. Entire flow from Belgrade to Austria is actually flow from Belgrade to Vienna. The same is with flows to Denmark, France, United Kingdom, FRY Macedonia, Russian Federation, Swiss and Bosnia and Herzegovina; they are flows from Belgrade to Copenhagen, Paris, London, Skopje, Moscow, Zurich and Sarajevo. Flow from Belgrade to Athens is calculated by excluding unscheduled flights because they are usually charters during the summer season from Belgrade to tourist resorts. The rest is divided in two flows to Athens and Thessalonica. According to current airport schedule from Belgrade to Athens and Thessalonica, with the assumption that the same situation will be in 2015, we estimated that 80% of traffic flow to Greece goes to Athens. According to current airport schedule from Belgrade to Holland, with the assumption that the same situation will be in 2015, we estimated that 70% of traffic flow to Holland goes to Amsterdam. Flow to Germany is divided between Frankfurt, Munich and the other airports equally, which is estimated considering current airport schedule from Belgrade to Germany and assuming that the same situation will be in 2015. Unscheduled flights are not included in flows to Istanbul, because those flights are usually charters during the summer season from Belgrade to tourist resorts in Turkey. There are two flows from Belgrade to Italy – one to Rome and another to Milan. Taking into account current airport schedule and existence of low cost service to Rome, it is estimated that 65% is flow to Rome and 35% to Milan. Tivat and Podgorica are destinations in Montenegro with 55% and 45% share, respectively. After determining these flows, it is possible to estimate flow share of incumbent airline in the last stage of air transport demand modelling – airline choice. 4. Airline Choice Before presenting airline choice model, let us note that some destinations (Munich, Skopje and Sarajevo) are excluded because there is only one airline on considered destination. A global description of the airline choice model is as follows: according to the minimal tariff comparison between incumbent and competitive airline (IncTariff), and the incumbent share in weekly frequency (% IncFreq), by using fuzzy logic, the passenger flow share of incumbent airline between Belgrade and chosen cities (IncShare) are determined.
h
h
Similar
1
1 Similar
More expensive
Cheaper
-150 -120 -90 -60 -30
0
30 a)
60
90 120
Low
IncTariff
0
20 30
High
40
50
60
70
80
%IncFreq
b)
Figure 2. Membership functions of fuzzy sets: a) Cheaper, Similar, More expensive IncTariff and b) Low, Similar and High %IncFreq
7
8
Milica Kalić, Slavica Dožić, Danica Babić / Procedia - Social and Behavioral Sciences 00 (2011) 000–000
h
1
Very Low
0
10
Low
20
30
Similar
40
50
60
70
IncShare
Figure 3. Membership functions of fuzzy sets Very Low, Low and Similar IncShare
The membership functions of fuzzy sets related to Cheaper, Similar and More expensive tariff of incumbent airline are shown in Fig. 2a), while the membership functions of fuzzy sets related to Low, Similar and High frequency of incumbent airline are shown in Fig. 2b). These fuzzy sets have been defined on the basis of the authors’ experience and estimates. The definitions are believed to be realistic since the authors have dealt with these and similar problems for many years. The membership functions of fuzzy sets Very Low, Low and Similar flow share of incumbent airline are shown in Fig. 3. The approximate reasoning algorithm is comprised of the following rules: Rule 1: If IncTariff is ANY and % IncFreq is LOW, then IncShare is VERY LOW, else Rule 2: If IncTariff is CHEAPER, and % IncFreq is SIMILAR, then IncShare is SIMILAR, else Rule 3: If IncTariff is SIMILAR, and % IncFreq is SIMILAR, then IncShare is VERY LOW, else Rule 4: If IncTariff is MORE EXPENSIVE, and % IncFreq is SIMILAR, then IncShare is VERY LOW, else Rule 5: If IncTariff is CHEAPER, and % IncFreq is HIGH, then IncShare is SIMILAR, else Rule 6: If IncTariff is SIMILAR, and % IncFreq is HIGH, then IncShare is LOW, else Rule 7: If IncTariff is MORE EXPENSIVE, and % IncFreq is HIGH, then IncShare is LOW. The output variable of the fuzzy system is the flow share of incumbent airline in percentage. By applying MAX-MIN fuzzy reasoning and defuzzification by centre of gravity we obtained results given in Tbl. 6. It can be said that by using fuzzy logic “considerably good” prediction of the passenger flow share is obtained. Comparing results of expert opinion with the results obtained by fuzzy logic it can be seen that in 70% of flows the differences are insignificant, and the model shows excellent fit. In the rest of the flows, there are some differences between expert opinion and fuzzy results (Vienna, Rome, Milan and Zurich). In the case of Vienna and Rome offer includes low cost as well as full service which could explain why the model estimated such low share of incumbent airline. Decision variable in
Milica Kalić, Slavica Dožić, Danica Babić / Procedia - Social and Behavioral Sciences 00 (2011) 000–000
those two cases was an IncTariff, but in reality there are strong influences of hub connections and passengers’ loyalty to the national carrier. Table 6. Flow share in 2012 and 2015 Flow share by expert opinion (%)
Flow share by fuzzy logic (%)
Passenger flow in 2012 (thousands)
Passenger flow in 2015 (thousands)
Passenger number per flight, 2012
Passenger number per flight, 2015
Vienna
20
12.2
24.3
31.1
25
32
Copenhagen
35
30
10.5
13.5
101
130
Paris
50
53.3
87.9
113.0
188
241
Athens
40
53.3
52.2
67.2
126
161
Amsterdam
55
53
13.8
17.5
76
96
Rome
25
12
13.1
16.8
72
92
Milan
21
11.1
6.5
8.4
42
54
London
45
30
50.4
64.8
88
113
Moscow
50
51
85.7
110.2
165
212
Zurich
30
13.2
32.2
41.4
62
80
Istanbul
15
13.5
22.7
29.2
87
112
Frankfurt
10
13.3
28.2
36.2
77
99
Tivat
15
13.1
37.5
48.1
16
20
Podgorica
13
13.1
30.7
39.3
28
36
The difference between the results of exert opinion and fuzzy model in the case of flows to Zurich and Milan could be explained by very good schedule offered by competing airline (connections at their hubs), despite of lower tariff offered by incumbent airline. In the next step we calculated absolute value of passenger flows by cities according to obtained results with fuzzy (Tbl. 6) and predicted number of passengers (Tbl. 5). These values were divided by 52 in order to get weekly number of passengers. Taking into consideration the real values of weekly frequency in 2012 and predicted weekly passenger number in 2012 and 2015, we analyzed the capacity offered by incumbent airline (Tbl. 6). The assumption was that incumbent airline will have the same fleet in 2012 and 2015 which consists of two types of aircraft B737 (124 seats) and ATR72 (66 seats). There are four routes (Vienna, Milan, Podgorica and Tivat) where the number of passenger per flight is very low that indicates that the offer is overcapacity. One of the strategies for these routes would be to engage smaller aircraft or to reduce the frequency. But taking into account very strong competition on these routes, reducing the frequency would have negative effect on incumbent share. The next group of routes (Amsterdam, Rome, Zurich and Frankfurt) is characterized by matched capacity with predicted demand. On the rest of routes (Copenhagen, Paris, Athens, London, Moscow and Istanbul) the incumbent airline offered capacity which is lower than predicted passenger demand and indicates that there is possibility to increase capacity. Also, the proposed strategy could lead to increasing the incumbent share on these routes. All the comments above are related to year 2012, but analyzing the results in 2015, it can be concluded that the situation is not going to change significantly, so the proposed strategy could be applied on this year, too.
9
10
Milica Kalić, Slavica Dožić, Danica Babić / Procedia - Social and Behavioral Sciences 00 (2011) 000–000
5. Conclusion In this paper three-stage sequential process of passenger demand planning for predicting passenger demand in the Belgrade airport market is developed. The stages are linked in such way that the output of each stage presents the input for the following one. The first stage - trip generation was estimated by multiple linear regression analysis that related the variation in traffic at Belgrade airport to the variation of two independent variables (GDP per capita and foreign tourist arrivals). The output of analysis has shown high quality results. Trip distribution for years 2012 and 2015 was done according to historical data and expert opinion taking into account existing competitors and market trends. In the third stage – airline choice it was demonstrated how fuzzy logic can successfully be used in predicting flow share of incumbent airline taking into account tariff differences and weekly frequencies. In this stage reasonably good results were obtained in respect to the values obtained by expert opinion. The results could be used in further transportation planning process in order to get more efficient airline network system in terms of route network, flight frequencies and fleet capacity. In the future, it is planned to extend trip distribution model by using different approach for determination of O&D matrix (fuzzy logic and neural network) for getting more accurate prediction. Also, the model could be extended by considering new input (explanatory) variables, quantitative as well as qualitative, which could have influence on airline choice.
Acknowledgements This research has been supported by Ministry of Science and Technological Development, Republic of Serbia, as a part of the project TR36033 (2011-2014).
References Holloway, S. (2003). Straight and Level: Practical Airline Economics. (2nd ed.). Ashgate Publishing Limited, Gower House, Croft Road, Aldershot, Hampshire GU11 3HR, England http://www.tradingeconomics.com/serbia/gdp-per-capita-at-current-prices-in-us-dollars-imf-data.html (March 2012) http://www.worldbank.org (March, 2012) Kalić, M., & Teodorović, D. (1999). Modal Split Modelling Using Fuzzy Logic. Proceedings of the Conference “Modelling and Management in Transportation”. Poznan-Cracow, Poland, pp. 91-96. Kalić, M., & Teodorović, D. (2003). Trip Distribution Modelling Using Fuzzy Logic and a Genetic Algorithm. Transportation Planning and Technology, Vol. 26, No. 3, pp. 213-238. Kalić, M., & Tošić, V. (2000). Soft Demand Analysis: Belgrade Case Study. Proceedings of the 8th Meeting of the Euro Working Group Transportation EWGT and Workshop IFPR on Management of Industrial Logistic Systems “Rome Jubilee 2000 Conference”. Rome, Italy, pp. 271-275. Statistical Office of the Republic of Serbia. (March, 2012). http://webrzs.stat.gov.rs/WebSite/ Teodorović, D., & Kalić, M. (1995). A Fuzzy Route Choice Model for Air Transportation Networks. Transportation Planning and Technology. Vol. 19, No. 2, pp. 109-120. World Tourism Organization. (2000). Tourism 2020 Vision. Volume 4. Europe