Predicting break-points in trading strategies with Twitter
Arnaud Vincent1 & Margaret Armstrong2
Abstract The importance of being able to identify changepoints in financial time series has been stressed by many authors, both for econometric forecasting and for enhancing the performance of trading strategies. Strategies which work well in one type of context may lose money under different circumstances so it is crucial for traders to be able to identify break-points as they occur. Our basic hypothesis is that these breakpoints are usually linked to factors outside the markets such as breaking news or the changes in the socio-political context. The buzz on the internet especially on social networks like Twitter provides an advance indicator of these changes. In this paper we propose a novel approach for identifying micro-breakpoints based on Twitter. In order to measure the impact on trading strategies, of knowing when changes occur, we used a simple genetic algorithm using Forex data as the reference benchmark. It makes a decision every two minutes whether to hold US dollars or euro. We compare its performance to a hybrid algorithm which stops trading and goes through a relearning phase after each Twitter alert. In tests over a 5 month period, the hybrid algorithm performed significantly better than the benchmark algorithm. One unexpected result was the discovery of a wave-like relationship between the time to react to each alert and the performance of the algorithmic trader. We call this the Twitter wave. As our results have only been validated over a 5 month period, longer tests are clearly required but the preliminary results are very promising. If confirmed they open up new perspectives for identifying micro-breakpoints in real-time, for high-frequency trading.
Keywords: Twitter, breakpoints, Forex, genetic algorithms, high frequency trading
Acknowledgments The authors would like to thank Christophe Méheut for his assistance in setting up the genetic database and the real time system to catch and store market and twitter data. Thanks also to the Lollicode team and especially Philippe Breuils for allowing us access to their twitter database and scrapping system.
1
Cerna, Mines-Paristech, 60 Boulevarde Saint Michel 75272, Paris
[email protected] 2 Cerna, Mines-Paristech, 60 Boulevarde Saint Michel 75272, Paris
[email protected]
1 Electronic copy available at: http://ssrn.com/abstract=1685150
Introduction The literature on trading strategies and models for US equities, forex, derivatives etc, is vast. In most cases the authors demonstrate that particular strategies have performed well in certain markets over a given period of time. Pesaran & Timmermann (2002) puts these results in perspective because their performance depends on which market is chosen and when. Phillips (1996) and Timmerman & Granger (2004) argue that good strategies have a limited life because other traders find out about them and so they are rapidly absorbed by the market. The primary difficulty for algorithmic traders is to identify events or changes in the context which make some strategies obsolete. Pesaran & Timmermann (2002) listed a series of exogenous factors (market feeling, speculative bubbles, and political changes) that could cause breakpoints, and developed several methods for identifying them a posteriori. They also envisioned a monitoring system capable of identifying break-points as they occurred or even of anticipating their occurrence so as to improve the performance of trading robots. As traders rapidly become aware of developments in financial markets, we have focussed our research on the impact of factors that are exogenous to the markets. A priori many types of exchanges of information (news, email, the internet) could contain a signal that could be exploited by a monitoring system. To test our approach we need data (i.e. an information medium) to construct relevant indicators and an algorithm whose performance can be analysed. The buzz on the web where millions of messages are exchanged in an informal way may be a suitable medium for our research. The social network Twitter makes it possible to follow the buzz and measure changes throughout the world in real-time and to generate alerts when the context changes. The aim of this research project is to show that the breakpoints in trading strategies correspond to Twitter “alerts” (or to a subset of them). We chose to work with genetic algorithms because they are capable of adapting to gradual changes but are very sensitive to sudden changes in context and should therefore allow us to test our hypothesis. We decided to work with foreign exchange data because it is such a highly liquid market. Why Twitter rather news or emails?
Breaking news would seem to be the natural choice for early warnings of changes in context that might influence financial markets. Two main types of news may be of interest to traders: firstly events that occur at predictable dates (Andersson, 2006) and secondly economic news that would cause traders to readjust their portfolios (Doukas & Meng, 2008; Vega, 2006). But using news has its limits •
The information arrives after the event has occurred and markets only take a few milliseconds after the news breaks to react.
•
While it is easy to keep abreast of news that occurs at predictable dates or that contains certain keywords, it is far more difficult to detect political or social events of an unexpected nature.
This is why we decided not to use news in our research.
2 Electronic copy available at: http://ssrn.com/abstract=1685150
Another possibility was email which provides a real-time source of information that is precise and exhaustive. Collingsworth & Menezes (2009) demonstrated statistical relationships in the emails exchanged between Enron employees in the weeks and months preceding the debacle. Warning signals concerning the approaching crisis were evident in the quantities and the structure of the email exchanges even before the Enron affair became known to the employees or to the public. One important point to note is that Collingsworth & Menezes (2009) did not work with the semantic content of the emails, but only with the frequency of exchanges and the position of the senders in the company hierarchy. Although using emails to detect breakpoints is intuitively appealing, it raises many problems: the sheer quantity of information to process, getting access to the information, concerns about privacy. Consequently this possibility was dropped. Twitter turned out to have several advantages over more traditional means of exchanging information such as news or emails. The development of the internet and of social networking led to the new concept of buzz soon after 2000. This can be defined as successive waves of information coming via different channels on the internet, especially via blogs. The main characteristics of the buzz are that it is uncontrolled and uncontrollable, as well as being exhaustive and real-time. In general it precedes news on the organised media (press, TV, institutional websites). Several research projects have shown the predictive ability of this vast mass of informal information. By searching the web using Google for some heterogeneous topics (economy, politics, finance, even bets on sporting events). Pion (2007) demonstrated its predictive value. Gruhl (2005) showed that the buzz could be used to forecast book sales on Amazon. These results seem to be reliable enough and promising enough to envisage constructing a simple early warning system based on the buzz. Twitter is a micro-blogging platform designed and exploited to encourage the buzz between internet users. It is easy to write a “tweet”, or to read them. The size of the audience can easily be measured. Most important of all, Twitter is a success world-wide. As each “tweet” is limited to a maximum of 140 characters, the word use is more meaningful than much longer news messages on the same subject. The numbers of “followers” could be known for each message as is the number of repeat utilisations or “retweets”. This makes it possible to assess the importance of each message in real-time. Leavitt (2009) carried out an exhaustive study on the way information diffuses via Twitter. That work provides a sound foundation for this research project. One limit to the usefulness of Twitter message is that the content is usually far from the financial markets. However two things can easily be measured: an instantaneous snap-shot of the content of the messages and the level of the buzz as measured by the volume and frequency of the exchanges. In order to delimit our research we have constructed an indicator of “context changes” from the flow of information on Twitter. The first attempts to measure the internet buzz were generally semantic. For example these aimed at identifying the content of the messages or the results of their queries, compared to a reference set. Bollen (2009) worked with this kind of approach to gauge people’s feelings and model them. He was able to measure the impact of certain events such as election results on people’s moral. We decided not to follow his approach because the choice of the words in the
3 Electronic copy available at: http://ssrn.com/abstract=1685150
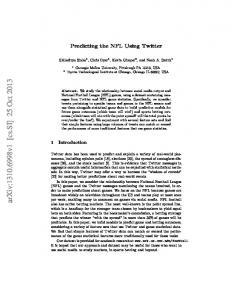
reference could be too restrictive especially if a new event occurs with a new semantic that is not known by the model. Instead we focused on the concept of “change of context” in the wide sense, which is independent of particular words. We wanted to develop a measure of the volatility of Twitter along the lines of the volatility index VIX that measures the state of financial markets in the USA. Its values and variations are considered to reveal traders feelings – whether they are optimistic or pessimistic. Twitter volatility: a high frequency measure of context change One difficulty with constructing an indicator of the volatility of the buzz is that Twitter is so new. As our system has only been storing data from late 2009 onwards, we chose to work with high frequency data using data every 2 minutes over a 5 month period (more than 100,000 data points). By comparison, econometric time series of monthly or quarterly data going back 20 or 30 years contain several hundred data. The start-up, Lollicode3, has developed an end-user application called Twitscoop4, which watches the activity on Twitter all the time. We have set up a procedure for extracting the top 70 new words on Twitter once per minute. This list is added to our data base of words. Our first attempt at measuring the volatility on Twitter consisted of counting the number of new words that appeared in the list from one instant to the next. This approach (Fig 1) showed that there was a sort of “background noise” that depended primarily on the time of day, with certain words that popped up regularly such as 6am, ID twitter, etc. As it would be difficult to filter out the noise, we abandoned this approach.
Figure 1 : First attempt at computing the volatility on Twitter: number of new words that appear on Twitscoop every 2 minutes, as a function of time
Our second attempt was more radical. We counted the number of words that appeared for the first time (that is, new words in our Twitter dictionary). At the outset there were 70 new words (all the words in Twitscoop because the dictionary was empty). From then on the number decreased rapidly and evolved in a range between 0 and 6 per minute (Fig 2). We then defined a change of context as being 2 or more new words (Fig 3). This criterion is undoubtedly rather arbitrary and may need to be refined later. This produces a high frequency measure of volatility with each alert being shown as a vertical blue bar. 3 4
Lollicode SARL http://www.twitscoop.com/
4
Figure 2 : The Twitter volatilty computed as the number of new words that appear in our dictionary for the first time, as a function of time
Figure 3: Simplified representation of the change of context on Twitter as a function of time. A blue vertical line indicates that 2 or more new words appeared in our Twitter dictionary in the preceding minute. Otherwise the colour is white.
Typically there are between 2 and 10 alerts per day. At first this seems radically different from break-point analysis in trading strategies where there are periods of weeks or months between alerts. But for high frequency trading it seems more relevant to provide warning of micro-ruptures in context as revealed by the buzz, especially as the words involved are usually totally outside the financial vocabulary. Testing the Twitter alerts experimentally To test whether these alerts could be useful for traders, we developed a very simple trading strategy using a genetic algorithm because these algorithms adapt themselves to gradual changes but are sensitive to sudden changes. By working with high frequency foreign exchange data, it should be possible to find out whether stopping trading after each Twitter alert has a positive effect on performance even with data over a relatively short period. The second reason for using a genetic algorithm is that as it functions by generating random changes in the algorithm, it was possible to carry large numbers of runs in parallel and hence compare the results. The number of runs and the high frequency (one action per 2 minutes) compensates for the short testing period (only 5 months).
5
Genetic algorithms
Genetic algorithms were developed by transposing the basic concepts of biological reproduction (genetic mutations) to problem solving situations. The main principles were first presented by Holland (1975) and refined by Goldberg (1989). Vallée & Murat (2003) give a very clear description of how genetic algorithms function, of the role of the individuals in the virtual population and of the rules for selection and for reproduction. Over the past 10 years, new applications based on hybrid algorithms have demonstrated the capacity of genetic algorithms to solve complex problems (Fontanili, 1999). Applications to financial markets and more specifically automatic trading date from the 1990s, with the most significant paper being Allen & Karjalainen (1995) who applied the method to shares. Alander (1994) gives a very comprehensive review of the applications to that date. Most of the recent applications to financial data (e.g. Lin, 2005) have concentrated on optimising the parameters in a set of predetermined rules based on strategies widely used by traders. Similarly (Hibayashi, 2009) proposed a very efficient model for optimising the rules for Forex trading. One of the advantages of genetic algorithms is that as the set of possible solutions is constantly evolving, they work well in changing environments. Having said that, few papers have studied how well they function to differing levels and types of changes. One exception is Grefenstett (1992) who demonstrated that there is a correlation between the mutation rate (the proportion of randomness introduced during the reproduction phase) and the speed of convergence of the algorithm in unstable environments. In a study on a trading robot working on the DAX, Schoreels (2003) found that its performance deteriorated when it was used in an environment that was different to the one where the learning phase was done. This highlights the importance of being able to identify break-points in the trading environment. We decided to compare the performance of a basic genetic algorithm with a hybrid one that takes account of the Twitter alerts. Whenever an alert occurs the genetic algorithm stops the trading for a short time and starts again a little later after going through a new learning phase. Experimental procedure using Forex data
Forex data seemed the best suited for our tests because the market is highly liquid and because it is easy to obtain reliable historic data. We set up a very basic algorithm in which the $/€ trader which makes a decision every minute as to whether to convert his/her wealth into the other currency or to keep it in the same currency. To make this decision the trader has data for the previous 120 time steps on the four main currencies (CHF, GBP, JPY, USD). For example at one point in time the changes in the Swiss franc over the past 120 minutes were 1,6% ; 0,5% ; 0,03% ; +1% ; -0,8% ;….. (Table 1). Table 1: An example of the relative variations in the four main curriencies over the past 120 minutes
CHF GBP JPY USD
t-120 -0,1% 0,08% -0,15% -0,23%
t-119 -0,05% -0,8% -0,21% -1,09%
t-118 -0,8% -0,7% -0,05% -0,01%
t-117 +1% -0,86% -0,03% -0,00%
6
… … … … …
t-2 0,03% 0,55% -0,05% -0,25%
t-1 0,5% -0,21% -0,05% -0,21%
t-0 1,6% -0,05% -0,14% -0,40%
The genetic algorithm functions in the following way: •
Each individual is defined by a set of four genes associated with one of the four main currencies
•
Each gene consists of 120 coefficients coded as integers between -10 and +10 (Table 2)
•
At each time t, each individual computes the product of the variations in the currencies (Table 1) times the coefficients (Table 2) and sums them.
•
If the result is positive (e.g. 3.36%) the individual buys euro, otherwise it sells in euro.
•
The cumulative performance of its previous decisions in euro is used as the criterion for selection in the population before the reproduction phase.
So we now have a very basic algorithm that converts from euro to dollars and back again, based on the values of the main four currencies (CHF, GBP, JPY, USD) over the preceding 120 time periods. Table 2: An example of the genes that make up an individual in the genetic algorithm
Gene 1 Gene 2 Gene 3 Gene 4
t-120 -2 0 9 -2
t-119 -4 0 3 -3
t-118 0 0 2 -7
t-117 -1 1 6 9
… … … … …
t-2 8 -8 -2 10
t-1 4 1 2 -10
t-0 9 1 3 0
Results from the empirical tests on the basic algorithm
The experiment was conducted over a 5-month period from October 2009 until March 2010. The starting date, October 2009, is when we started storing data from Twitscoop. Despite the short period, we nevertheless have more than 100,000 observations. Our experimental procedure was as follows: starting from a randomly chosen set of individuals with randomly chosen genes, we carried out 450 runs, all based on exactly the same data and under the same conditions. The results were averaged for sets of 10 runs. Figure 4 shows the percentage gained on average over 10 runs, without using the Twitter alerts. Over all 450 runs the genetic algorithm made a slight profit of 0.56% per month. We accepted this performance without attempting to optimise the choice of the parameters (for example, by varying the percentage of randomness or the reproduction parameters). The results from this algorithm will be used as the basis for the comparison. It is important to note that transaction costs were not taken into account, nor was the bid-ask spread, so the profit is purely theoretical. Our objective was to use the volatility measured on Twitter and the resulting alerts to improve the trading performance. The simplest way was by stopping sending orders for a certain time (here 10 minutes) after an alert. We arbitrarily decided that the appearance of two new words in Twitscoop constituted an alert and should be treated as a potential breakpoint in the series. We recalculated the algorithm’s performance using this new criterion over all 450 runs.
7
Figure 4: Percentage gain or loss on average of 10 runs, without using the Twitter alerts
Results from the hybrid algorithm incorporating the Twitter alerts
Figure 5 compares the new results (red) with the previous ones (blue). In 62% of the cases the algorithm performed better. The average gain rose from 0.56% per month to 1.27%.
Without Twitter alert With Twitter alert
Figure 5: Comparing the results with and without using the Twitter alerts respectively blue & red: percentage gain or loss on average of 10 runs,
In both cases no transaction costs were considered. Had they taken into account, the improvement would be even greater because no orders would be passed in the 10 minutes after each alert and this would reduce the number of orders for which costs had to be paid. So the case we have studied is in fact less favourable to the hybrid approach. Because of the limitations of the computer system set up to carry out the tests, it took between 1 and 2 minutes to obtain the information from Twitscoop and to store the new information in the data base. Traders working in financial institutions would have computer systems that would easily carry out the same operations in a few tenths of a second. So we asked ourselves what would happen if we had been able to detect Twitter alerts much more quickly. How much better would the algorithm have performed? Twitter wave
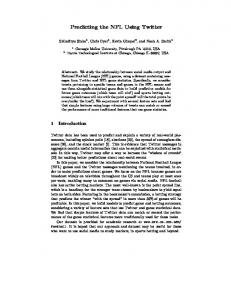
To test the potential for improvement with the IT systems available to traders we repeated our analysis assuming that the Twitter alert had been detected earlier (or later). We recalculated the results of the hybrid algorithm for time differences ranging from -10 minutes to + 10 minutes. As before, 450 runs were carried out for each possible time difference. The results were quite unexpected: Fig 6 shows the percentage gain or loss if the Twitter alert had been
8
detected earlier or later. The wave-like shape reaches a maximum between 3- 5 minutes after (and not before) the Twitter alert. One would expect a delay in taking account of a Twitter alert to have a negative impact on the algorithm's performance. Strange as it may seem, the algorithm has 2-3 minutes after each alert in which to make extra profit, but delays of more 5 minutes can be costly. At this point, it is simply a chart that allows the user to make a profit in the period before a breakpoint occurs in the algorithm’s performance when profits are at their highest, and conversely to avoid losses if the alert is ignored.
Figure 6: Twitter wave: percentage gain or loss on average over 450 runs, if the Twitter alert had been made several minutes earlier or later. The maximum gain occurs if the information had been known 4 minutes late.
Conclusions The preliminary results from these experimental tests are encouraging. They open up new perspectives for detecting breakpoints in the performance of high frequency trading strategies by using information available to the public from Twitter. The method provides a new way of defining, detecting and measuring breakpoints. We were also able to demonstrate the existence of a correlation between the buzz seen on Twitter and variations in the €/$ exchange rate. This correlation is most marked between 4 and 6 minutes before the break-point in the trading strategy occurs, and takes the form of a wave, which we call the Twitter Wave. As the tests were carried out over a relatively short period (5 months from October 2009 until March 2010), some caution is required when interpreting the results. Further testing will be required. Unfortunately at this point in time we lack the computing power to carry out the tests over longer periods. If further testing does confirm the existence of the Twitter Wave, it would constitute a useful tool for high frequency traders allowing them to “surf” over the break-points and to improve their profits.
9
References ALANDER J. T. (1994), “An indexed bibliography of genetic algorithms in economics”, Report Series No. 94-1-ECO, University of Vaasa, Finland. ALLEN F. AND & KARJALAINEN R.. (1993), “Using algorithm genetic to find technical trading rule”, Journal of Financial Economics, vol 51 (1999), n°2, february 1999, pp. 245-271(27). ANDERSSON M. (2006). “Which news moves the euro area bond market ?”, German Economic Review, Volume 10 Issue 1 (2009), pp 1-31. BOLLEN, J. (2009). “Modeling public mood and emotion : Twitter sentiment and socioeconomic”, eprint arXiv:0911.1583, submitted to WWW2010. COLLINGSWORTH, B. AND MENEZES R. (2009), “Identification of Social Tension in Organizational Networks”, Studies in Computational Intelligence, vol. 207/2009, pp. 209-223. GOLDBERG D. (1989), “Genetic Algorithm In Search, Optimization And Machine Learning”, Addison-Wesley. DOUKAS J. AND MENG L. (2009), “Asymmetric Asset Price Reaction to News and Arbitrage Risk”, Review of Behavioral Finance, vol.1 (2009), n°1-2, pp.23-43. FONTANILI F. AND VINCENT A. (2000) : "Flow simulation and genetic algorithms as optimization tools", International Journal of Production Economics (2000), vol 64, issues 1-3, 1 march 2000, pp. 91-100 GREFENSTETTE J. (1992), “Genetic algorithms for changing environments”, Parallel problem solving frome nature (1992), pp. 137-144, Männer & Manderick GRUHL D. (2005), “The Predictive Power of Online Chatter”, International Conference on Knowledge Discovery and Data Mining (2005), Research track paper, pp. 78-87. HIRABAYASHI A. (2009), “Optimization of the trading rule in foreign exchange using genetic algorithm”, Proceedings of the 11th Annual conference on Genetic and evolutionary computation (2009), pp. 1529-1536. HOLLAND J.H. (1975), “Adaptation In Natural And Artificial Systems”. MIT Press (1992). LEAVITT A. (2009), “New Approaches for Analyzing Influence on Twitter”, Web Ecology Project, Pub. 04 (2 September 2009). LIN L. (2005), “Genetic Algorithms for Robust Optimisation in Financial Applications”, The IASTED International Conference on Computational Intelligence (CI 2005), ACTA Press, Calgary, Canada, pp. 387-391.
PESARAN H. AND TIMMERMANN A. (2002), « Market timing and return prediction under model instability », vol. 9(5), pp. 495-510, December, Elsevier. PESARAN H. AND TIMMERMANN A. (2004), « Real Time Econometrics », Econometric Theory (2005), 21 : 212-231 Cambridge University Press.
10
PHILLIPS, P. (1996). “Econometric model determination’. Econometrica, 64, 4: pp. 763 812. PHILLIPS P. (2003), “Laws and Limits of Econometrics”. The Economic Journal 2003, vol. 113, Issue 486, pp. C26 - C52 PION S. (2007), “The Internet Democracy: A Predictive Model Based on the Web”. Thesis submitted in partial fulfillment (2007). University of Rhode Island. SCHOREELS C. (2004), “Agent based Genetic Algorithm Employing Financial Technical Analysis for Making Trading Decisions Using Historical Equity Market Data”. Proceedings of the IEEE/WIC/ACM International Conference on Intelligent Agent Technology (2004), pp. 421-424, IEEE Computer Society. TIMMERMANN A. AND GRANGER C. (2004), “Efficient Market Hypothesis and Forecasting”, International Journal of Forecasting 2004, pp.15-27 VALLEE T. (2004), “Présentation des algorithmes génétiques et de leurs applications en économie”. Revue d'économie politique, 2004. VEGA C. (2006), Stock Price reaciton to public and private information Journal of Financial Economics, 2006, pp.103-133.
11