we present the Social Network Enabled Flu Trends (SNEFT) framework ... We further devise auto-regression models to .... Tweetminster, a media utility tool design to make. UK politics ... A tweet has the User Name, the Post with status id and.
Predicting Flu Trends using Twitter Data Harshavardhan Achrekar ∗
∗
Avinash Gandhe
Department of Computer Science University of Massachusetts Lowell Lowell, MA 01854
†
†
Ross Lazarus
‡
Scientific Systems Company Inc 500 West Cummings Park Woburn, MA 01801
Abstract— Reducing the impact of seasonal influenza epidemics and other pandemics such as the H1N1 is of paramount importance for public health authorities. Studies have shown that effective interventions can be taken to contain the epidemics if early detection can be made. Traditional approach employed by the Centers for Disease Control and Prevention (CDC) includes collecting influenza-like illness (ILI) activity data from “sentinel” medical practices. Typically there is a 1-2 week delay between the time a patient is diagnosed and the moment that data point becomes available in aggregate ILI reports. In this paper we present the Social Network Enabled Flu Trends (SNEFT) framework, which monitors messages posted on Twitter with a mention of flu indicators to track and predict the emergence and spread of an influenza epidemic in a population. Based on the data collected during 2009 and 2010, we find that the volume of flu related tweets is highly correlated with the number of ILI cases reported by CDC. We further devise auto-regression models to predict the ILI activity level in a population. The models predict data collected and published by CDC, as the percentage of visits to “sentinel” physicians attributable to ILI in successively weeks. We test models with previous CDC data, with and without measures of Twitter data, showing that Twitter data can substantially improve the models prediction accuracy. Therefore, Twitter data provides real-time assessment of ILI activity.
I. I NTRODUCTION Seasonal influenza epidemics result in about three to five million cases of severe illness and about 250,000 to 500,000 deaths worldwide each year [1]. Reducing the impact of seasonal epidemics and pandemics such as the H1N1 influenza is of paramount importance for public health authorities. Studies have shown that preventive measures can be taken to contain epidemics, if an early detection is made during the germination of an epidemic [2], [3]. Therefore, it is important to track and predict the emergence and spread of flu in the population. The Center for Disease Control and Prevention (CDC) monitors influenza-like illness (ILI) cases, by collecting data from sentinel medical practices, collating the reports and publishing them on a weekly basis. As diagnoses are made and reported by doctors, the system is almost entirely manual, resulting in a 1-2 weeks delay between the time a patient is diagnosed and the moment that data point becomes available in aggregate ILI reports. Public health authorities need to be forewarned at the earliest time to ensure effective preventive intervention, and this leads to the critical need of more efficient and timely methods of estimating influenza incidences. Several innovative surveillance systems have been proposed to capture the health seeking behavior and transform them into
Ssu-Hsin Yu ‡
†
Benyuan Liu
∗
Department of Population Medicine Harvard Medical School Boston, MA 02101
influenza activity indicators. These include monitoring call volumes to telephone triage advice lines [4], over the counter drug sales [5], and patients visit logs to Physicians for flu shots. Understanding that human interaction on the web is a valuable source of sensing health trends, Google Flu Trends utilizes aggregated web search queries pertaining to influenza to build a comprehensive model that can estimate nationwide as well as state-level ILI activity [6]. In this paper we investigate the use of a novel data source, namely, messages posted on Twitter, to track and predict the level of ILI activity in a population. Twitter has become popular platforms for people to share news and events in their daily lives, including their mood, health status, travel, entertainment, etc. Data collected from twitter represents a previously untapped data source for detecting the onset of a flu epidemic and predicting its spread. Our approach assumes twitter users as “sensors” and the collective message exchanges with a mention of flu such as “I got Flu” and “down with swine flu” as early indicators and robust predictors of influenza. Although many of these data are noisy individually, in aggregate they reveal the underlying epidemic pattern in time and space. ILI activity is known to follow a seasonal pattern, and successive weekly counts tend to be highly correlated. Using both the information in previous weeks of CDC data and Twitter activity measures, we may be able to take advantage of the additional real time information about ILI activity present in Twitter data to help predict the underlying ILI activity. We collected tweets and the location information of Twitter users who mentioned about flu descriptors in their tweets starting from October 18, 2009 until present. Until October 23, 2010 we have collected 4.7 million tweets from 1.5 million unique users from Twitter. Since CDC does not provide weekly ILI activity data for the period from May 23, 2010 to October 9, 2010, we have 31 weeks of CDC data for the Twitter dataset. For the analysis, retweets of previous posts and tweets from the same users within a certain period are removed from the datasets as these tweets do not present new ILI cases. We found the number of flu related tweets in Twitter is highly correlated with the CDC data with a Pearson correlation coefficient of 0.9846. We consider auto-regression models that predict future health system load such as the number of ILI cases in a population next week. The models predict data collected and published by CDC, as the percentage of visits to “sentinel” physicians attributable to ILI in subsequent
weeks. We test these models with previous CDC data, with and without measures of Twitter data, showing that Twitter data can substantially improve the model fits. Twitter data provides real-time assessment of flu and can be particular useful when the CDC data for “true” ILI activity is not available due to the delay in the CDC data collection process. The rest of this paper is organized as follows: Section II describes the related work that harness the collective intelligence of OSN users, in an effort to explain and in some events predict real-world outcomes. In Section III, we present our data collection methodology for extracting relevant information from Twitter in the SNEFT architecture. Detailed data analysis are performed in Section IV to establish correlation with CDC data. In Section V we present statistical models to predict ILI activity and evaluate the performance. Finally we conclude in Section VI and provide acknowledgements in Section VII.
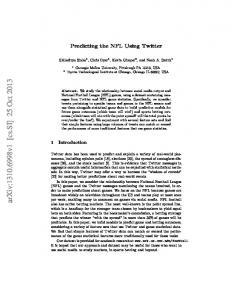
A. SNEFT Architecture We propose the SNEFT architecture in Figure 1 along with its crawler, predictor and detector components, as our solution to track and predict flu activity with certain accuracy. CDC
Fig. 1.
The system architecture of SNEFT.
ILI reports and other influenza related data are downloaded into “ILI Data” database from its website. A list of flu related keywords (“Flu” , “H1N1” and “Swine Flu”) that are likely to be of significance are used by OSN Crawler as inputs into OSN public search interfaces to retrieve publicly available posts having mention of those keywords. Relevant information about the posts are collected along with the relative keyword frequency and stored in a spatio-temporal “OSN Data” database for further data analysis. Only aggregated anonymous information (e.g., keyword frequencies for a given geographical location) will be obtained. No user identities or identity connections will be used in the study. Autoregressive Moving Average (ARMA) model is used to predict ILI incidence as a linear function of current and past OSN data and past ILI data thus providing a valuable “preview” of ILI cases well ahead of CDC reports. Novelty detection techniques are used to continuously monitor OSN data, and detect transition in real time from a “normal” baseline situation to a pandemic using the volume and content of OSN data. Hence SNEFT is capable of providing a timely warning to public health authorities for further investigation and response.
II. R ELATED W ORK A number of studies have been conducted on different forms of social networks like Del.icio.us, Facebook, Flickr, Linkedln, Wikipedia and Youtube etc. Sitaram et al. demonstrated how social media content like chatter from Twitter can be used to predict real-world outcomes of forecasting box-office revenues for movies [7]. Sakaki et al. used a probabilistic spatiotemporal model to build an autonomous earthquake reporting system in Japan using twitter users as sensors and applying Kalman filtering and particle filtering for location estimation [8]. Meme Tracking in news cycles as explained by Leskovec et al. was an attempt to model information diffusion in social media like blogs and tracking handoff from professional news media to social networks [9]. Twitter has been used for real-time notifications such as large-scale fire emergencies, downtime on services provided by content providers [10] and live traffic updates. There have been efforts in utilizing twitter data for predicting national mood [11], currency tracing and performing market and risk analysis. Tweetminster, a media utility tool design to make UK politics open and social, analyses political tweets, to establish the correlations between buzz on Twitter and election results. Ginsberg et al. in his paper discussing his approach for estimating Flu trends proposed that the relative frequency of certain search terms are good indicators of the percentage of physician visits and established a linear correlation to weekly published ILI percentages between 2003 and 2007 for all nine regions identified by CDC [6]. In June 2010, we introduced SNEFT architecture as a continuous data collection engine which combines the detection and prediction capability on social networks in discovering real world flu trends [12].
B. Twitter Crawler In this subsection we briefly describe the methodology for collecting our datasets. Based on the Streaming Real time Search Application Programming Interface (API) provided by the Twitter sites, we develop a crawler to fetch data at regular time intervals. Figure 2 depicts the Twitter crawler component within the SNEFT architecture. The search API
III. DATA C OLLECTION We describe our data collection methodology by introducing Social Network Enabled Flu Trends (SNEFT) architecture, providing description of our datasets, exploring strategies for data cleaning, applying filtering techniques in order to perform quantitative spatio-temporal analysis on the collected data.
Fig. 2.
2
The Twitter Crawler component of SNEFT Architecture.
embeds Flu indicators like “Flu”, “Swine Flu” and “H1N1” as input parameters into an HTTP URL request and fetches a real time response stream with entries spread across the global search space having the keywords in reverse-time order. Online Social Networks reflects real world user interactions and Twitter has received much attention recently from a research perspective because of its growing popularity, realtime nature and increased data volumes. A tweet has the User Name, the Post with status id and the Time stamp attached with each post. From the twitter’s username we can get profile details attached to every user which include number of followers, number of friends, his/her profile creation date, location and status update count. In addition, 3G enabled mobile devices can make use of mobile clients to access and update social content. A user has an option to make his location public through a mobile device if he wishes to, or provide location details in his profile page. The location field is relevant to our research since it helps us in tracking the current/default location of a user. Geo location codes are attached to the message in a location enabled mobile post. Such geo-tagged content will improve the availability and accuracy of the geographic information tied to influenza related OSN posts. For all other purposes, we assume the location attribute within the profile page to be his/her current location and pass it as an input to Google’s location based web services to get geo-location codes (i.e., latitude and longitude) along with the country, state, city with a certain accuracy scale. All the data extracted from posts and profile page are stored in a spatio-temporal “OSN data” Database. As our study is restricted to users who are posting from within USA, we apply country filters to get quantitative data on users of our interest. We also exclude organizations that posts multiple times in a day on flu related activities and users who have subscribed to RSS feeds.
Number of Tweets (in %)
15%
10%
5%
0%
CA NY TX FL IL OH PA GA MI VA MA NC WA MO NJ AZ MD TN DC IN OR WI MN CO AR NV LA SC KY AL CT OK UT IA KS MS NE RI HI NM WV ME ID NH MT DE ND WY AK VT SD PR
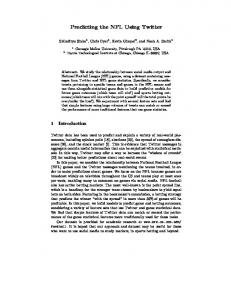
Fig. 3.
State-wise Distribution of USA users on Twitter for flu postings
much to our expectations, with high traffic volumes being witnessed from late morning to early afternoon and less tweet posted from midnight to early morning, reflecting people’s work and rest hours within a day. Average daily usage pattern within a week shown in Figure 5 suggests a trend on OSN sites with more people discussing about flu on weekdays than on weekends. Note that our observed usage patterns in Twitter are consistent with previous observations for other OSNs [13]. 7%
Number of Tweets (in %)
6%
5%
4%
3%
2%
1%
01
02
03
04
05
06
07
08
09
10
11
12
13
14
15
16
17
18
19
20
21
22
23
24
Hour of the Day
Fig. 4.
Hourly Twitter usage pattern in USA
18%
IV. DATA S ETS
16%
Number of Tweets (in %)
14%
We searched and collected tweets and profile details of Twitter users who mentioned about flu descriptors in their tweets starting from Oct 18th, 2009 and lasting until Oct 31st, 2010. So far we have 4.7 million tweets from 1.5 million unique users along with their social relationship from twitter. Due to a power outage on our data collection site there was no data collected from January 18, 2010 till January 20, 2010. Location details can be set to public or private from the profile page or mobile client. In our Twitter dataset 30.6% users are from USA, 41.3% users are outside USA and 28.1% users have not published their location details. Within USA, we have seen users who tweeted about flu in all 50 states and District of Columbia. Figure 3 shows the state-wise distribution of users. Figure 4 shows percentage of unique Twitter users who mentioned about flu in tweets at different hours of the day. All status posting times (tweet timestamp in GMT) are converted to the local timezone of the individual profile. Day light saving are also applied within required time frame. The hourly activity patterns observed at different hours of the day are
12% 10% 8% 6% 4% 2% 0
Fig. 5.
SUNDAY
MONDAY
TUESDAY WEDNESDAY THURSDAY
FRIDAY
SATURDAY
Average daily Twitter usage within a week
For later analysis, Twitter dataset needs to be processed to discount retweets and successive posts from same users within a certain syndrome elapsed time. These two issues are explained as follows: • Retweets: A retweet is a post originally made by one user that is forwarded by another user. For flu tracking, a retweet does not indicate a new ILI case, and thus should not be counted in the analysis. Out of 4.7 million tweets we collected, there are 450,000 retweets, accounting for 9.5% of the total number of tweets. • Syndrome elapsed time: An individual patient may have multiple encounters associated with a single episode of 3
70000
illness (e.g., initial consultation, consultation 1-2 days later for laboratory results, and follow-up consultation a few weeks later). To avoid duplication from this common pattern of ambulatory care, the first encounter for each patient within any single syndrome group is reported to CDC, but subsequent encounters with the same syndrome are not reported as new episodes until more than six weeks has elapsed since the most recent encounter in the same syndrome [14]. We call it syndrome elapsed time. In our dataset, we remove tweets from the same user within a certain syndrome elapsed time, since they do not indicate new ILI cases.
Yes No No No No
Number of Twitter users posting per week
40000
30000
20000
0 0
1
2
3
4 % ILI visit
5
6
7
8
Fig. 6. Number of Twitter users per week versus percentage of weighted ILI visit by CDC 9
% physician visits (CDC) Original Twitter Data Filtered Twitter Data
8
percentage of ILI visits
7
6
5
4
3
2
1
0
20 w 19 w 18 w 17 w 16 w 15 w 14 w 13 w 12 w 11 w 10 w 9 w 8 w 7 w 6 w 5 w 4 w 3 w 2 w 1 w 52 w 51 w 50 w 49 w 48 w 47 w 46 w 45 w 44 w 43 w 42 w
Retweets
50000
10000
We created different datasets consisting of the original Twitter dataset, Twitter dataset without retweets, Twitter dataset without retweets and having no tweets from the same user within a syndrome elapsed time of 1 week, 2 weeks, and 6 weeks, respectively. We compute the correlation between these datasets and the CDC data (percentage of weighted ILI visits). Table I shows the correlation coefficients and the root mean-squared errors (RMSE) of a linear regression between the datasets and the CDC data. Correlation coefficient is a statistical measure of the association between two variables and ranges between [-1, 1]. The sign denotes whether two variables are positively or negatively related and the absolute value corresponds to their correlation strength. The RMSE of a fit is the square root of the average squared distance of a data point from the fitted line. Lower values of RMSE indicate better fit. RMSE is a measure of how accurately the model predicts the response. Twitter Dataset Syndrome Elapse Correlation Time coefficient NIL 0.9807 NIL 0.9829 1 week 0.9846 2 week 0.9838 6 week 0.9755
% ILI visit v/s Twitter users Fitted line
60000
Fig. 7. Percentage of weighted ILI visit by CDC, Original Scaled Twitter dataset and Scaled Twitter dataset filtered by retweets and syndrome elapse time of one week displayed on weekly basis
RMSE errors 0.355 0.3348 0.318 0.3256 0.3998
data collection mechanism was active and CDC was publishing their reports online. V. T WITTER I MPROVES P REDICTION OF I NFLUENZA DATA We consider statistical models predicting future health system load such as the number of Influenza Like Illness (ILI) cases expected next week. The models predict data collected and published by the CDC, as the percentage of visits to “sentinel” physicians attributable to ILI in successive weeks. We test our models with previous period CDC data, with and without measures of Twitter activity, showing that Twitter data improves model fit substantially.
TABLE I C ORRELATION BETWEEN T WITTER D ATASETS AND CDC.
Comparing these different dataset with CDC data we found that the dataset without retweets and having no tweets from the same user within syndrome elapsed time of one week (highlighted in Table I) yields the highest correlation coefficient (0.9846) with the CDC data. This dataset will be used for all successive experiments. The relationship between the dataset and the CDC data is illustrated in Figure 6, which shows a very close to linear relationship between the two datasets. Increase in number of users tweeting about flu related activity is accompanied by increase in the percentage of weighted ILI visits reported by CDC in the same week. Finally we provide a single plot in Figure 7 that sketches CDC’s percentage of ILI visits to physician with the original Twitter data and Filtered Twitter data both normalized to the scale of CDC data for a time-span of thirty one week when our
A. Model Structure The general form of the models used in experiment is written in the auto-regression with exogenous inputs (ARX) form [15], [16]: ARX Model n−1 m X X bj u(t − j) + c + e(t) (1) ai y(t − i) + y(t) = i=1
j=0
where t indexes weeks, y(t) denotes the percentage of physician visits due to ILI in week t, u(t) represents the number of 4
CDC data in week t, the most recent CDC data is from week t − 2. If the CDC data lag is more or less than two weeks, the above equations can be easily adjusted accordingly.
unique Twitter users with flu related tweets in week t, and e(t) is a sequence of independent random variables. c is a constant term to account for offset. In our tests, the number of unique Twitter users u(t) is defined as Twitter users without retweets and having no tweets from the same user within syndrome elapsed time of 1 week. This definition avoids statistical bias from counting a single infected individual case more than once per ILI episode. The rationale for the model structure in Eq. (1) is that Twitter data provides some independent real-time assessment of influenza as events in Twitter text. Unfortunately, the signal is carried by a chaotic, noisy data stream and may be disturbed from time to time by events only indirectly related to cases of ILI. The CDC aims to provide a valid physician confirmed ILI diagnosis, as a measure of “true” population ILI activity but is prone to delays. ILI activity is known to follow a seasonal pattern, and successive weekly counts tend to be highly correlated. Using both the information in previous weeks of CDC data and Twitter activity measures, we may be able to take advantage of the additional real time information about ILI activity present in Twitter data to help locate the signal of underlying ILI activity. In the experiment, we vary m from 0 to 2 and n from 0 to 3 in Eq. (1). Within those ranges, m = 0 or n = 0 represent models where there are no CDC data y or Twitter data u terms present respectively. Also, if m = 0 and n = 1, we have a linear regression between Twitter data and CDC data. If n = 0, we have standard auto-regressive (AR) models. Since the AR models utilize past CDC data, they serve as baselines to validate whether Twitter data provides predictive power beyond historical CDC data. The objective of the model is to provide timely updates of the percentage of physician visits. To predict such percentage in week t, we assume that only the CDC data with at least 2 weeks of lag is available for the prediction if past CDC data is present in a model. The 2-week lag is to simulate the typical delay in CDC data reporting and aggregation. For the Twitter data, we assume that the most recent data is always available if a model includes the Twitter data terms. In other words, the most current CDC or Twitter data that can be used to predict the percentage of physician visits in week t is week t − 2 for the CDC data and week t for the Twitter data. To predict the flu cases in week t using the ARX model in Eq. (1) based on the CDC data with 2 weeks of delay and/or the up-to-date Twitter data, we apply the following relationship. Prediction with ARX Model n−1 m X X bj u(t − j) (2) ai y(t − i) + yˆ(t) = ai yˆ(t − 1) + yˆ(t − 1) =
i=1
ai y(t − i − 1) +
Based on the ARX model structure in Eq. (1), we conducted tests for different combinations of values for m and n. We currently have only 31 weeks with both Twitter activity and CDC data available (10/18/2009–05/16/2010). It is noted in our tests that, due to power outage the Twitter data for the week of 1/17/2010 was artificially created from the average of those from the two neighboring weeks. Due to the limited data samples, we adopted the K-fold cross validation approach to test the prediction performance of the models listed above. In a typical K-fold cross validation scheme, the dataset is divided into K (approximately) equally sized sub-sets. At each step in the scheme, one such subset is used as the test set while all other subsets are used as training samples in order to estimate the model coefficients. Therefore, in a simple case of a 30-sample dataset, 10-fold cross-validation would involve testing 3-samples in each step, while using the other 27 samples to estimate the model parameters. In our case, the cross-validation scheme is somewhat complicated by the dependency of the sample y(t) on the previous samples, y(t − 1), . . . , y(t − m) and u(t), . . . , u(t − n + 1) (see Eq. (1)). Therefore, the first sample that can be predicted is y(max(m + 1, n)) not y(1). In fact, since we are predicting “two weeks ahead” of the available CDC data, the first sample that can be estimated is actually y(max(m + 2, n + 1)). Since, prediction equations cannot be formed for y(1), . . . , y(max(m + 2, n + 1) − 1), those samples were not considered in any of the K subsets during our experiment to be evaluated for prediction performance. However, they were still used in the training set to estimate the values of the coefficients ai and bj in Eq. (1). C. Cross Validation Results The results of 5-fold cross validation are given in Table II. According to both the 5-fold cross validation results, the model corresponding to m = 0 and n = 3 has the lowest RMSE. The corresponding model has the following form: y(t) = b0 u(t) + b1 u(t − 1) + b2 u(t − 2) + c
n−1 X
bj u(t − j − 1)
(4)
In general, the addition of Twitter data improves the prediction with past CDC data alone. We plot the Twitter dataset (number of tweets normalized to the same scale as CDC data) and predicted values of the percentage of weighted ILI visits (5-fold cross validation) against CDC data in Figure 8 to illustrate the effectiveness of the prediction model. It may be somewhat counterintuitive that the model resulting in the lowest RMSE is the one that uses only Twitter data (m = 0 and n = 3). After all, strong autoregression of flu epidemics without the use of Twitter data have been shown in the literature of surveillance. There are several explanations for the test outcome, and the cause of the outcome may very well be a combination of the following factors:
j=0
i=2 m X
B. Cross Validation Test Description
(3)
j=0
where yˆ(t) represents the predicted CDC data in week t. It can be verified from the above equations that to predict the 5
8
tweets are highly correlated with ILI activity in CDC data with a Pearson correlation coefficient of 0.9846. We build auto-regression models to predict number of ILI cases in a population as percentage of visits to physicians in successive weeks. We tested our regressive models with the historic CDC data and verified that Twitter data substantially improves our model’s accuracy in predicting ILI cases. In view of the lag inherent in CDC’s ILI reports, Twitter data provides near real time assessment of influenza activity and can be used to effectively predict current ILI activity levels. Our approach to flu trends tracking using online social network provides an opportunity to significantly enhance public health preparedness among the masses for influenza epidemic and other large scale pandemic.
% physician visits (CDC) Twitter Data Predicted Flu Trend
7
percentage of ILI visits
6
5
4
3
2
1
0
20 w 19 w 18 w 17 w 16 w 15 w 14 w 13 w 12 w 11 w 10 w 9 w 8 w 7 w 6 w 5 w 4 w 3 w 2 w 1 w 52 w 51 w 50 w 49 w 48 w 47 w 46 w 45 w 44 w 43 w 42 w
Fig. 8. Twitter dataset normalized to the same scale as CDC data along with its predicted values for percentage of weighted ILI visits(5-fold cross validation) n=0 m=0 m=1 m=2
n=1 0.2996 0.2703 0.2712
0.2766 0.2716
n=2 0.2381 0.2488 0.3487
VII. ACKNOWLEDGEMENTS This research is supported in parts by the National Institutes of Health under grant 1R43LM010766-01 and National Science Foundation under grant CNS-0953620.
n=3 0.2367 0.2454 0.3488
R EFERENCES
TABLE II
[1] F. Jordans, “WHO working on formulas to model swine flu spread,” 2009. [2] N. M. Ferguson, D. A. Cummings, S. Cauchemez, C. Fraser, S. Riley, A. Meeyai, S. Iamsirithaworn, and D. S. Burke, “Strategies for containing an emerging influenza pandemic in southeast asia,” Nature, vol. 437, 2005. [3] I. Longini, A. Nizam, S. Xu, K. Ungchusak, W. Hanshaoworakul, D. Cummings, and M. Halloran, “Containing pandemic influenza at the source,” Science, vol. 309, no. 5737, 2005. [4] J. Espino, W. Hogan, and M. Wagner, “Telephone triage: A timely data source for surveillance of influenza-like diseases.” in AMIA: Annual Symposium Proceedings, 2003. [5] M. S, “Evaluation of over-the-counter pharmaceutical sales as a possible early warning indicator of human disease.” in Johns Hopkins University APL Technical Digest, 2003. [6] J. Ginsberg, M. H. Mohebbi, R. S. Patel, L. Brammer, M. S. Smolinski, and L. Brilliant, “Detecting influenza epidemics using search engine query data,” Nature, vol. 457, 2009. [7] A. Sitaram and B. A. Huberman, “Predicting the future with social media,” in Social Computing HP Lab, Palo Alto, USA, 2010. [8] T. Sakaki, M. Okazaki, and Y. Matsuo, “Earthquake shakes twitter users: real-time event detection by social sensors,” in 19th international conference on World wide web, Raleigh, North Carolina, USA, 2010. [9] J. Leskovec, L. Backstrom, and J. Kleinberg, “Meme-tracking and the dynamics of the news cycle.” International Conference on Knowledge Discovery and Data Mining, France, vol. 495, no. 978, 2009. [10] M. Motoyama, B. Meeder, K. Levchenko, G. M. Voelker, and S. Savage, “Measuring online service availability using twitter.” Workshop on online social networks, Boston, Massachusetts, USA, 2010. [11] A. Mislove, “Pulse of the nation: U.S. mood throughout the day inferred from twitter,” 2010. [12] L. Chen, H. Achrekar, B. Liu, and R. Lazarus, “Vision: towards real time epidemic vigilance through online social networks: introducing sneft – social network enabled flu trends.” ACM Mobile Cloud Computing and Services, San Francisco, California, June 2010. [13] W. Gauvin, B. Ribeiro, D. Towsley, B. Liu, and J. Wang, “Measurement and gender-specific analysis of user publishing characteristics on myspace,” IEEE Networks, September 2010. [14] R. Lazarus, K. Kleinman, I. Dashevsky, C. Adams, P. Kludt, A. DeMaria, R. Jr., and Platt, “Use of automated ambulatory-care encounter records for detection of acute illness clusters, including potential bioterrorism events,” 2002. [15] L. Ljung, System Identification: Theory for the User. Upper Saddle River, NJ: Prentice-Hall, Inc., 1999. [16] G. C. Goodwin and K. S. Sin, Adaptive Filtering Prediction and Control. Prentice-Hall, Inc., 1984.
ROOT MEAN SQUARED ERRORS FROM 5- FOLD CROSS VALIDATION . m AND n ARE DEFINED IN E Q . (1). T HE m AND n VALUES SPECIFY THE MODEL THAT RESULTS IN THE RMSE IN THE CORRESPONDING ROW AND COLUMN RESPECTIVELY. T HE LOWEST
RMSE IN THE TABLE IS HIGHLIGHTED .
1) The Twitter data provides a real-time assessment of the flu epidemic (i.e. the availability of Twitter data in week t in the prediction of physician visits also in week t as shown in Eq. (2)), while we assume that the CDC data has 2 weeks of lag in data reporting and aggregation (see Eq. (2)). As it is shown earlier in the paper, there is strong correlation between the Twitter data and the CDC data. Hence, the more timely Twitter data can alone capture the flu trend. 2) The time period in which the experiment is conducted was not significantly influenced by events that might perturb the Twitter data. Hence, Twitter data reflects true scope of the epidemic. Again, with 2 weeks of lead in reporting compared to the CDC data, the Twitter data provides better information than the staled CDC data in prediction. 3) We have limited number of samples (31) for our experiment. For a complex model, say an ARX model with 2 past CDC data terms, 3 Twitter data terms and a constant term for a total of 6 coefficients to be estimated, the model can be over-trained (over-fitted) and results in worse performance during cross-validation. VI. C ONCLUSIONS In this paper, we investigated the use of a previously untapped data source, namely, messages posted on Twitter to track and predict influenza epidemic situation in the real world. Our results have shown that the number of flu related 6