F1000Research 2018, 7:233 Last updated: 27 FEB 2018
RESEARCH ARTICLE
Predicting ionizing radiation exposure using biochemically-inspired genomic machine learning [version 1; referees: awaiting peer review] Jonathan Z.L. Zhao1,2, Eliseos J. Mucaki1, Peter K. Rogan
1-5
1Department of Biochemistry, Schulich School of Medicine and Dentistry, Western University, London, ON, N6A 2C1, Canada 2Department of Computer Science, Faculty of Science, Western University, London, ON, N6A 2C1, Canada 3Department of Epidemiology & Biostatistics, Schulich School of Medicine and Dentistry, Western University, London, ON, N6A 2C1, Canada 4Cytognomix Inc., London, ON, N5X 3X5, Canada 5Department of Oncology, Schulich School of Medicine and Dentistry, Western University, London, ON, N6A 2C1, Canada
v1
First published: 27 Feb 2018, 7:233 (doi: 10.12688/f1000research.14048.1)
Open Peer Review
Latest published: 27 Feb 2018, 7:233 (doi: 10.12688/f1000research.14048.1)
Abstract Background: Gene signatures derived from transcriptomic data using machine learning methods have shown promise for biodosimetry testing. These signatures may not be sufficiently robust for large scale testing, as their performance has not been adequately validated on external, independent datasets. The present study develops human and murine signatures with biochemically-inspired machine learning that are strictly validated using k-fold and traditional approaches. Methods: Gene Expression Omnibus (GEO) datasets of exposed human and murine lymphocytes were preprocessed via nearest neighbor imputation and expression of genes implicated in the literature to be responsive to radiation exposure (n=998) were then ranked by Minimum Redundancy Maximum Relevance (mRMR). Optimal signatures were derived by backward, complete, and forward sequential feature selection using Support Vector Machines (SVM), and validated using k-fold or traditional validation on independent datasets. Results: The best human signatures we derived exhibit k-fold validation accuracies of up to 98% (DDB2, PRKDC, TPP2, PTPRE, and GADD45A) when validated over 209 samples and traditional validation accuracies of up to 92% (DDB2, CD8A, TALDO1, PCNA, EIF4G2, LCN2, CDKN1A, PRKCH, ENO1, and PPM1D) when validated over 85 samples. Some human signatures are specific enough to differentiate between chemotherapy and radiotherapy. Certain multi-class murine signatures have sufficient granularity in dose estimation to inform eligibility for cytokine therapy (assuming these signatures could be translated to humans). We compiled a list of the most frequently appearing genes in the top 20 human and mouse signatures. More frequently appearing genes among an ensemble of signatures may indicate greater impact of these genes on the performance of individual signatures. Several genes in the signatures we derived are present in previously proposed signatures. Conclusions: Gene signatures for ionizing radiation exposure derived by machine learning have low error rates in externally validated, independent datasets, and exhibit high specificity and granularity for dose estimation.
Referee Status: AWAITING PEER REVIEW
Discuss this article Comments (0)
Page 1 of 16
F1000Research 2018, 7:233 Last updated: 27 FEB 2018
Corresponding author: Peter K. Rogan (
[email protected]) Author roles: Zhao JZL: Conceptualization, Data Curation, Formal Analysis, Investigation, Methodology, Software, Validation, Writing – Original Draft Preparation, Writing – Review & Editing; Mucaki EJ: Conceptualization, Investigation, Methodology, Software, Supervision; Rogan PK: Conceptualization, Formal Analysis, Funding Acquisition, Investigation, Methodology, Project Administration, Supervision, Writing – Original Draft Preparation, Writing – Review & Editing Competing interests: PKR cofounded CytoGnomix Inc. A patent application on biochemically inspired gene signatures derived by machine learning is pending (US Pat. App. Ser. No. 62/202,796). How to cite this article: Zhao JZL, Mucaki EJ and Rogan PK. Predicting ionizing radiation exposure using biochemically-inspired genomic machine learning [version 1; referees: awaiting peer review] F1000Research 2018, 7:233 (doi: 10.12688/f1000research.14048.1) Copyright: © 2018 Zhao JZL et al. This is an open access article distributed under the terms of the Creative Commons Attribution Licence, which permits unrestricted use, distribution, and reproduction in any medium, provided the original work is properly cited. Grant information: Natural Sciences and Engineering Research Council of Canada (NSERC Discovery Grant RGPIN-2015-06290); the Canadian Foundation for Innovation; Canada Research Chairs, and CytoGnomix Inc. The funders had no role in study design, data collection and analysis, decision to publish, or preparation of the manuscript. First published: 27 Feb 2018, 7:233 (doi: 10.12688/f1000research.14048.1)
Page 2 of 16
F1000Research 2018, 7:233 Last updated: 27 FEB 2018
Introduction Potential radiation exposures from industrial nuclear accidents, military incidents, or terrorism are threats to public health1. There is a need for large scale biodosimetry testing, which requires efficient screening techniques to differentiate exposed individuals from non-exposed individuals and to determine the severity of exposure2. Current diagnostic techniques, including the cytogenetic gold standard3–6, may require several days to provide accurate dose estimates1,7 of large cohorts. To address the need for faster diagnostic techniques that accurately measure radiation exposures, gene signatures based on transcriptomic data have been introduced7–10. Probit regression models of radiation response using 25 probes on peripheral blood samples achieved up to 90% accuracy for distinguishing between irradiated blood samples and unirradiated controls9. A 74-gene classifier based on nearest centroid expression levels was 98% accurate in distinguishing four levels of irradiation from controls10. This level of performance implies that samples exposed to different levels of radiation may be distinguishable based on mRNA expression levels of different genes. While this suggests the feasibility of transcriptional modeling of radiation responses, validation with external datasets is required to establish its reliability for rapid diagnostics. A caveat of these signatures is that they have not all been externally validated on datasets independent of the source data used for model development. A 29-gene signature modelled using a support vector machine (SVM) was externally validated on such a dataset, resulting in 80% accuracy in distinguishing higher (≥8Gy) from lower dose (≤2Gy) radiation exposure in novel samples7. The present study derives signatures with improved performance on externally validated samples by employing a different selection of modelling techniques. The machine learning pipeline used here addresses some of the previous limitations through a more rigorous feature selection process and stricter validation procedures. Previously, the Student’s t-test7, the F-test10, and correlation coefficients9 were used to identify potential radiation biomarker genes. Although statistical criteria can distinguish genes that are differentially expressed upon radiation exposure, they do not eliminate expressed genes with redundant responses to radiation exposure. Redundancy increases the possibility of overfitting, thereby reducing the generalizability of these models to predict responses in independent datasets. We address this limitation with the information theory-based criterion for gene selection known as minimum redundancy maximum relevance (mRMR)11–13, which ranks genes according to shared mutual information between expression levels and radiation dose (relevance), and by minimizing mutual information shared by expression values of these and other genes (redundancy)11,12. mRMR outperforms ranking criteria based solely on maximizing relevance12. In contrast with heuristic approaches like differential expression, we only consider genes with evidence of a relationship to radiation response, which significantly limits the number of model features. Biochemicallyinspired genomic machine learning (ML) has been used to derive high performing gene signatures that predict chemotherapy and hormone therapy responses13–15. From an initial set of mRMRderived biochemically relevant genes, wrapper approaches for feature selection16 are used to find an optimal set of genes that predict exposure to radiation.
It can be challenging to obtain highly accurate models that perform well on externally validated samples for several reasons. Aside from biases in training data, batch effects and lack of reproducibility may introduce systematic and random sources of variability into gene expression microarray data. Different source datasets can impact data normalization, reducing model performance. We utilize two validation procedures. The first is a signature-centric approach that mirrors external k-fold validation7. The limitation of signature-centric validation is that, while signatures allow for the identification of important genes associated with radiation response, a tangible model is required to generate actual diagnostic predictions. To address this limitation, we also use a second model-centric approach, which we term “traditional validation”. This procedure applies quantile normalization to training and test data before a model is fitted to the training data. This quantile method has been shown to be more effective than scaling, loess, contrast, and non-linear methods in reducing variation between microarray data17. Model validation was not expected to perform as well as signature validation, because quantile normalization is not always successful in eliminating variation between microarray datasets, whereas k-fold validation is independent of this source of variation. This study shows that robust model validation is a critical step in reproducibly predicting which individuals have been exposed to significant levels of radiation.
Methods Datasets Murine gene expression datasets18 were obtained from peripheral blood (PB) mononuclear cell samples of ten-week old C57B16 mice that either received total body radiation at 50 cGy, 200 cGy, or 1000 cGy or were not exposed. Post-exposure, total RNA was isolated after 6 hours and expression was determined by microarray analysis using Operon Mouse V3.0.1 (Gene Expression Omnibus (GEO): GPL4783 from GSE10640[GPL4783])19 and Operon Mouse V4.0 arrays (GEO: GPL6524 from GSE10640[GPL6524])19. Similar analyses were performed with human expression microarrays18, including datasets GEO: GSE6874[GPL4782]9, GSE10640[GPL6522]19, GSE172520, and GSE70121. GSE6874 and GSE10640 consist of PB samples collected 6 hours post-exposure from healthy donors and patients undergoing total body irradiation at 150–200 cGy analyzed with Operon Human V3.0.2 (GEO: GPL4782) and Operon Human V4.0 (GEO: GPL6522) microarrays. GSE10640[GPL6522] consists of 32 patients treated with alkylator-based chemotherapy without radiation. GSE1725 contains lymphoblastoid cell line samples derived from 57 subjects treated with 500 cGy. RNA was extracted 4 hours after exposure. Expression was measured using Affymetrix Human Genome U95 Version 2 Array (GEO: GPL8300). GSE701 contains lymphoblastoid cell lines from Fondation Jean Dausset-CEPH which were irradiated at 300 cGy or 1000 cGy and extracted 1–24 hours after exposure. Expression was measured using the Affymetrix Human Genome U95A Array (GEO: GPL91).
Preprocessing (Figure 1, panel i) Rows and columns of microarray data that are less than 95% complete were removed and any remaining missing values were imputed using the nearest-neighbor algorithm. Only genes that Page 3 of 16
F1000Research 2018, 7:233 Last updated: 27 FEB 2018
Figure 1. Flow chart of the biochemically inspired machine learning pipeline used to derive gene signatures. In panel (v), k-fold validation splits data into k sections, where each section acts as a test set in turn while the remaining sections act as a training set. Panel (v) depicts k-fold validation for k = 3. Coloured circles represent the samples in a dataset where different colours represent different radiation doses. In panel (vi), quantile normalization forces data into the same distribution. To demonstrate this, thirty random genes were chosen to form a signature. The histograms on the left represent the distributions of expression levels of these genes in the pre-normalized datasets GSE1725 and GSE6874[GPL4782]. The histograms on the right represent the distribution of expression levels of the same genes post-normalization.
are common across all datasets have been retained. Expression values of each probe were transformed to z-scores and the mean expression value of probes for the same gene have been assigned as the expression of each gene.
Biochemically-inspired gene selection13–15 (Figure 1, panel ii) A literature search has been conducted to identify genes implicated in radiation response using the search queries “radiation genes,” “radiation response genes,” and “radiation signatures” on PubMed. Cited genes comprise those differentially expressed after radiation exposure, genes present in DNA repair databases and other radiation signatures, and evolutionarily conserved genes that were highly expressed in radio-resistant species. A list of 998 genes was compiled22–35, Supplementary Table X) for deriving signatures. Minimum Redundancy Maximum Relevance (mRMR) gene ranking11,12 (Figure 1, panel iii) Rank is assigned by incremental selection of genes based on the mutual information difference (MID) criterion11,12. Highly ranked genes have expression information that shares mutual
information with radiation exposure and shares little information with expression of other genes. The MID criterion used to select the next ranked gene is max I (i, h) − | S1 | ∑ I (i, j ) , where i is a gene selected from Ω, the total gene space, S is the set of genes selected before i, |S| is the number of genes selected before i, I(i,h) is the mutual information between expression of gene i and radiation dose (h), and I(i,j) is the mutual information between expression of gene i and expression of gene j. i ∈Ω
j ∈S
Support Vector Machine (SVM) Learning SVM models are classifiers that use hyperplane boundaries to separate samples into exposure classes by maximizing the distance between the separating hyperplanes and samples of each class. The fitcecoc function of MATLAB 2017a’s Statistics and Machine Learning Toolbox36 with a SVM template was used to fit SVM models to training data. The fitcecoc function was used because it allows the fitting of multiclass models, which was required for analysis of murine samples that were irradiated at four different exposure levels. The SVM models use the Gaussian radial basis function kernel and a range of selected Page 4 of 16
F1000Research 2018, 7:233 Last updated: 27 FEB 2018
box-constraint and kernel-scale parameters. The box-constraint, denoted by the variable C, determines how severely misclassifications are penalized during training. The kernel-scale, denoted σ, represents the width of the Gaussian radial basis function. These parameters collectively control the tradeoff between underfitting and overfitting37. After feature selection, a grid search is performed to determine the optimal (C,σ) combination for values of C and σ between 1 and 100000 (inclusive) by powers of 10 such that C ≥ σ.
Feature selection (FS) (Figure 1, panel iv)16 Greedy feature selection was used to derive signatures. Complete sequential feature selection (CSFS) sequentially adds genes to an initially empty base set. The added gene is the highest mRMRranked gene that is not already included. This is repeated until all genes have been evaluated and the best performing subset of genes is identified. Forward sequential feature selection (FSFS) sequentially adds genes from the top 50 mRMR ranked genes
to an initially empty base set. The added gene is the one whose addition improves the model by the greatest margin. Backward sequential feature selection (BSFS) sequentially removes genes from the top 30 mRMR ranked genes. The gene removed is the one whose removal causes the greatest improvement in the model. For BSFS and FSFS, we measure model improvement using misclassification or log loss during k-fold validation (see Performance metrics section below). Genes are added or removed until model performance plateaus. During feature selection, C and σ parameters need to be chosen for SVM learning (see SVM Learning section above). Thus, each signature is characterized by the feature selection algorithm used, the dataset used to derive it, and the C-σ combination used for its SVM models during feature selection. This leads to a large number of possible signatures (see Supplementary Files Y1–Y7). Supplementary Files Y1–Y3 and Supplementary Files Y6–Y7 contain k-fold validation results from which the top 20 signatures (evaluated using average validation log loss), in particular, were analyzed (Figure 2, Figure 3, Figure 6, Figure 7).
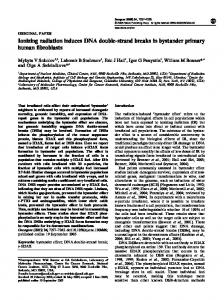
Figure 2. Heat map depicting the gene compositions of the top 20 murine signatures derived from different datasets: GSE6874[GPL4783] and GSE10640[GPL6524]. Gene frequency values are first scaled within datasets and then scaled across datasets to ensure values between 0 and 1. Page 5 of 16
F1000Research 2018, 7:233 Last updated: 27 FEB 2018
Figure 3. Scatter plot depicting the mutual information each gene’s expression shares with radiation exposure (averaged over GSE6874[GPL4783] and GSE10640[GPL6524]). The size of each circle is proportional to the frequency at which the gene appears in the top 20 murine signatures ranked by log loss averaged over GSE6874[GPL4783] and GSE10640[GPL6524]. The genes presented match those of the Figure 2.
Validating signatures (Figure 1, panel v) Stratified k-fold validation was used to validate signatures. Samples of the validation dataset were partitioned into k sets, comprised of an approximately equal distribution of radiation levels. For validation, each set was used to test a model trained on the remaining sets, resulting in predictions for all samples in the dataset. Advantages of this approach are that variation between datasets is not pertinent and that signatures can be validated on differently labeled datasets (with samples irradiated at different levels). Validating models (Figure 1, panel vi) Model validation requires separate training and test datasets (the training set is often used for FS). Genes from the signature are extracted from the training and test sets and their expression values are quantile normalized by sample. An important distinction between our approach and a previous study7 is that quantile normalization is applied immediately before validation, so expression of only the genes present in the signature being validated have been normalized. By contrast, previous approaches perform quantile normalization over entire datasets; while this reduces variability in expression values within datasets, it also suppresses the dynamic range, with potential consequential effects on the prognostic value of expression data. After normalization, an SVM model was fit to training datasets and used to generate predictions from the test dataset.
Performance metrics (Figure 1, panel vii) Performance was determined by comparing predicted radiation doses with actual radiation exposures of each sample. Metrics included misclassification error rate, goodness-of-fit, and multiclass log loss. Misclassification is the percentage of samples that were incorrectly classified, goodness-of-fit is the average absolute value difference between predicted radiation exposure and actual radiation exposure, and multi-class log loss is − 1 ∑ iN=1 ∑ Mj =1 yij ln pij N where N is the number of samples, M is the number of class labels, pij is the predicted probability that observation i is in class j, and yij is an indicator variable equal to 1 if sample i is in class j and 0 otherwise.
Results We discovered radiation gene signatures using the microarray data of human and mouse peripheral blood samples and human lymphoblastoid cell lines, which were validated either according to signature (Figure 1, panel v) or with the respective model (Figure 1, panel vi). The murine data were obtained from a wider range of radiation exposure levels (0 cGy, 50 cGy, 200 cGy, 1000 cGy) than the human whole body radiation datasets, which were binary comparisons of radiation effects (0 cGy vs. 150-200 cGy, 0 cGy vs. 500 cGy, or 300 cGy vs. 700 cGy). This made possible the discovery of murine gene signatures with finer granularity for discriminating individuals exposed to different
Page 6 of 16
F1000Research 2018, 7:233 Last updated: 27 FEB 2018
exposure levels, which is not currently feasible with the human samples.
Murine gene signatures Table 1 displays the murine signatures derived using our pipeline which had the best performance metrics during k-fold validation on an independent dataset. In addition to the signature information, we report the feature selection algorithm (FS Algorithm) used to discover the signature, the internal validation performance metrics (FS Misclassification fraction and FS Log Loss function). Validation performance metrics on external dataset(s) are indicated by the Validation Misclassification fraction, Validation Log Loss function, and Validation goodness of fit or GoF). In the FS Misclass. and FS Log Loss columns, one value is always N/A because signatures are derived by optimizing either misclassification or log loss, but never both. The remaining murine signatures are presented in Supplementary Files Y6 and Supplementary Files Y7. A list of the most consistently appearing genes in the best performing signatures were obtained by pooling the top 20 murine signatures (assessed by validation log loss) from GSE6874[GPL4783] and GSE10640[GPL6524], and respectively collating the top 17 and 19 most frequent genes. The union of these two sets comprises 33 genes displayed within a heat map based on the frequencies of each gene (Figure 2). Surprisingly, the compositions of signatures derived from both datasets are not as similar as one may expect. The genes that appear more frequently in signatures derived from one dataset infrequently appear in the other even though both datasets consisted of the same types of samples irradiated at the same exposure levels. The shared mutual information of these expressed genes with radiation dose (Figure 3) indicates whether only high mutual information genes appear in the best signatures or whether some lower mutual information genes may also be selected by our feature
selection algorithms. The frequency of each gene among these signatures (represented by diameter of the circle) correlates with the mutual information between expression and radiation dose (ρ = 0.8016). However, it would be an oversimplification to create signatures based solely upon mutual information, since some genes in lower performing signatures exhibit higher mutual information content. Development of accurate signatures requires more than a collection of gene features whose individual expression values share information with radiation dose, since many of these genes may reveal similar information, and redundant machine learning model features. For instance, Bax and Blnk are both common among the best murine signatures, even though Blnk shares much more mutual information with radiation dose than Bax expression. Since Blnk and Bax are involved in completely different pathways – Bax is an inducer of apoptosis38 whereas Blnk is involved in a B-cell antigen receptor signaling pathway required for optimal B-cell development39, they provide different types of information to the overall model. Conversely, we also observe that genes with high information content, such as Ms4a1, may appear less frequently than genes with lower information content, such as Glipr2. Although mRMR prioritizes genes with non-redundant, complementary contributions, subsequent wrapper steps of forward and backward sequential feature selection occur independently of the mRMR ranking. mRMR reduces the list of features considered by these algorithms, but it is possible for only high mutual information genes to be selected for the final signature. Thus, the inclusion of lower mutual information genes, such as Ube2v1 and Urod, reinforces the effectiveness of the mRMR method. The cellular roles of these protein products (Figure 2 and Figure 3) demonstrate a variety of pathways and functions (Figure 4), some of which have previously discussed40. These include DNA repair genes (Polk23 and Pold126), inducers of apoptosis (Ei2430, Bax30, and Phlda330), chaperonins (Cct322 and
Table 1. Best murine signatures assessed by K-Fold validation. Signature (C, σ)
FS1 Algo.
FS1 Misclass.
FS1 Log Loss
Validation Misclass.
Validation Log Loss
Validation GoF2
a) Derived from GSE6874[GPL4783] and 5-fold Validated on GSE10640[GPL6524] (n = 75) Phlda3 Blnk Bax Cdkn1a Cct3 Pold1 Cd79b Ei24 Eif2ak4 Ccng1 Glipr2 Hexb Pou2af1 Swap70 Apex1 Ptpn1 Mdm2 Tpst1 Ly6e Sdcbp (10, 10)
BSFS
N/A
0.08
0.08 ± 0.00
0.29 ± 0.02
15 ± 0
Phlda3 Blnk Bax Cdkn1a Cct3 Tfam Pold1 Cd72 Cd79b Ei24 Galt Eif2ak4 Ms4a1 Ccng1 Glipr2 Gga2 Sh3bp5 Hexb Gcdh Pou2af1 Swap70 Apex1 Ptpn1 Mdm2 Tpst1 Ly6e Sdcbp Lcn2 Suclg2 (100000, 100)
BSFS
0.04
N/A
0.10 ± 0.00
0.23 ± 0.01
26 ± 1
Cdkn1a Blnk Phlda3 Sdcbp Ccng1 (1000, 100)
FSFS
N/A
0.13
0.17 ± 0.00
0.49 ± 0.01
12 ± 0
b) Derived from GSE10640[GPL6524] and 6-fold Validated on GSE6874[GPL4783] (n = 103)
1
Blnk Ccng1 Tpst1 Pole4 Eif2ak4 Atp5l (100000, 100)
FSFS
N/A
0.12
0.11 ± 0.00
0.35 ± 0.01
25 ± 0
Blnk Polk Sod3 Ube2v1 Eif2ak4 (10000, 100)
FSFS
N/A
0.22
0.20 ± 0.00
0.64 ± 0.01
18 ± 0
FS: Feature Selection. 2GoF: Goodness of Fit. Page 7 of 16
F1000Research 2018, 7:233 Last updated: 27 FEB 2018
Figure 4. Depiction of the major cellular functions of most frequently appearing genes of the best murine signatures (same genes presented in Figure 1 and Figure 2).
Cct722), cell cycle regulators (Ccng127 and Cdkn1a30), B-cell development genes (Cd79b19 and Blnk19), B-cell antigens (Cd729 and Ms4a119), and a stress-response kinase that inhibits protein synthesis globally (Eif2ak425). One of the best murine signatures derived from GSE10640[GPL4783]: Phlda3, Blnk, Bax, Cdkn1a, Cct3, Pold1, Cd79b, Ei24, Eif2ak4, Ccng1, Glipr2, Hexb, Pou2af1, Swap70, Apex1, Ptpn1, Mdm2, Tpst1, Ly6e, Sdcbp consistently achieved